You are not logged in.
This means you
CAN ONLY VIEW reports that were published prior to Thursday, March 20, 2025.
You
MUST UPGRADE YOUR MEMBERSHIP if you want to see any current reports.
AFTER MARKET UPDATE - FRIDAY, AUGUST 25TH, 2023
Previous After Market Report Next After Market Report >>>
|
|
|
|
DOW |
+247.48 |
34,346.90 |
+0.73% |
|
Volume |
749,852,401 |
-26% |
|
Volume |
3,996,865,500 |
-11% |
|
NASDAQ |
+126.67 |
13,590.65 |
+0.94% |
|
Advancers |
1,614 |
58% |
|
Advancers |
2,247 |
53% |
|
S&P 500 |
+29.40 |
4,405.71 |
+0.67% |
|
Decliners |
1,151 |
42% |
|
Decliners |
1,995 |
47% |
|
Russell 2000 |
+7.35 |
1,853.63 |
+0.40% |
|
52 Wk Highs |
24 |
|
|
52 Wk Highs |
37 |
|
|
S&P 600 |
+1.82 |
1,196.69 |
+0.15% |
|
52 Wk Lows |
64 |
|
|
52 Wk Lows |
211 |
|
|
Last week's distributional action, clearly negative breadth, and waning leadership signaled a more worrisome market correction (M criteria). Greater caution is called for and disciplined investors should be ready to reduce exposure and raise cash by selling any weakening stocks on a case-by-case basis.
|
 |
Major Indices Rose but Leadership Remained Thin
Kenneth J. Gruneisen - Passed the CAN SLIM® Master's Exam
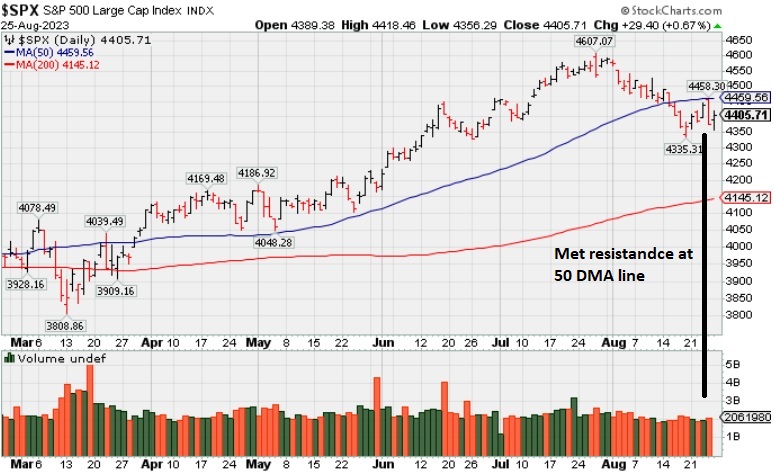
Friday's choppy session saw the major indices settle near their best levels of the session. Volume totals reported were lighter than the prior session on the NYSE and on the Nasdaq exchange, indicative of lackluster institutional buying demand. Breadth was positive as advancers led decliners by a 4-3 margin on the NYSE and by a narrower margin on the Nasdaq exchange. There were 8 high-ranked companies from the Leaders List that hit a new 52-week high and were listed on the BreakOuts Page. New 52-week lows totals solidly outnumbered new 52-week highs totals on both the NYSE and on the Nasdaq exchange. The major indices are in a correction (M criteria). New buying efforts should be avoided until a new confirmed rally marked by a solid follow-through day.
PICTURED: The S&P 500 Index met resistance at its 50-day moving average (DMA) line and slumped.
Renewed buying interest in the mega-cap stocks and some generally broad-based buying interest that left all 11 S&P 500 sectors in positive territory by the closing bell. The best-performing sectors were consumer discretionary (+1.1%), energy (+1.1%), industrials (+0.9%), information technology (+0.8%), and utilities (+0.8%).
25 of the 30 Dow Jones Industrial Average components finished higher. Boeing (BA +2.81%) was the best-performing component in the Dow Jones Industrial Average one day after being the worst performing component. Its turnaround was helped by a Bloomberg report that Boeing is getting ready to resume deliveries of its 737 MAX to China.
The 2-yr note yield went as high as 5.10% before settling at 5.05%. The 10-yr note yield touched 4.27% soon after Fed Chair Powell's speech but settled the day unchanged at 4.24%. The Fed Chair stuck by the Fed's 2.0% inflation target. He reiterated that the process of getting inflation back down to 2.0% still has a long way to go.
|
 Kenneth J. Gruneisen started out as a licensed stockbroker in August 1987, a couple of months prior to the historic stock market crash that took the Dow Jones Industrial Average down -22.6% in a single day. He has published daily fact-based fundamental and technical analysis on high-ranked stocks online for two decades. Through FACTBASEDINVESTING.COM, Kenneth provides educational articles, news, market commentary, and other information regarding proven investment systems that work in good times and bad.
Comments contained in the body of this report are technical opinions only and are not necessarily those of Gruneisen Growth Corp. The material herein has been obtained from sources believed to be reliable and accurate, however, its accuracy and completeness cannot be guaranteed. Our firm, employees, and customers may effect transactions, including transactions contrary to any recommendation herein, or have positions in the securities mentioned herein or options with respect thereto. Any recommendation contained in this report may not be suitable for all investors and it is not to be deemed an offer or solicitation on our part with respect to the purchase or sale of any securities. |
|
 |
Bank, Semiconductor, and Gold & Silver Indexes Led Decliners
Kenneth J. Gruneisen - Passed the CAN SLIM® Master's Exam
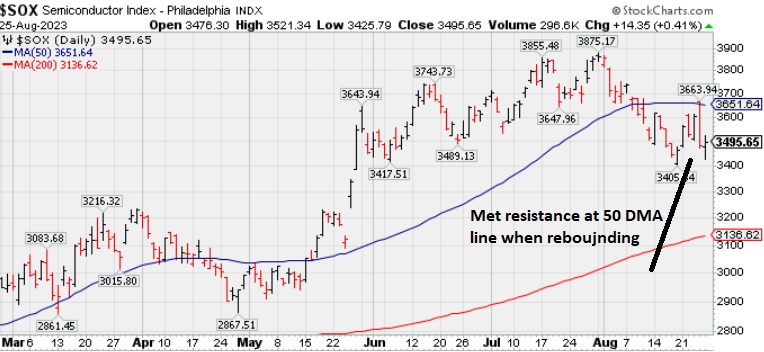
The Bank Index ($BKX -0.47%) fell while the Broker/Dealer Index ($XBD +0.08%) and Retail Index ($RLX +0.06%) both were little changed. The Semiconductor Index ($SOX -0.81%) led the tech sector lower and the Networking Index ($NWX -0.15%) inched lower while the Biotech Index ($BTK +0.08%) finished flat. The Gold & Silver Index ($XAU -1.61%) lost ground and the Oil Services Index ($OSX -0.16%) inched lower while the Integrated Oil Index ($XOI +0.58%) posted a modest gain.
PICTURED: The Semiconductor Index ($SOX -0.81%) met resistance at its 50-day moving average (DMA) line when rebounding.
| Oil Services |
$OSX |
89.66 |
-0.14 |
-0.16% |
+6.92% |
| Integrated Oil |
$XOI |
1,842.83 |
+10.67 |
+0.58% |
+3.11% |
| Semiconductor |
$SOX |
3,453.05 |
-28.25 |
-0.81% |
+36.37% |
| Networking |
$NWX |
769.38 |
-1.16 |
-0.15% |
-1.78% |
| Broker/Dealer |
$XBD |
497.16 |
+0.39 |
+0.08% |
+10.69% |
| Retail |
$RLX |
3,501.25 |
+2.13 |
+0.06% |
+27.13% |
| Gold & Silver |
$XAU |
113.75 |
-1.86 |
-1.61% |
-5.88% |
| Bank |
$BKX |
80.03 |
-0.37 |
-0.47% |
-20.64% |
| Biotech |
$BTK |
5,217.63 |
+4.09 |
+0.08% |
-1.20% |
|
|
|
 |
PulteGroup Slumps Further Below its 50-Day Moving Average
Kenneth J. Gruneisen - Passed the CAN SLIM® Master's Exam
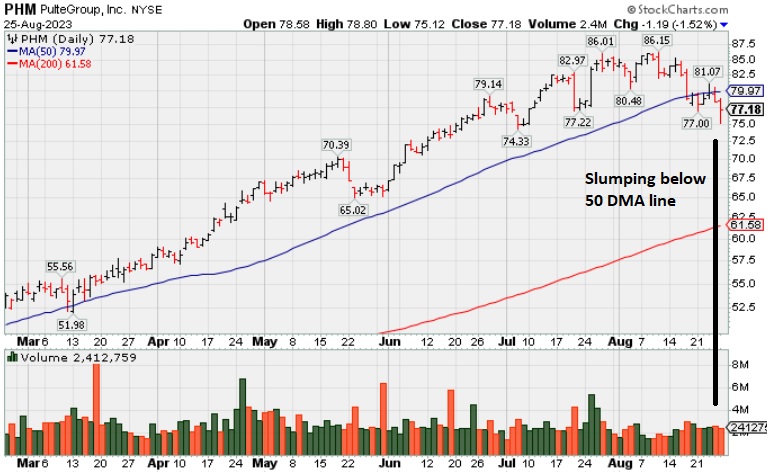
PulteGroup's (PHM -$1.19 or -1.52% to $77.18) slumped further today after sputtering below its 50-day moving average (DMA) line ($79.67) since a noted loss on 8/17/23 triggering a technical sell signal. A rebound above the 50 DMA line is needed for its outlook to improve. Recently reported earnings +18% for the Jun '23 quarter versus the year-ago period, below the +25% minimum guideline (C criteria) raising concerns. PHM was highlighted in yellow in the 4/25/23 mid-day report (read here) with pivot point cited based on its May 2021 high. It was last shown in great detail on 7/27/23 with an annotated graph under the headline, "Reversed After Reaching a New All-Time High".
This Building - Residential/Commercial firm broke a streak of 13 strong quarterly comparisons above the +25% minimum earnings guideline (C criteria). Annual earnings (A criteria) history has been strong. It has a 98 Earnings Per Share Rating.
The number of top-rated funds owning its shares rose from 1,709 in Dec '22 to 1,939 in Jun '23. Its current Up/Down Volume Ratio of 1.3 is an unbiased indication its shares have been under accumulation over the past 50 days. It has a Timeliness Rating of A and an Accumulation/Distribution Rating of D. |
|
|
Color Codes Explained :
Y - Better candidates highlighted by our
staff of experts.
G - Previously featured
in past reports as yellow but may no longer be buyable under the
guidelines.
***Last / Change / Volume data in this table is the closing quote data***
Symbol/Exchange
Company Name
Industry Group |
PRICE |
CHANGE
(%Change) |
Day High |
Volume
(% DAV)
(% 50 day avg vol) |
52 Wk Hi
% From Hi |
Featured
Date |
Price
Featured |
Pivot Featured |
|
Max Buy |
 STRL
-
NASDAQ
STRL
-
NASDAQ
Sterling Infrastructure
Bldg-Heavy Construction
|
$76.50
|
-1.37
-1.76% |
$78.51
|
47,532
11.48% of 50 DAV
50 DAV is 414,000
|
$83.81
-8.72%
|
12/14/2022
|
$32.41
|
PP = $33.72
|
|
MB = $35.41
|
Most Recent Note - 8/22/2023 6:18:13 PM
G - Hovering near its all-time high, very extended from any sound base, well above its 50 DMA line ($61) which defines support. Jun '23 quarterly earnings rose +37% on +13% sales revenues versus the year-ago period.
>>> FEATURED STOCK ARTICLE : Volume-Driven Gains Leave Construction Firm at All-Time High - 8/9/2023 |
View all notes |
Set NEW NOTE alert |
Company Profile |
SEC
News |
Chart |
Request a new note
C
A
S
I |
FIX
-
NYSE
Comfort Systems USA
Bldg-A/C and Heating Prds
|
$178.99
|
-0.43
-0.24% |
$181.23
|
79,613
37.55% of 50 DAV
50 DAV is 212,000
|
$183.04
-2.21%
|
4/27/2023
|
$148.85
|
PP = $152.23
|
|
MB = $159.84
|
 Most Recent Note - 8/25/2023 12:21:40 PM
G - Recently churning above average volume while hovering near its all-time high. Its 50 DMA line ($169.66) defines important near-term support to watch on pullbacks. Fundamentals remain strong.
>>> FEATURED STOCK ARTICLE : FIX Still Stubbornly Hovering Near High - 8/21/2023 |
View all notes |
Set NEW NOTE alert |
Company Profile |
SEC
News |
Chart |
Request a new note
C
A
S
I |
KOF
-
NYSE
Coca-Cola Femsa ADR
Beverages-Non-Alcoholic
|
$86.68
|
+0.46
0.53% |
$86.75
|
25,577
17.76% of 50 DAV
50 DAV is 144,000
|
$91.23
-4.99%
|
6/9/2023
|
$88.61
|
PP = $91.33
|
|
MB = $95.90
|
Most Recent Note - 8/22/2023 6:23:12 PM
G - Recently rebounding above the 50 DMA line ($84.18) helping its outlook to improve. Faces some near-term resistance due to overhead supply up to the $91 area. Its Relative Strength Rating is currently 88. Reported Jun '23 quarterly earnings +23% on +26% sales revenues versus the year-ago period, below the +25% minimum guideline (C criteria).
>>> FEATURED STOCK ARTICLE : 50-Day Moving Average Line has Acted as Resistance - 8/10/2023 |
View all notes |
Set NEW NOTE alert |
Company Profile |
SEC
News |
Chart |
Request a new note
C
A
S
I |
CLH
-
NYSE
Clean Harbors
Pollution Control
|
$169.16
|
+0.40
0.24% |
$170.53
|
31,028
8.52% of 50 DAV
50 DAV is 364,000
|
$178.33
-5.14%
|
3/10/2023
|
$136.89
|
PP = $136.74
|
|
MB = $143.58
|
Most Recent Note - 8/25/2023 12:17:27 PM
G - Still hovering near its all-time high with volume totals cooling. Its 50 DMA line ($166) defines important near-term support to watch on pullbacks. Reported earnings for the Jun '23 quarter -13% on +3% sales revenues versus the year-ago period, below the +25% minimum earnings guideline (C criteria), raising fundamental concerns.
>>> FEATURED STOCK ARTICLE : Volume Totals Have Been Cooling While Hovering Near High - 8/18/2023 |
View all notes |
Set NEW NOTE alert |
Company Profile |
SEC
News |
Chart |
Request a new note
C
A
S
I |
HUBB
-
NYSE
Hubbell
Electrical-Power/Equipmt
|
$319.18
|
+2.74
0.86% |
$320.91
|
132,796
31.03% of 50 DAV
50 DAV is 428,000
|
$340.06
-6.14%
|
4/25/2023
|
$262.85
|
PP = $257.51
|
|
MB = $270.39
|
Most Recent Note - 8/24/2023 7:09:37 PM
G - Perched only -6.9% off its all-time high but a rebound above the 50 DMA line ($319) is needed for its outlook to improve. Fundamentals remain strong after Jun '23 earnings rose +45% on +9% sales revenues versus the year-ago period. See the latest FSU analysis for more details and an annotated graph.
>>> FEATURED STOCK ARTICLE : Rebounded Near 50-Day Moving Average Line - 8/24/2023 |
View all notes |
Set NEW NOTE alert |
Company Profile |
SEC
News |
Chart |
Request a new note
C
A
S
I |
Symbol/Exchange
Company Name
Industry Group |
PRICE |
CHANGE
(%Change) |
Day High |
Volume
(% DAV)
(% 50 day avg vol) |
52 Wk Hi
% From Hi |
Featured
Date |
Price
Featured |
Pivot Featured |
|
Max Buy |
PHM
-
NYSE
PulteGroup
Bldg-Resident/Comml
|
$75.67
|
-2.71
-3.45% |
$78.80
|
897,165
34.91% of 50 DAV
50 DAV is 2,570,000
|
$86.16
-12.18%
|
4/25/2023
|
$65.17
|
PP = $64.01
|
|
MB = $67.21
|
Most Recent Note - 8/25/2023 4:48:47 PM
Sputtering below its 50 DMA line ($79.97) since a noted loss on 8/17/23 triggering a technical sell signal. A rebound above the 50 DMA line is needed for its outlook to improve. Recently reported earnings +18% for the Jun '23 quarter versus the year-ago period, below the +25% minimum guideline (C criteria) raising concerns. It will be dropped from the Featured Stocks list tonight. See the latest FSU analysis for more details and a new annotated graph.
>>> FEATURED STOCK ARTICLE : PulteGroup Slumps Further Below its 50-Day Moving Average - 8/25/2023 |
View all notes |
Set NEW NOTE alert |
Company Profile |
SEC
News |
Chart |
Request a new note
C
A
S
I |
AMPH
-
NASDAQ
Amphastar Pharm
Medical-Biomed/Biotech
|
$53.28
|
-0.26
-0.49% |
$54.10
|
56,224
12.55% of 50 DAV
50 DAV is 448,000
|
$67.66
-21.25%
|
5/15/2023
|
$43.56
|
PP = $44.15
|
|
MB = $46.36
|
Most Recent Note - 8/22/2023 6:16:23 PM
G - Stilll sputtering below its 50 DMA line ($57.23) after damaging volume-driven losses. A rebound above the 50 DMA line is needed for its outlook to improve. Fundamentals remain strong after it reported Jun '23 quarterly earnings +67% on +18% sales revenues versus the year-ago period. See the latest FSU analysis for more details and a new annotated graph.
>>> FEATURED STOCK ARTICLE : Rebound Above 50-Day Moving Average Needed for Outlook to Improve - 8/22/2023 |
View all notes |
Set NEW NOTE alert |
Company Profile |
SEC
News |
Chart |
Request a new note
C
A
S
I |
ANET
-
NYSE
Arista Networks
Computer-Networking
|
$178.84
|
-0.35
-0.20% |
$183.26
|
612,656
19.18% of 50 DAV
50 DAV is 3,195,000
|
$193.91
-7.77%
|
8/1/2023
|
$188.84
|
PP = $178.46
|
|
MB = $187.38
|
Most Recent Note - 8/24/2023 2:06:26 PM
Y - There was a "negative reversal" after gapping up today hitting a new all-time high. Fundamentals remain strong.
>>> FEATURED STOCK ARTICLE : Hovering Near High with Volume Totals Cooling - 8/14/2023 |
View all notes |
Set NEW NOTE alert |
Company Profile |
SEC
News |
Chart |
Request a new note
C
A
S
I |
LSCC
-
NASDAQ
Lattice Semiconductor
Elec-Semicondctor Fablss
|
$86.32
|
-3.60
-4.00% |
$90.04
|
525,119
30.55% of 50 DAV
50 DAV is 1,719,000
|
$98.18
-12.08%
|
6/13/2023
|
$91.73
|
PP = $96.92
|
|
MB = $101.77
|
Most Recent Note - 8/25/2023 12:12:39 PM
G - Following a "negative reversal" on the prior session it is slumping further below its 50 DMA line ($90.51) with today's big volume-driven loss raising concerns. Reported Jun '23 quarterly earnings +24% on +18% sales revenues versus the year-ago period, just below the +25% minimum earnings guideline (C criteria).
>>> FEATURED STOCK ARTICLE : Rebound Needed Above 50-Day Moving Average for Lattice - 8/17/2023 |
View all notes |
Set NEW NOTE alert |
Company Profile |
SEC
News |
Chart |
Request a new note
C
A
S
I |
XPEL
-
NASDAQ
XPEL
Auto/Truck-Replace Parts
|
$82.57
|
-0.82
-0.98% |
$84.63
|
12,864
10.05% of 50 DAV
50 DAV is 128,000
|
$87.46
-5.59%
|
8/22/2023
|
$84.64
|
PP = $87.56
|
|
MB = $91.94
|
Most Recent Note - 8/22/2023 6:20:46 PM
Y - Color code is changed to yellow with new pivot point cited based on its 7/11/23 high plus 10 cents. Faces little resistance due to overhead supply up to the $87 level. Still consolidating with average or below-average volume totals, staying above its 50 DMA line ($81.61). Fundamentals remain strong.
>>> FEATURED STOCK ARTICLE : Consolidating After Rebounding Above 50-Day Moving Average - 8/2/2023 |
View all notes |
Set NEW NOTE alert |
Company Profile |
SEC
News |
Chart |
Request a new note
C
A
S
I |
Symbol/Exchange
Company Name
Industry Group |
PRICE |
CHANGE
(%Change) |
Day High |
Volume
(% DAV)
(% 50 day avg vol) |
52 Wk Hi
% From Hi |
Featured
Date |
Price
Featured |
Pivot Featured |
|
Max Buy |
ESQ
-
NASDAQ
Esquire Finl Hldgs
Finance-Commercial Loans
|
$46.86
|
-0.69
-1.45% |
$47.38
|
2,372
8.47% of 50 DAV
50 DAV is 28,000
|
$54.03
-13.27%
|
7/14/2023
|
$45.80
|
PP = $48.23
|
|
MB = $50.64
|
Most Recent Note - 8/25/2023 12:19:38 PM
G - Slumping below its 50 DMA line ($47.73) and below prior highs in the $47 area and its color code is changed to green. A rebound above the 50 DMA line is needed for its outlook to improve.
>>> FEATURED STOCK ARTICLE : Pullback with Light Volume Testing Important Support Level - 8/15/2023 |
View all notes |
Set NEW NOTE alert |
Company Profile |
SEC
News |
Chart |
Request a new note
C
A
S
I |
MEDP
-
NASDAQ
Medpace Holdings
Medical-Research Eqp/Svc
|
$258.05
|
+5.23
2.07% |
$258.66
|
44,883
12.43% of 50 DAV
50 DAV is 361,000
|
$269.44
-4.23%
|
7/25/2023
|
$196.32
|
PP = $241.57
|
|
MB = $253.65
|
Most Recent Note - 8/23/2023 5:35:14 PM
Y - Consolidating above its 50 DMA line ($244) and prior highs in the $241 area define important near-term support to watch. Fundamentals remain strong. See the latest FSU analysis for more details and a new annotated graph.
>>> FEATURED STOCK ARTICLE : Consolidating Above 50-Day Moving Average - 8/23/2023 |
View all notes |
Set NEW NOTE alert |
Company Profile |
SEC
News |
Chart |
Request a new note
C
A
S
I |
COKE
-
NASDAQ
Coca-Cola Consolidated
Beverages-Non-Alcoholic
|
$689.26
|
+0.45
0.06% |
$690.79
|
5,603
14.01% of 50 DAV
50 DAV is 40,000
|
$745.53
-7.55%
|
8/3/2023
|
$718.56
|
PP = $694.30
|
|
MB = $729.02
|
Most Recent Note - 8/22/2023 6:22:21 PM
G - Volume was below average today, consolidating near its all-time high but recently sputtering back below its pivot point raising concerns. Fundamentals remain strong.
>>> FEATURED STOCK ARTICLE : Powerful Breakout for COKE - 8/3/2023 |
View all notes |
Set NEW NOTE alert |
Company Profile |
SEC
News |
Chart |
Request a new note
C
A
S
I |
PLUS
-
NASDAQ
ePlus
Computer-Tech Services
|
$62.74
|
-0.35
-0.55% |
$63.49
|
26,578
23.73% of 50 DAV
50 DAV is 112,000
|
$75.90
-17.35%
|
8/8/2023
|
$67.60
|
PP = $62.92
|
|
MB = $66.07
|
Most Recent Note - 8/25/2023 12:22:56 PM
Y - Still consolidating since a noted "breakaway gap" on 8/08/23. Reported earnings +42% on +25% sales revenues for the Jun '23 quarter versus the year-ago period, its 3rd consecutive quarterly earnings increase above the +25% minimum guideline (C criteria) helping it better match the winning models of the fact-based investment system. Annual earnings growth (A criteria) has been strong.
>>> FEATURED STOCK ARTICLE : ePLUS Gapped Up but Ended in Lower Half of Intra-Day Range - 8/8/2023 |
View all notes |
Set NEW NOTE alert |
Company Profile |
SEC
News |
Chart |
Request a new note
C
A
S
I |
|
|
|
THESE ARE NOT BUY RECOMMENDATIONS!
Comments contained in the body of this report are technical
opinions only. The material herein has been obtained
from sources believed to be reliable and accurate, however,
its accuracy and completeness cannot be guaranteed.
This site is not an investment advisor, hence it does
not endorse or recommend any securities or other investments.
Any recommendation contained in this report may not
be suitable for all investors and it is not to be deemed
an offer or solicitation on our part with respect to
the purchase or sale of any securities. All trademarks,
service marks and trade names appearing in this report
are the property of their respective owners, and are
likewise used for identification purposes only.
This report is a service available
only to active Paid Premium Members.
You may opt-out of receiving report notifications
at any time. Questions or comments may be submitted
by writing to Premium Membership Services 665 S.E. 10 Street, Suite 201 Deerfield Beach, FL 33441-5634 or by calling 1-800-965-8307
or 954-785-1121.
|
|
|