You are not logged in.
This means you
CAN ONLY VIEW reports that were published prior to Wednesday, April 16, 2025.
You
MUST UPGRADE YOUR MEMBERSHIP if you want to see any current reports.
AFTER MARKET UPDATE - WEDNESDAY, SEPTEMBER 6TH, 2023
Previous After Market Report Next After Market Report >>>
|
|
|
|
DOW |
-198.78 |
34,443.19 |
-0.57% |
|
Volume |
788,724,865 |
+5% |
|
Volume |
4,297,229,400 |
+8% |
|
NASDAQ |
-148.48 |
13,872.47 |
-1.06% |
|
Advancers |
1,054 |
37% |
|
Advancers |
1,465 |
34% |
|
S&P 500 |
-31.35 |
4,465.48 |
-0.70% |
|
Decliners |
1,784 |
63% |
|
Decliners |
2,851 |
66% |
|
Russell 2000 |
-6.17 |
1,874.28 |
-0.33% |
|
52 Wk Highs |
37 |
|
|
52 Wk Highs |
49 |
|
|
S&P 600 |
-2.78 |
1,199.86 |
-0.23% |
|
52 Wk Lows |
84 |
|
|
52 Wk Lows |
185 |
|
|
 |
Major Indices Lost Ground While Leadership Remained Thin
Kenneth J. Gruneisen - Passed the CAN SLIM® Master's Exam
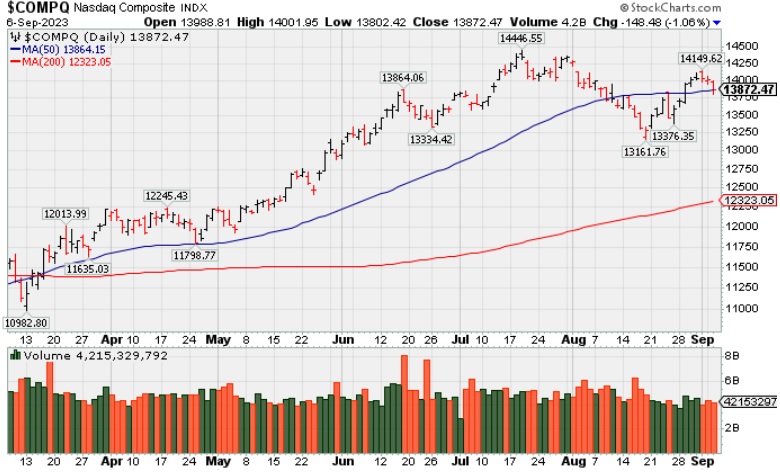
The major indices finished off their worst levels in the afternoon trade, but still registered decent losses. Volume totals reported were lighter than the prior session on the NYSE and on the Nasdaq exchange. Breadth was negative as decliners led advancers by a 9-5 margin on the NYSE and by almost a 2-1 margin on the Nasdaq exchange. There were 8 high-ranked companies from the Leaders List that hit a new 52-week high and were listed on the BreakOuts Page. New 52-week lows totals solidly outnumbered new 52-week highs totals on both the NYSE and on the Nasdaq exchange. The major indices are in a confirmed uptrend (M criteria).
PICTURED: The Nasdaq Composit Index fell near its 50-day moving average (DMA) line with a 3rd consecutive loss.
Nine of the 11 S&P 500 sectors closed with a loss. The information technology sector (-1.4%) saw the largest decline by a decent margin, weighed down by Apple (AAPL -3.69%). Apple fell after a few negative headlines and it weighed heavily on the broader market. China banned government officials from using Apple devices, according to The Wall Street Journal, and the EU Commission designated Apple as one of six "gatekeepers," which will place it under a regulatory microscope. The utilities (+0.2%) and energy (+0.1%) sectors closed at the top of the leaderboard.
The ISM Services PMI jumped to 54.5% from 52.7% and the Prices Index rose to 58.9% from 56.8%. That is a combination that will support the Fed's thinking that rates need to stay higher for longer. The 2-yr note yield, which is most sensitive to changes in the fed funds rate, sat at 4.95% before the data, but settled up eight basis points from yesterday at 5.04%. The 10-yr note yield, at 4.25% before the data, settled at 4.29%.
Another jump in oil prices ($87.57/bbl, +1.02, +1.2%) contributed to the negative bias. That move, along with elevated gas prices, has stirred concerns about a slowdown in discretionary spending. On a related note, several airlines sounded a cautious note today about rising jet fuel costs.
|
 Kenneth J. Gruneisen started out as a licensed stockbroker in August 1987, a couple of months prior to the historic stock market crash that took the Dow Jones Industrial Average down -22.6% in a single day. He has published daily fact-based fundamental and technical analysis on high-ranked stocks online for two decades. Through FACTBASEDINVESTING.COM, Kenneth provides educational articles, news, market commentary, and other information regarding proven investment systems that work in good times and bad.
Comments contained in the body of this report are technical opinions only and are not necessarily those of Gruneisen Growth Corp. The material herein has been obtained from sources believed to be reliable and accurate, however, its accuracy and completeness cannot be guaranteed. Our firm, employees, and customers may effect transactions, including transactions contrary to any recommendation herein, or have positions in the securities mentioned herein or options with respect thereto. Any recommendation contained in this report may not be suitable for all investors and it is not to be deemed an offer or solicitation on our part with respect to the purchase or sale of any securities. |
|
 |
Energy Indexes Rose Amid Broader Group Losses
Kenneth J. Gruneisen - Passed the CAN SLIM® Master's Exam
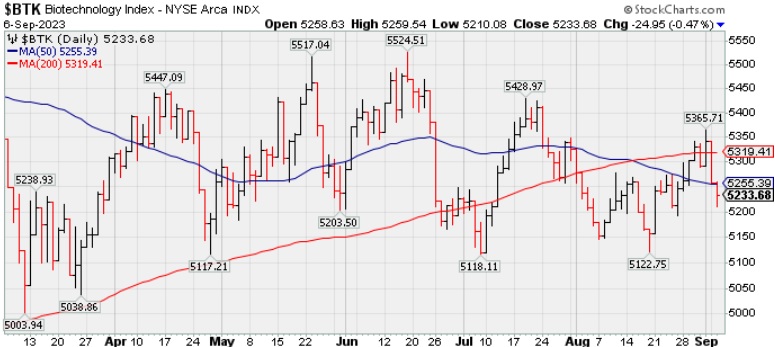
The Bank Index ($BKX -1.35%) and the Broker/Dealer Index ($XBD -0.78%) both lost ground along with the Retail Index ($RLX -1.04%). The Semiconductor Index ($SOX -0.80%) led the tech sector lower as the Networking Index ($NWX -0.33%) and the Biotech Index ($BTK -0.47%) suffered smaller losses. The Gold & Silver Index ($XAU -0.31%) edged lower. The Oil Services Index ($OSX +0.64%) and the Integrated Oil Index ($XOI +0.36%) both posted modest gains.
PICTURED: The Biotech Index ($BTK -0.47%) fell below its 50-day moving average (DMA) line toward prior lows.
| Oil Services |
$OSX |
96.36 |
+0.62 |
+0.64% |
+14.90% |
| Integrated Oil |
$XOI |
1,931.81 |
+6.90 |
+0.36% |
+8.09% |
| Semiconductor |
$SOX |
3,654.46 |
-29.34 |
-0.80% |
+44.32% |
| Networking |
$NWX |
801.34 |
-2.67 |
-0.33% |
+2.30% |
| Broker/Dealer |
$XBD |
499.11 |
-3.94 |
-0.78% |
+11.13% |
| Retail |
$RLX |
3,578.31 |
-37.51 |
-1.04% |
+29.93% |
| Gold & Silver |
$XAU |
114.05 |
-0.35 |
-0.31% |
-5.63% |
| Bank |
$BKX |
80.49 |
-1.10 |
-1.35% |
-20.19% |
| Biotech |
$BTK |
5,233.68 |
-24.95 |
-0.47% |
-0.90% |
|
|
|
 |
Featured Stocks
Kenneth J. Gruneisen - Passed the CAN SLIM® Master's Exam
|
|
|
Color Codes Explained :
Y - Better candidates highlighted by our
staff of experts.
G - Previously featured
in past reports as yellow but may no longer be buyable under the
guidelines.
***Last / Change / Volume data in this table is the closing quote data***
Symbol/Exchange
Company Name
Industry Group |
PRICE |
CHANGE
(%Change) |
Day High |
Volume
(% DAV)
(% 50 day avg vol) |
52 Wk Hi
% From Hi |
Featured
Date |
Price
Featured |
Pivot Featured |
|
Max Buy |
 STRL
-
NASDAQ
STRL
-
NASDAQ
Sterling Infrastructure
Bldg-Heavy Construction
|
$80.11
|
-0.43
-0.53% |
$82.35
|
281,779
68.39% of 50 DAV
50 DAV is 412,000
|
$84.00
-4.63%
|
12/14/2022
|
$32.41
|
PP = $33.72
|
|
MB = $35.41
|
Most Recent Note - 8/22/2023 6:18:13 PM
G - Hovering near its all-time high, very extended from any sound base, well above its 50 DMA line ($61) which defines support. Jun '23 quarterly earnings rose +37% on +13% sales revenues versus the year-ago period.
>>> FEATURED STOCK ARTICLE : Volume-Driven Gains Leave Construction Firm at All-Time High - 8/9/2023 |
View all notes |
Set NEW NOTE alert |
Company Profile |
SEC
News |
Chart |
Request a new note
C
A
S
I |
FIX
-
NYSE
Comfort Systems USA
Bldg-A/C and Heating Prds
|
$187.89
|
+2.49
1.34% |
$188.11
|
225,957
109.69% of 50 DAV
50 DAV is 206,000
|
$188.03
-0.07%
|
4/27/2023
|
$148.85
|
PP = $152.23
|
|
MB = $159.84
|
 Most Recent Note - 9/6/2023 8:00:35 PM
G - Posted a gain with average volume today for a new all-time high close. Its 50 DMA line ($172.91) defines important near-term support to watch on pullbacks. Fundamentals remain strong.
>>> FEATURED STOCK ARTICLE : FIX Still Stubbornly Hovering Near High - 8/21/2023 |
View all notes |
Set NEW NOTE alert |
Company Profile |
SEC
News |
Chart |
Request a new note
C
A
S
I |
KOF
-
NYSE
Coca Cola Femsa Sab Ads
FOOD and BEVERAGE - Beverages - Soft Drinks
|
$83.55
|
+0.11
0.13% |
$84.40
|
136,311
93.30% of 50 DAV
50 DAV is 146,100
|
$91.23
-8.42%
|
6/9/2023
|
$88.61
|
PP = $91.33
|
|
MB = $95.90
|
Most Recent Note - 9/6/2023 8:02:12 PM
G - Consolidating near its 50 DMA line ($83.80). Faces some near-term resistance due to overhead supply up to the $91 area. Its Relative Strength Rating is currently 82. Reported Jun '23 quarterly earnings +23% on +26% sales revenues versus the year-ago period, below the +25% minimum guideline (C criteria).
>>> FEATURED STOCK ARTICLE : 50-Day Moving Average Line has Acted as Resistance - 8/10/2023 |
View all notes |
Set NEW NOTE alert |
Company Profile |
SEC
News |
Chart |
Request a new note
C
A
S
I |
CLH
-
NYSE
Clean Harbors
Pollution Control
|
$167.63
|
+1.70
1.02% |
$169.69
|
267,212
82.22% of 50 DAV
50 DAV is 325,000
|
$178.33
-6.00%
|
3/10/2023
|
$136.89
|
PP = $136.74
|
|
MB = $143.58
|
Most Recent Note - 9/6/2023 7:57:09 PM
G - Hovering near its 50 DMA line ($168) which defines important near-term support to watch. Reported earnings for the Jun '23 quarter -13% on +3% sales revenues versus the year-ago period, below the +25% minimum earnings guideline (C criteria), raising fundamental concerns.
>>> FEATURED STOCK ARTICLE : Volume Totals Have Been Cooling While Hovering Near High - 8/18/2023 |
View all notes |
Set NEW NOTE alert |
Company Profile |
SEC
News |
Chart |
Request a new note
C
A
S
I |
HUBB
-
NYSE
Hubbell
Electrical-Power/Equipmt
|
$316.92
|
+3.18
1.01% |
$318.32
|
489,426
114.35% of 50 DAV
50 DAV is 428,000
|
$340.06
-6.80%
|
4/25/2023
|
$262.85
|
PP = $257.51
|
|
MB = $270.39
|
Most Recent Note - 9/6/2023 8:01:21 PM
G - Perched only -6.8% off its all-time high but slumped below its 50 DMA line ($319.84) with a volume-driven loss on the prior session. A rebound above the 50 DMA line is needed for its outlook to improve. Fundamentals remain strong after Jun '23 earnings rose +45% on +9% sales revenues versus the year-ago period.
>>> FEATURED STOCK ARTICLE : Rebounded Near 50-Day Moving Average Line - 8/24/2023 |
View all notes |
Set NEW NOTE alert |
Company Profile |
SEC
News |
Chart |
Request a new note
C
A
S
I |
Symbol/Exchange
Company Name
Industry Group |
PRICE |
CHANGE
(%Change) |
Day High |
Volume
(% DAV)
(% 50 day avg vol) |
52 Wk Hi
% From Hi |
Featured
Date |
Price
Featured |
Pivot Featured |
|
Max Buy |
AMPH
-
NASDAQ
Amphastar Pharm
Medical-Biomed/Biotech
|
$52.03
|
+0.52
1.01% |
$52.33
|
278,211
73.21% of 50 DAV
50 DAV is 380,000
|
$67.66
-23.10%
|
5/15/2023
|
$43.56
|
PP = $44.15
|
|
MB = $46.36
|
Most Recent Note - 9/6/2023 7:54:39 PM
G - Sputtering below its 50 DMA line ($57.25) and a rebound above the 50 DMA line is still needed for its outlook to improve. Fundamentals remain strong after it reported Jun '23 quarterly earnings +67% on +18% sales revenues versus the year-ago period.
>>> FEATURED STOCK ARTICLE : Rebound Above 50-Day Moving Average Needed for Outlook to Improve - 8/22/2023 |
View all notes |
Set NEW NOTE alert |
Company Profile |
SEC
News |
Chart |
Request a new note
C
A
S
I |
ANET
-
NYSE
Arista Networks
Computer-Networking
|
$197.54
|
+0.08
0.04% |
$198.28
|
1,210,481
43.11% of 50 DAV
50 DAV is 2,808,000
|
$198.70
-0.58%
|
8/1/2023
|
$188.84
|
PP = $178.46
|
|
MB = $187.38
|
Most Recent Note - 9/6/2023 7:56:26 PM
G - Color code is changed to green while perched at its all-time high after an 8th consecutive small gain with light volume. Fundamentals remain strong.
>>> FEATURED STOCK ARTICLE : Hovering Near High with Volume Totals Cooling - 8/14/2023 |
View all notes |
Set NEW NOTE alert |
Company Profile |
SEC
News |
Chart |
Request a new note
C
A
S
I |
LSCC
-
NASDAQ
Lattice Semiconductor
Elec-Semicondctor Fablss
|
$95.87
|
+0.23
0.24% |
$97.43
|
1,108,839
67.57% of 50 DAV
50 DAV is 1,641,000
|
$98.30
-2.47%
|
6/13/2023
|
$91.73
|
PP = $96.92
|
|
MB = $101.77
|
Most Recent Note - 9/6/2023 8:03:23 PM
G - Perched near its 52-week high after gains lacking great volume conviction. Reported Jun '23 quarterly earnings +24% on +18% sales revenues versus the year-ago period, just below the +25% minimum earnings guideline (C criteria).
>>> FEATURED STOCK ARTICLE : Rebound Needed Above 50-Day Moving Average for Lattice - 8/17/2023 |
View all notes |
Set NEW NOTE alert |
Company Profile |
SEC
News |
Chart |
Request a new note
C
A
S
I |
XPEL
-
NASDAQ
Xpel Inc
Auto/Truck-Tires andamp; Misc
|
$74.77
|
-1.78
-2.33% |
$77.74
|
151,255
123.98% of 50 DAV
50 DAV is 122,000
|
$87.46
-14.51%
|
8/22/2023
|
$84.64
|
PP = $87.56
|
|
MB = $91.94
|
Most Recent Note - 8/22/2023 6:20:46 PM
Y - Color code is changed to yellow with new pivot point cited based on its 7/11/23 high plus 10 cents. Faces little resistance due to overhead supply up to the $87 level. Still consolidating with average or below-average volume totals, staying above its 50 DMA line ($81.61). Fundamentals remain strong.
>>> FEATURED STOCK ARTICLE : Consolidating After Rebounding Above 50-Day Moving Average - 8/2/2023 |
View all notes |
Set NEW NOTE alert |
Company Profile |
SEC
News |
Chart |
Request a new note
C
A
S
I |
ESQ
-
NASDAQ
Esquire Finl Hldgs
Finance-Commercial Loans
|
$46.50
|
-0.89
-1.88% |
$48.38
|
18,213
72.85% of 50 DAV
50 DAV is 25,000
|
$54.03
-13.94%
|
7/14/2023
|
$45.80
|
PP = $48.23
|
|
MB = $50.64
|
Most Recent Note - 9/6/2023 7:59:22 PM
G - Its 50 DMA line ($47.86) has acted as resistance. Consolidating near prior highs in the $47 area. A rebound above the 50 DMA line is needed for its outlook to improve.
>>> FEATURED STOCK ARTICLE : Pullback with Light Volume Testing Important Support Level - 8/15/2023 |
View all notes |
Set NEW NOTE alert |
Company Profile |
SEC
News |
Chart |
Request a new note
C
A
S
I |
Symbol/Exchange
Company Name
Industry Group |
PRICE |
CHANGE
(%Change) |
Day High |
Volume
(% DAV)
(% 50 day avg vol) |
52 Wk Hi
% From Hi |
Featured
Date |
Price
Featured |
Pivot Featured |
|
Max Buy |
MEDP
-
NASDAQ
Medpace Holdings
Medical-Research Eqp/Svc
|
$267.84
|
+2.74
1.03% |
$267.92
|
159,027
47.47% of 50 DAV
50 DAV is 335,000
|
$274.62
-2.47%
|
7/25/2023
|
$196.32
|
PP = $241.57
|
|
MB = $253.65
|
Most Recent Note - 8/23/2023 5:35:14 PM
Y - Consolidating above its 50 DMA line ($244) and prior highs in the $241 area define important near-term support to watch. Fundamentals remain strong. See the latest FSU analysis for more details and a new annotated graph.
>>> FEATURED STOCK ARTICLE : Consolidating Above 50-Day Moving Average - 8/23/2023 |
View all notes |
Set NEW NOTE alert |
Company Profile |
SEC
News |
Chart |
Request a new note
C
A
S
I |
COKE
-
NASDAQ
Coca-Cola Consolidated
Beverages-Non-Alcoholic
|
$663.58
|
-12.59
-1.86% |
$682.01
|
39,586
98.97% of 50 DAV
50 DAV is 40,000
|
$745.53
-10.99%
|
8/3/2023
|
$718.56
|
PP = $694.30
|
|
MB = $729.02
|
Most Recent Note - 9/6/2023 7:58:10 PM
G - Volume was average today, consolidating near its 50 DMA line ($666). Slump below its pivot point has raised concerns. Fundamentals remain strong.
>>> FEATURED STOCK ARTICLE : Powerful Breakout for COKE - 8/3/2023 |
View all notes |
Set NEW NOTE alert |
Company Profile |
SEC
News |
Chart |
Request a new note
C
A
S
I |
PLUS
-
NASDAQ
ePlus
Computer-Tech Services
|
$65.83
|
+0.04
0.06% |
$66.41
|
75,630
66.93% of 50 DAV
50 DAV is 113,000
|
$75.90
-13.27%
|
8/8/2023
|
$67.60
|
PP = $62.92
|
|
MB = $66.07
|
Most Recent Note - 8/25/2023 12:22:56 PM
Y - Still consolidating since a noted "breakaway gap" on 8/08/23. Reported earnings +42% on +25% sales revenues for the Jun '23 quarter versus the year-ago period, its 3rd consecutive quarterly earnings increase above the +25% minimum guideline (C criteria) helping it better match the winning models of the fact-based investment system. Annual earnings growth (A criteria) has been strong.
>>> FEATURED STOCK ARTICLE : ePLUS Gapped Up but Ended in Lower Half of Intra-Day Range - 8/8/2023 |
View all notes |
Set NEW NOTE alert |
Company Profile |
SEC
News |
Chart |
Request a new note
C
A
S
I |
|
|
|
THESE ARE NOT BUY RECOMMENDATIONS!
Comments contained in the body of this report are technical
opinions only. The material herein has been obtained
from sources believed to be reliable and accurate, however,
its accuracy and completeness cannot be guaranteed.
This site is not an investment advisor, hence it does
not endorse or recommend any securities or other investments.
Any recommendation contained in this report may not
be suitable for all investors and it is not to be deemed
an offer or solicitation on our part with respect to
the purchase or sale of any securities. All trademarks,
service marks and trade names appearing in this report
are the property of their respective owners, and are
likewise used for identification purposes only.
This report is a service available
only to active Paid Premium Members.
You may opt-out of receiving report notifications
at any time. Questions or comments may be submitted
by writing to Premium Membership Services 665 S.E. 10 Street, Suite 201 Deerfield Beach, FL 33441-5634 or by calling 1-800-965-8307
or 954-785-1121.
|
|
|