You are not logged in.
This means you
CAN ONLY VIEW reports that were published prior to Thursday, March 20, 2025.
You
MUST UPGRADE YOUR MEMBERSHIP if you want to see any current reports.
AFTER MARKET UPDATE - WEDNESDAY, AUGUST 23RD, 2023
Previous After Market Report Next After Market Report >>>
|
|
|
|
DOW |
+184.15 |
34,472.98 |
+0.54% |
|
Volume |
862,565,870 |
+14% |
|
Volume |
4,216,393,300 |
-3% |
|
NASDAQ |
+215.16 |
13,721.03 |
+1.59% |
|
Advancers |
2,249 |
78% |
|
Advancers |
2,877 |
67% |
|
S&P 500 |
+48.46 |
4,436.01 |
+1.10% |
|
Decliners |
645 |
22% |
|
Decliners |
1,439 |
33% |
|
Russell 2000 |
+19.20 |
1,870.03 |
+1.04% |
|
52 Wk Highs |
43 |
|
|
52 Wk Highs |
59 |
|
|
S&P 600 |
+12.81 |
1,206.25 |
+1.07% |
|
52 Wk Lows |
59 |
|
|
52 Wk Lows |
168 |
|
|
Last week's distributional action, clearly negative breadth, and waning leadership signaled a more worrisome market correction (M criteria). Greater caution is called for and disciplined investors should be ready to reduce exposure and raise cash by selling any weakening stocks on a case-by-case basis.
|
 |
Leadership Improved as Major Indices Rebounded
Kenneth J. Gruneisen - Passed the CAN SLIM® Master's Exam
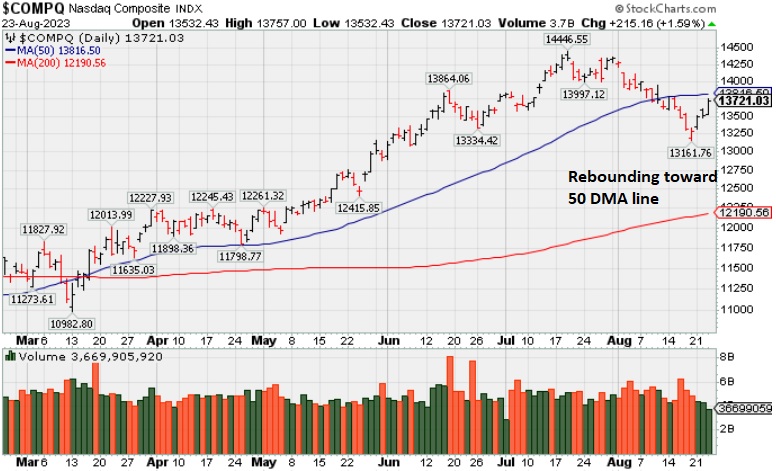
The major indices all closed with gains ranging from 0.5% to 1.6%. Volume totals reported were mixed, higher than the prior session on the NYSE and lighter on the Nasdaq exchange. Breadth was positive as advancers led decliners by more than a 3-1 margin on the NYSE and by almost a 2-1 margin on the Nasdaq exchange. There were 22 high-ranked companies from the Leaders List that hit a new 52-week high and were listed on the BreakOuts Page, versus the total of 15 on the prior session. New 52-week lows totals still outnumbered new 52-week highs totals on both the NYSE and on the Nasdaq exchange. The major indices are in a correction (M criteria). Leadership improved as there was an uptick in new highs totals on both major exchanges. New buying efforts should be avoided until a new confirmed rally marked by a solid follow-through day.
PICTURED: The Nasdaq Composite Index posted a 3rd consecutive gain, rebounding toward its 50-day moving average (DMA) line.
Market rates started to move lower overnight in response to a batch of soft August PMI data out of Europe. The 2-yr note yield fell 11 basis points to 4.93% and the 10-yr note yield fell 13 basis points to 4.20%.
Ten of the 11 S&P 500 sectors logged gains. Information technology (+1.9%) and Communication services (+1.9%) were top performers, drawing added support from a big gain in Netflix (NFLX +3.48%) after supportive analyst comments. NVIDIA (NVDA +3.17%) rose ahead of its earnings report due after Wednesday's close. Apple (AAPL +2.19%) and Microsoft (MSFT +1.41%) also rose. The energy sector (-0.3%) was the lone holdout in negative territory by the close.
Retailers headlined the earnings calendar. Foot Locker (FL -28.28%) and Peloton (PTON -22.60%) both sank considerably following their earnings results and/or guidance. Abercrombie & Fitch (ANF +23.54%) posted a big gain after beating earnings estimates and raising guidance.
|
 Kenneth J. Gruneisen started out as a licensed stockbroker in August 1987, a couple of months prior to the historic stock market crash that took the Dow Jones Industrial Average down -22.6% in a single day. He has published daily fact-based fundamental and technical analysis on high-ranked stocks online for two decades. Through FACTBASEDINVESTING.COM, Kenneth provides educational articles, news, market commentary, and other information regarding proven investment systems that work in good times and bad.
Comments contained in the body of this report are technical opinions only and are not necessarily those of Gruneisen Growth Corp. The material herein has been obtained from sources believed to be reliable and accurate, however, its accuracy and completeness cannot be guaranteed. Our firm, employees, and customers may effect transactions, including transactions contrary to any recommendation herein, or have positions in the securities mentioned herein or options with respect thereto. Any recommendation contained in this report may not be suitable for all investors and it is not to be deemed an offer or solicitation on our part with respect to the purchase or sale of any securities. |
|
 |
Financial, Retail, Semiconductor, and Gold & Silver Indexes Rose
Kenneth J. Gruneisen - Passed the CAN SLIM® Master's Exam
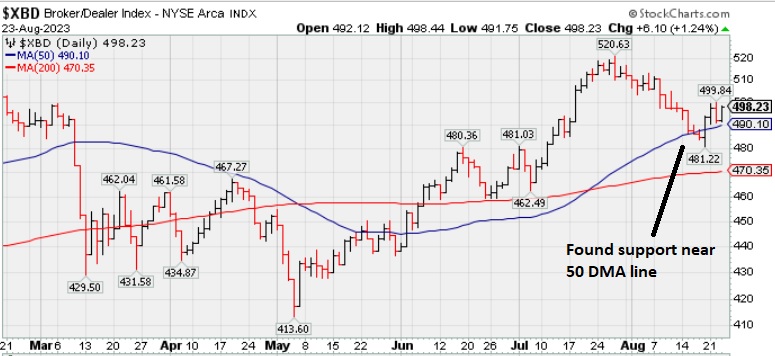
Financials posted influential gains that helped give the major averages a boost as the Bank Index ($BKX +1.14%) and the Broker/Dealer Index ($XBD +1.24%) rose. The Semiconductor Index ($SOX +2.11%) outpaced the Biotech Index ($BTK +0.28%) and the Networking Index ($NWX +0.57%). The Retail Index ($RLX +0.92%) also notched a solid gain. The Gold & Silver Index ($XAU +3.13%) posted a standout gain. The Oil Services Index ($OSX +0.75%) rose while the Integrated Oil Index ($XOI -0.40%) lost ground.
PICTURED: The Broker/Dealer Index ($XBD +1.24%) found support near its 50-day moving average (DMA) line.
| Oil Services |
$OSX |
90.92 |
+0.68 |
+0.75% |
+8.42% |
| Integrated Oil |
$XOI |
1,843.47 |
-7.39 |
-0.40% |
+3.15% |
| Semiconductor |
$SOX |
3,602.01 |
+74.32 |
+2.11% |
+42.25% |
| Networking |
$NWX |
789.70 |
+4.45 |
+0.57% |
+0.82% |
| Broker/Dealer |
$XBD |
498.23 |
+6.10 |
+1.24% |
+10.93% |
| Retail |
$RLX |
3,578.38 |
+32.62 |
+0.92% |
+29.93% |
| Gold & Silver |
$XAU |
116.34 |
+3.53 |
+3.13% |
-3.74% |
| Bank |
$BKX |
80.33 |
+0.90 |
+1.14% |
-20.35% |
| Biotech |
$BTK |
5,253.94 |
+14.47 |
+0.28% |
-0.51% |
|
|
|
 |
Consolidating Above 50-Day Moving Average
Kenneth J. Gruneisen - Passed the CAN SLIM® Master's Exam
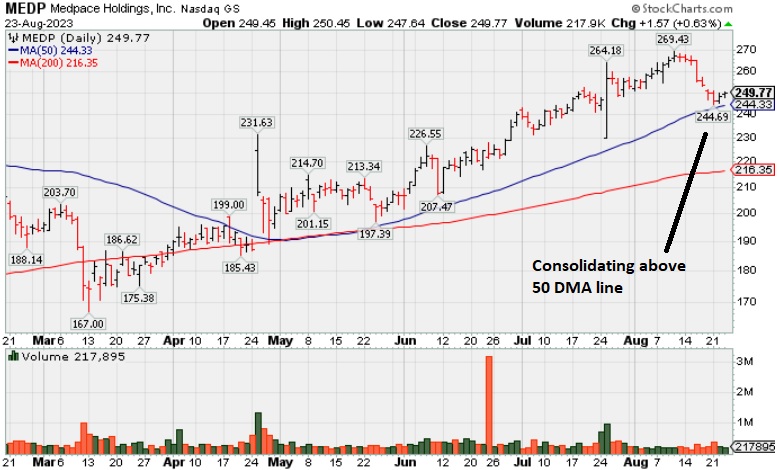
Medpace Holdings Inc (MEDP +$1.29 or +0.52% to $249.49) is consolidating above Its 50-day moving average (DMA) line ($244) and prior highs in the $241 area which define important near-term support to watch. Fundamentals remain strong.
MEDP was highlighted in yellow with pivot point cited based on its 1/23/23 high plus 10 cents in the earlier mid-day report (read here). It hit a new all-time high with a volume-driven gain backed by +170% above average volume clinching a technical buy signal. MEDP was last shown in this FSU section on 7/25/23 with an annotated graph under the headline, "Medpace Posted a Solid Volume-Driven Gain for a New High".
It has a 99 Earnings Per Share Rating. MEDP reported earnings increases above the +25% minimum earnings guideline (C criteria) in the past 5 quarterly comparisons through Jun '23. It is also a great match with the winning models of the fact-based investment system as its annual earnings history has been strong and steady.
There is a small supply of only 30.5 million shares outstanding (S criteria) which can contribute to greater price volatility in the event of institutional buying or selling. The number of top-rated funds owning its shares rose from 188 in Dec '17 to 743 in Jun '23, a reassuring sign concerning the I criteria. Its current Up/Down Volume Ratio of 1.0 is an unbiased indication its shares have been neutral concerning accumulation/distribution over the past 50 days. It has earned a Timeliness Rating of B and Sponsorship rating of B.
Charts courtesy of www.stockcharts.com |
|
|
Color Codes Explained :
Y - Better candidates highlighted by our
staff of experts.
G - Previously featured
in past reports as yellow but may no longer be buyable under the
guidelines.
***Last / Change / Volume data in this table is the closing quote data***
Symbol/Exchange
Company Name
Industry Group |
PRICE |
CHANGE
(%Change) |
Day High |
Volume
(% DAV)
(% 50 day avg vol) |
52 Wk Hi
% From Hi |
Featured
Date |
Price
Featured |
Pivot Featured |
|
Max Buy |
 STRL
-
NASDAQ
STRL
-
NASDAQ
Sterling Infrastructure
Bldg-Heavy Construction
|
$79.81
|
+2.16
2.78% |
$80.27
|
322,343
77.49% of 50 DAV
50 DAV is 416,000
|
$83.81
-4.77%
|
12/14/2022
|
$32.41
|
PP = $33.72
|
|
MB = $35.41
|
Most Recent Note - 8/22/2023 6:18:13 PM
G - Hovering near its all-time high, very extended from any sound base, well above its 50 DMA line ($61) which defines support. Jun '23 quarterly earnings rose +37% on +13% sales revenues versus the year-ago period.
>>> FEATURED STOCK ARTICLE : Volume-Driven Gains Leave Construction Firm at All-Time High - 8/9/2023 |
View all notes |
Set NEW NOTE alert |
Company Profile |
SEC
News |
Chart |
Request a new note
C
A
S
I |
FIX
-
NYSE
Comfort Systems USA
Bldg-A/C and Heating Prds
|
$181.70
|
+3.10
1.74% |
$182.86
|
174,180
81.39% of 50 DAV
50 DAV is 214,000
|
$182.94
-0.68%
|
4/27/2023
|
$148.85
|
PP = $152.23
|
|
MB = $159.84
|
Most Recent Note - 8/21/2023 5:08:25 PM
G - Still stubbornly holding its ground near its all-time high. Its 50 DMA line ($168) defines important near-term support to watch on pullbacks. Fundamentals remain strong. See the latest FSU analysis for more details and a new annotated graph.
>>> FEATURED STOCK ARTICLE : FIX Still Stubbornly Hovering Near High - 8/21/2023 |
View all notes |
Set NEW NOTE alert |
Company Profile |
SEC
News |
Chart |
Request a new note
C
A
S
I |
KOF
-
NYSE
Coca-Cola Femsa ADR
Beverages-Non-Alcoholic
|
$86.80
|
+0.80
0.93% |
$87.58
|
110,008
75.35% of 50 DAV
50 DAV is 146,000
|
$91.23
-4.86%
|
6/9/2023
|
$88.61
|
PP = $91.33
|
|
MB = $95.90
|
Most Recent Note - 8/22/2023 6:23:12 PM
G - Recently rebounding above the 50 DMA line ($84.18) helping its outlook to improve. Faces some near-term resistance due to overhead supply up to the $91 area. Its Relative Strength Rating is currently 88. Reported Jun '23 quarterly earnings +23% on +26% sales revenues versus the year-ago period, below the +25% minimum guideline (C criteria).
>>> FEATURED STOCK ARTICLE : 50-Day Moving Average Line has Acted as Resistance - 8/10/2023 |
View all notes |
Set NEW NOTE alert |
Company Profile |
SEC
News |
Chart |
Request a new note
C
A
S
I |
CLH
-
NYSE
Clean Harbors
Pollution Control
|
$171.73
|
+1.30
0.76% |
$172.04
|
204,995
55.40% of 50 DAV
50 DAV is 370,000
|
$178.33
-3.70%
|
3/10/2023
|
$136.89
|
PP = $136.74
|
|
MB = $143.58
|
Most Recent Note - 8/21/2023 5:11:23 PM
G - Still hovering near its all-time high with volume totals cooling. Its 50 DMA line ($165) defines important near-term support to watch on pullbacks. Reported earnings for the Jun '23 quarter -13% on +3% sales revenues versus the year-ago period, below the +25% minimum earnings guideline (C criteria), raising fundamental concerns.
>>> FEATURED STOCK ARTICLE : Volume Totals Have Been Cooling While Hovering Near High - 8/18/2023 |
View all notes |
Set NEW NOTE alert |
Company Profile |
SEC
News |
Chart |
Request a new note
C
A
S
I |
HUBB
-
NYSE
Hubbell
Electrical-Power/Equipmt
|
$317.59
|
+10.41
3.39% |
$319.07
|
384,060
90.37% of 50 DAV
50 DAV is 425,000
|
$340.06
-6.61%
|
4/25/2023
|
$262.85
|
PP = $257.51
|
|
MB = $270.39
|
 Most Recent Note - 8/23/2023 3:37:55 PM
G - Rebounding near its 50 DMA line ($319.24) and perched only -6.4% off its all-time high. A rebound above the 50 DMA line is needed for its outlook to improve. Fundamentals remain strong after Jun '23 earnings rose +45% on +9% sales revenues versus the year-ago period.
>>> FEATURED STOCK ARTICLE : Pulled Back Undercutting 50 Day Moving Average Line - 7/26/2023 |
View all notes |
Set NEW NOTE alert |
Company Profile |
SEC
News |
Chart |
Request a new note
C
A
S
I |
Symbol/Exchange
Company Name
Industry Group |
PRICE |
CHANGE
(%Change) |
Day High |
Volume
(% DAV)
(% 50 day avg vol) |
52 Wk Hi
% From Hi |
Featured
Date |
Price
Featured |
Pivot Featured |
|
Max Buy |
PHM
-
NYSE
PulteGroup
Bldg-Resident/Comml
|
$79.66
|
+0.83
1.05% |
$81.07
|
2,474,533
95.87% of 50 DAV
50 DAV is 2,581,000
|
$86.16
-7.54%
|
4/25/2023
|
$65.17
|
PP = $64.01
|
|
MB = $67.21
|
Most Recent Note - 8/22/2023 6:24:59 PM
G - Sputtering below its 50 DMA line ($79.67) since a noted loss on 8/17/23 triggering a technical sell signal. A rebound above the 50 DMA line is needed for its outlook to improve. Recently reported earnings +18% for the Jun '23 quarter versus the year-ago period, below the +25% minimum guideline (C criteria) raising concerns.
>>> FEATURED STOCK ARTICLE : Reversed After Reaching a New All-Time High - 7/27/2023 |
View all notes |
Set NEW NOTE alert |
Company Profile |
SEC
News |
Chart |
Request a new note
C
A
S
I |
AMPH
-
NASDAQ
Amphastar Pharm
Medical-Biomed/Biotech
|
$54.51
|
+1.02
1.91% |
$54.93
|
261,019
57.49% of 50 DAV
50 DAV is 454,000
|
$67.66
-19.44%
|
5/15/2023
|
$43.56
|
PP = $44.15
|
|
MB = $46.36
|
Most Recent Note - 8/22/2023 6:16:23 PM
G - Stilll sputtering below its 50 DMA line ($57.23) after damaging volume-driven losses. A rebound above the 50 DMA line is needed for its outlook to improve. Fundamentals remain strong after it reported Jun '23 quarterly earnings +67% on +18% sales revenues versus the year-ago period. See the latest FSU analysis for more details and a new annotated graph.
>>> FEATURED STOCK ARTICLE : Rebound Above 50-Day Moving Average Needed for Outlook to Improve - 8/22/2023 |
View all notes |
Set NEW NOTE alert |
Company Profile |
SEC
News |
Chart |
Request a new note
C
A
S
I |
ANET
-
NYSE
Arista Networks
Computer-Networking
|
$189.83
|
+2.31
1.23% |
$190.95
|
2,472,544
77.07% of 50 DAV
50 DAV is 3,208,000
|
$190.65
-0.43%
|
8/1/2023
|
$188.84
|
PP = $178.46
|
|
MB = $187.38
|
Most Recent Note - 8/21/2023 5:16:02 PM
Y - Posted a gain with light volume today for its second-best-ever close. Stubbornly held its ground above the prior high and pivot point. Bullish action came after it reported Jun '23 quarterly earnings +40% on +39% sales revenues versus the year-ago period.
>>> FEATURED STOCK ARTICLE : Hovering Near High with Volume Totals Cooling - 8/14/2023 |
View all notes |
Set NEW NOTE alert |
Company Profile |
SEC
News |
Chart |
Request a new note
C
A
S
I |
LSCC
-
NASDAQ
Lattice Semiconductor
Elec-Semicondctor Fablss
|
$95.33
|
+4.25
4.67% |
$96.10
|
1,871,765
107.14% of 50 DAV
50 DAV is 1,747,000
|
$98.18
-2.90%
|
6/13/2023
|
$91.73
|
PP = $96.92
|
|
MB = $101.77
|
Most Recent Note - 8/23/2023 3:35:27 PM
G - Rebounding further above its 50 DMA line ($90.64) toward prior highs with today's gain. Little resistance remains due to overhead supply. Reported Jun '23 quarterly earnings +24% on +18% sales revenues versus the year-ago period, just below the +25% minimum earnings guideline (C criteria).
>>> FEATURED STOCK ARTICLE : Rebound Needed Above 50-Day Moving Average for Lattice - 8/17/2023 |
View all notes |
Set NEW NOTE alert |
Company Profile |
SEC
News |
Chart |
Request a new note
C
A
S
I |
XPEL
-
NASDAQ
XPEL
Auto/Truck-Replace Parts
|
$85.77
|
+1.13
1.34% |
$86.67
|
129,309
100.24% of 50 DAV
50 DAV is 129,000
|
$87.46
-1.93%
|
8/22/2023
|
$84.64
|
PP = $87.56
|
|
MB = $91.94
|
Most Recent Note - 8/22/2023 6:20:46 PM
Y - Color code is changed to yellow with new pivot point cited based on its 7/11/23 high plus 10 cents. Faces little resistance due to overhead supply up to the $87 level. Still consolidating with average or below-average volume totals, staying above its 50 DMA line ($81.61). Fundamentals remain strong.
>>> FEATURED STOCK ARTICLE : Consolidating After Rebounding Above 50-Day Moving Average - 8/2/2023 |
View all notes |
Set NEW NOTE alert |
Company Profile |
SEC
News |
Chart |
Request a new note
C
A
S
I |
Symbol/Exchange
Company Name
Industry Group |
PRICE |
CHANGE
(%Change) |
Day High |
Volume
(% DAV)
(% 50 day avg vol) |
52 Wk Hi
% From Hi |
Featured
Date |
Price
Featured |
Pivot Featured |
|
Max Buy |
ESQ
-
NASDAQ
Esquire Financial Holdings
Finance-Commercial Loans
|
$47.71
|
+0.54
1.14% |
$47.90
|
12,581
44.30% of 50 DAV
50 DAV is 28,400
|
$54.03
-11.70%
|
7/14/2023
|
$45.80
|
PP = $48.23
|
|
MB = $50.64
|
Most Recent Note - 8/21/2023 5:13:10 PM
Y - Volume has been below average behind 6 losses in the span of 7 sessions and it is testing prior highs in the $47 area defining important near-term support coinciding with its 50 DMA line.
>>> FEATURED STOCK ARTICLE : Pullback with Light Volume Testing Important Support Level - 8/15/2023 |
View all notes |
Set NEW NOTE alert |
Company Profile |
SEC
News |
Chart |
Request a new note
C
A
S
I |
MEDP
-
NASDAQ
Medpace Holdings
Medical-Research Eqp/Svc
|
$249.77
|
+1.57
0.63% |
$250.45
|
218,854
59.47% of 50 DAV
50 DAV is 368,000
|
$269.44
-7.30%
|
7/25/2023
|
$196.32
|
PP = $241.57
|
|
MB = $253.65
|
Most Recent Note - 8/23/2023 5:35:14 PM
Y - Consolidating above its 50 DMA line ($244) and prior highs in the $241 area define important near-term support to watch. Fundamentals remain strong. See the latest FSU analysis for more details and a new annotated graph.
>>> FEATURED STOCK ARTICLE : Consolidating Above 50-Day Moving Average - 8/23/2023 |
View all notes |
Set NEW NOTE alert |
Company Profile |
SEC
News |
Chart |
Request a new note
C
A
S
I |
COKE
-
NASDAQ
Coca-Cola Consolidated
Beverages-Non-Alcoholic
|
$695.99
|
+5.73
0.83% |
$698.83
|
27,875
67.99% of 50 DAV
50 DAV is 41,000
|
$745.53
-6.64%
|
8/3/2023
|
$718.56
|
PP = $694.30
|
|
MB = $729.02
|
Most Recent Note - 8/22/2023 6:22:21 PM
G - Volume was below average today, consolidating near its all-time high but recently sputtering back below its pivot point raising concerns. Fundamentals remain strong.
>>> FEATURED STOCK ARTICLE : Powerful Breakout for COKE - 8/3/2023 |
View all notes |
Set NEW NOTE alert |
Company Profile |
SEC
News |
Chart |
Request a new note
C
A
S
I |
PLUS
-
NASDAQ
ePlus
Computer-Tech Services
|
$63.75
|
+1.28
2.05% |
$64.44
|
104,790
93.56% of 50 DAV
50 DAV is 112,000
|
$75.90
-16.01%
|
8/8/2023
|
$67.60
|
PP = $62.92
|
|
MB = $66.07
|
Most Recent Note - 8/21/2023 5:25:25 PM
Y - Pulled back with lighter volume today for a 7th consecutive loss, consolidating since a noted "breakaway gap" on 8/08/23. Reported earnings +42% on +25% sales revenues for the Jun '23 quarter versus the year-ago period, its 3rd consecutive quarterly earnings increase above the +25% minimum guideline (C criteria) helping it better match the winning models of the fact-based investment system. Annual earnings growth (A criteria) has been strong.
>>> FEATURED STOCK ARTICLE : ePLUS Gapped Up but Ended in Lower Half of Intra-Day Range - 8/8/2023 |
View all notes |
Set NEW NOTE alert |
Company Profile |
SEC
News |
Chart |
Request a new note
C
A
S
I |
|
|
|
THESE ARE NOT BUY RECOMMENDATIONS!
Comments contained in the body of this report are technical
opinions only. The material herein has been obtained
from sources believed to be reliable and accurate, however,
its accuracy and completeness cannot be guaranteed.
This site is not an investment advisor, hence it does
not endorse or recommend any securities or other investments.
Any recommendation contained in this report may not
be suitable for all investors and it is not to be deemed
an offer or solicitation on our part with respect to
the purchase or sale of any securities. All trademarks,
service marks and trade names appearing in this report
are the property of their respective owners, and are
likewise used for identification purposes only.
This report is a service available
only to active Paid Premium Members.
You may opt-out of receiving report notifications
at any time. Questions or comments may be submitted
by writing to Premium Membership Services 665 S.E. 10 Street, Suite 201 Deerfield Beach, FL 33441-5634 or by calling 1-800-965-8307
or 954-785-1121.
|
|
|