You are not logged in.
This means you
CAN ONLY VIEW reports that were published prior to Thursday, March 20, 2025.
You
MUST UPGRADE YOUR MEMBERSHIP if you want to see any current reports.
AFTER MARKET UPDATE - TUESDAY, AUGUST 15TH, 2023
Previous After Market Report Next After Market Report >>>
|
|
|
|
DOW |
-361.24 |
34,946.39 |
-1.02% |
|
Volume |
823,777,169 |
+1% |
|
Volume |
4,504,427,200 |
+4% |
|
NASDAQ |
-157.28 |
13,631.05 |
-1.14% |
|
Advancers |
449 |
16% |
|
Advancers |
1,196 |
27% |
|
S&P 500 |
-51.86 |
4,437.86 |
-1.16% |
|
Decliners |
2,412 |
84% |
|
Decliners |
3,175 |
73% |
|
Russell 2000 |
-24.74 |
1,895.75 |
-1.29% |
|
52 Wk Highs |
32 |
|
|
52 Wk Highs |
63 |
|
|
S&P 600 |
-14.17 |
1,222.94 |
-1.15% |
|
52 Wk Lows |
76 |
|
|
52 Wk Lows |
222 |
|
|
Distributional action and clearly negative breadth on Tuesday had the look of a more worrisome market correction. Greater caution is called for and disciplined investors should be ready to reduce exposure and raise cash by selling any weakening stocks on a case-by-case basis.
|
 |
Major Indices Faced Greater Distributional Pressure
Kenneth J. Gruneisen - Passed the CAN SLIM® Master's Exam
The major indices suffered unanimous losses and ultimately settled near their worst levels of the day. The S&P 500 closed below its 50-day moving average for the first time since March. Volume totals reported were higher than the prior session on the NYSE and on the Nasdaq exchange, action indicative of an increase in institutional selling pressure termed "distribution". Decliners led advancers by more than a 5-1 margin on the NYSE and by a 5-2 margin on the Nasdaq exchange. There were 26 high-ranked companies from the Leaders List that hit a new 52-week high and were listed on the BreakOuts Page, versus the total of 31 on the prior session. New 52-week lows totals rose and outnumbered new 52-week highs on the NYSE and on the Nasdaq exchange. The major indices are in an uptrend that is under pressure (M criteria), Greater caution may be necessary as the latest weakness has the look of a more serious correction.
PICTURED: The Nasdaq Composite Index has been sinking below its 50-day moving average (DMA) line.
Sentiment was hurt by weaker than expected retail sales, industrial production, and fixed asset investment data for July out of China. A warning from Fitch Ratings suggested that it might be forced to downgrade the ratings of dozens of additional banks. Also weighing on the group was Minneapolis Fed President Kashkari's view that banks may need to face tougher capital regulatory standards. The financials (-1.8%) sector slumped.
The energy sector (-2.4%) logged the biggest decline, falling alongside oil prices ($81.11/bbl, -1.41, -1.7%). The health care sector (-0.4%) registered the slimmest loss.
On the earnings front, Dow component Home Depot (HD +0.7%) posted a modest gain after reporting better than expected earnings despite negative sales growth in its Pro segment.
The Treasury market saw the 2-yr Treasury note yield rise as high as 5.01% immediately after the Retail Sales report, but it settled the session down three basis points at 4.94%. The 10-yr note yield, which jumped to 4.26% after the Retail Sales report, settled the session up four basis points to 4.22%. |
 Kenneth J. Gruneisen started out as a licensed stockbroker in August 1987, a couple of months prior to the historic stock market crash that took the Dow Jones Industrial Average down -22.6% in a single day. He has published daily fact-based fundamental and technical analysis on high-ranked stocks online for two decades. Through FACTBASEDINVESTING.COM, Kenneth provides educational articles, news, market commentary, and other information regarding proven investment systems that work in good times and bad.
Comments contained in the body of this report are technical opinions only and are not necessarily those of Gruneisen Growth Corp. The material herein has been obtained from sources believed to be reliable and accurate, however, its accuracy and completeness cannot be guaranteed. Our firm, employees, and customers may effect transactions, including transactions contrary to any recommendation herein, or have positions in the securities mentioned herein or options with respect thereto. Any recommendation contained in this report may not be suitable for all investors and it is not to be deemed an offer or solicitation on our part with respect to the purchase or sale of any securities. |
|
 |
Financial, Retail, Semiconductor, and Commodity-Linked Groups Fell
Kenneth J. Gruneisen - Passed the CAN SLIM® Master's Exam
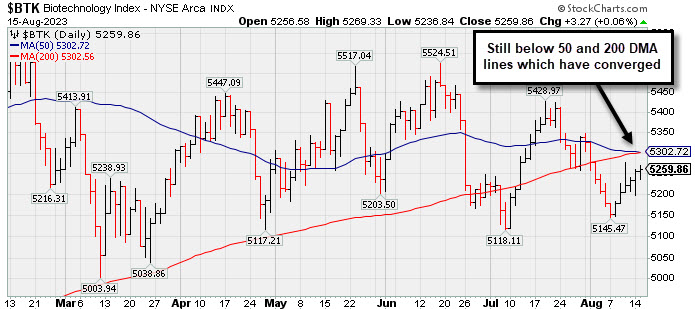
Weakness in the Bank Index ($BKX -2.75%) and the Broker/Dealer Index ($XBD -1.72%) created a drag on the major indices. The Retail Index ($RLX -1.26%) also fell. The tech sector was led lower by the Semiconductor Index ($SOX -1.70%) while the Networking Index ($NWX -0.63%) edged lower and the Biotech Index ($BTK +0.06%) finished flat. Commodity-linked groups also had a negative bias as the Gold & Silver Index ($XAU -2.72%), Integrated Oil Index ($XOI -2.18%), and the Oil Services Index ($OSX -1.57%) each lost ground.
PICTURED: The Biotech Index ($BTK +0.06%) posted a 6th consecutive small gain, rebounding toward its 50-day and 200-day moving average (DMA) lines which have converged.
| Oil Services |
$OSX |
92.00 |
-1.47 |
-1.57% |
+9.71% |
| Integrated Oil |
$XOI |
1,844.98 |
-41.07 |
-2.18% |
+3.23% |
| Semiconductor |
$SOX |
3,553.96 |
-61.49 |
-1.70% |
+40.36% |
| Networking |
$NWX |
795.67 |
-5.07 |
-0.63% |
+1.58% |
| Broker/Dealer |
$XBD |
487.84 |
-8.53 |
-1.72% |
+8.62% |
| Retail |
$RLX |
3,614.85 |
-46.05 |
-1.26% |
+31.26% |
| Gold & Silver |
$XAU |
114.40 |
-3.20 |
-2.72% |
-5.34% |
| Bank |
$BKX |
82.89 |
-2.34 |
-2.75% |
-17.81% |
| Biotech |
$BTK |
5,259.86 |
+3.27 |
+0.06% |
-0.40% |
|
|
|
 |
Pullback with Light Volume Testing Important Support Level
Kenneth J. Gruneisen - Passed the CAN SLIM® Master's Exam
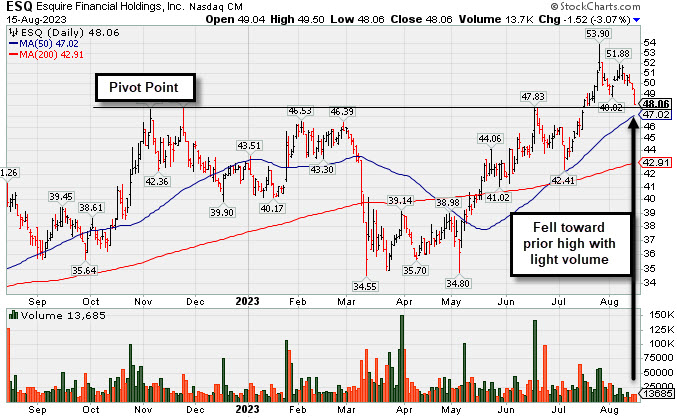
Esquire Financial Hldgs (ESQ -$1.52 or -3.07% to $48.06) fell for a 3rd consecutive loss with below-average volume. It is testing prior highs in the $47 which define important near-term support coinciding with its 50-day moving average (DMA) line ($47.13). More damaging losses would raise greater concenrs and trigger technical sell signals.
ESQ was highlighted in yellow with pivot point cited based on its 11/04/22 high plus 10 cents in the 7/14/23 mid-day report (read here). It was covered in greater detail with an annotated graph that evening under the headline, "Esquire Perched Near Prior Highs". Subsequent gains above the pivot point triggered a proper technical buy signal.
Fundamentals remain strong after it reported Jun '23 quarterly earnings +41% on +35% sales revenues versus the year ago period, continuing its strong earnings track record. It has a highest possible 99 Earnings Per Share Rating. It has reported 5 consecutive quarterly comparisons with an earnings increase above the +25% minimum guideline (C criteria). Its annual earnings growth (A criteria) history has been strong.
This thinly-traded holding company in the Finance - Commercial Loans industry group has a small supply (S criteria) of only 6.5 million shares in the public float, which can contribute to greater price volatility in the event of institutional buying or selling. It completed its $14 IPO on 6/29/17. The number of top-rated funds owning its shares rose form 64 in Sep '21 to 200 in Jun '23, a reassuring sign concerning the I criteria. Its current Up/Down Volume Ratio of 1.3 is an unbiased indication its shares have been under accumulation over the past 50 days.
|
|
|
Color Codes Explained :
Y - Better candidates highlighted by our
staff of experts.
G - Previously featured
in past reports as yellow but may no longer be buyable under the
guidelines.
***Last / Change / Volume data in this table is the closing quote data***
Symbol/Exchange
Company Name
Industry Group |
PRICE |
CHANGE
(%Change) |
Day High |
Volume
(% DAV)
(% 50 day avg vol) |
52 Wk Hi
% From Hi |
Featured
Date |
Price
Featured |
Pivot Featured |
|
Max Buy |
 STRL
-
NASDAQ
STRL
-
NASDAQ
Sterling Infrastructure
Bldg-Heavy Construction
|
$82.29
|
+2.15
2.68% |
$83.18
|
587,653
148.77% of 50 DAV
50 DAV is 395,000
|
$82.32
-0.04%
|
12/14/2022
|
$32.41
|
PP = $33.72
|
|
MB = $35.41
|
 Most Recent Note - 8/15/2023 6:06:17 PM
G - Posted a solid gain today with +49% above average volume for yet another new all-time high. Very extended from any sound base. Bullish action came after it reported Jun '23 quarterly earnings +37% on +13% sales revenues versus the year-ago period.
>>> FEATURED STOCK ARTICLE : Volume-Driven Gains Leave Construction Firm at All-Time High - 8/9/2023 |
View all notes |
Set NEW NOTE alert |
Company Profile |
SEC
News |
Chart |
Request a new note
C
A
S
I |
FIX
-
NYSE
Comfort Systems USA
Bldg-A/C and Heating Prds
|
$178.93
|
+1.08
0.61% |
$180.38
|
213,733
97.59% of 50 DAV
50 DAV is 219,000
|
$182.94
-2.19%
|
4/27/2023
|
$148.85
|
PP = $152.23
|
|
MB = $159.84
|
Most Recent Note - 8/14/2023 5:56:20 PM
G - Holding its ground near its all-time high, extended from any sound base. Its 50 DMA line ($166) defines important near-term support to watch on pullbacks. Reported Jun '23 quarterly earnings +65% on +27% versus the year-ago period.
>>> FEATURED STOCK ARTICLE : Pulled Back From High With Lighter Volume - 7/19/2023 |
View all notes |
Set NEW NOTE alert |
Company Profile |
SEC
News |
Chart |
Request a new note
C
A
S
I |
KOF
-
NYSE
Coca Cola Femsa Sab Ads
FOOD and BEVERAGE - Beverages - Soft Drinks
|
$83.27
|
+0.46
0.56% |
$83.58
|
112,536
73.84% of 50 DAV
50 DAV is 152,400
|
$91.23
-8.73%
|
6/9/2023
|
$88.61
|
PP = $91.33
|
|
MB = $95.90
|
Most Recent Note - 8/14/2023 6:01:39 PM
G - Posted a small gain today with +110% above average volume. A rebound above the 50 DMA line ($84.31) is still needed for its outlook to improve but that short-term average recently has acted as resistance. Its Relative Strength Rating is currently 81. Reported Jun '23 quarterly earnings +23% on +26% sales revenues versus the year-ago period, below the +25% minimum guideline (C criteria).
>>> FEATURED STOCK ARTICLE : 50-Day Moving Average Line has Acted as Resistance - 8/10/2023 |
View all notes |
Set NEW NOTE alert |
Company Profile |
SEC
News |
Chart |
Request a new note
C
A
S
I |
CLH
-
NYSE
Clean Harbors
Pollution Control
|
$174.22
|
-3.50
-1.97% |
$177.45
|
271,815
69.34% of 50 DAV
50 DAV is 392,000
|
$178.33
-2.30%
|
3/10/2023
|
$136.89
|
PP = $136.74
|
|
MB = $143.58
|
Most Recent Note - 8/15/2023 6:07:25 PM
G - Pulled back today with light volume, retreating from its all-time high. Its 50 DMA line ($164) defines important near-term support to watch on pullbacks. Reported earnings for the Jun '23 quarter -13% on +3% sales revenues versus the year-ago period, below the +25% minimum earnings guideline (C criteria), raising fundamental concerns.
>>> FEATURED STOCK ARTICLE : Negative Reversal at High After +26% Rally in 4 Months - 7/18/2023 |
View all notes |
Set NEW NOTE alert |
Company Profile |
SEC
News |
Chart |
Request a new note
C
A
S
I |
HUBB
-
NYSE
Hubbell
Electrical-Power/Equipmt
|
$306.70
|
-3.73
-1.20% |
$311.35
|
353,472
82.20% of 50 DAV
50 DAV is 430,000
|
$340.06
-9.81%
|
4/25/2023
|
$262.85
|
PP = $257.51
|
|
MB = $270.39
|
Most Recent Note - 8/15/2023 6:08:13 PM
G - Still lingering below its 50 DMA line ($318.73). A rebound above the 50 DMA line is needed for its outlook to improve. Fundamentals remain strong after Jun '23 earnings rose +45% on +9% sales revenues versus the year-ago period.
>>> FEATURED STOCK ARTICLE : Pulled Back Undercutting 50 Day Moving Average Line - 7/26/2023 |
View all notes |
Set NEW NOTE alert |
Company Profile |
SEC
News |
Chart |
Request a new note
C
A
S
I |
Symbol/Exchange
Company Name
Industry Group |
PRICE |
CHANGE
(%Change) |
Day High |
Volume
(% DAV)
(% 50 day avg vol) |
52 Wk Hi
% From Hi |
Featured
Date |
Price
Featured |
Pivot Featured |
|
Max Buy |
NVR
-
NYSE
NVR
Bldg-Resident/Comml
|
$6,190.99
|
+32.29
0.52% |
$6,286.88
|
15,683
82.54% of 50 DAV
50 DAV is 19,000
|
$6,474.53
-4.38%
|
4/25/2023
|
$5,882.18
|
PP = $5,978.25
|
|
MB = $6,277.16
|
Most Recent Note - 8/10/2023 6:25:14 PM
G - Reported Jun '23 quarterly earnings -6% on -13% sales revenues, its 2nd subpar quarter, raising greater fundamental concerns. Undercut its 50 DMA line ($6,143) triggering a technical sell signal with today's 3rd consecutive loss backed by light volume.
>>> FEATURED STOCK ARTICLE : Consolidating Above 50 DMA After 2nd Subpar Earnings Report - 8/7/2023 |
View all notes |
Set NEW NOTE alert |
Company Profile |
SEC
News |
Chart |
Request a new note
C
A
S
I |
PHM
-
NYSE
PulteGroup
Bldg-Resident/Comml
|
$84.24
|
+0.20
0.24% |
$85.33
|
2,266,394
87.51% of 50 DAV
50 DAV is 2,590,000
|
$86.16
-2.23%
|
4/25/2023
|
$65.17
|
PP = $64.01
|
|
MB = $67.21
|
Most Recent Note - 8/10/2023 6:26:44 PM
G - Pulled back from its high with today's 2nd loss with below-average volume. It is very extended from any sound base. Recently reported earnings +18% for the Jun '23 quarter versus the year-ago period, below the +25% minimum guideline (C criteria) raising concerns. Its 50 DMA line ($77.88) defines important support to watch.
>>> FEATURED STOCK ARTICLE : Reversed After Reaching a New All-Time High - 7/27/2023 |
View all notes |
Set NEW NOTE alert |
Company Profile |
SEC
News |
Chart |
Request a new note
C
A
S
I |
AMPH
-
NASDAQ
Amphastar Pharm
Medical-Biomed/Biotech
|
$57.25
|
+3.18
5.88% |
$57.64
|
381,284
82.35% of 50 DAV
50 DAV is 463,000
|
$67.66
-15.39%
|
5/15/2023
|
$43.56
|
PP = $44.15
|
|
MB = $46.36
|
Most Recent Note - 8/15/2023 5:49:40 PM
G - Rebounded above its 50 DMA line ($56.44) helping its outlook improve with today's big gain backed by below-average volume. Fundamentals remain strong after it reported Jun '23 quarterly earnings +67% on +18% sales revenues versus the year-ago period.
>>> FEATURED STOCK ARTICLE : 6th Straight Gain for Amphastar - 7/20/2023 |
View all notes |
Set NEW NOTE alert |
Company Profile |
SEC
News |
Chart |
Request a new note
C
A
S
I |
ANET
-
NYSE
Arista Networks
Computer-Networking
|
$179.65
|
+1.53
0.86% |
$181.88
|
1,590,820
49.27% of 50 DAV
50 DAV is 3,229,000
|
$190.65
-5.77%
|
8/1/2023
|
$188.84
|
PP = $178.46
|
|
MB = $187.38
|
Most Recent Note - 8/14/2023 5:53:20 PM
Y - Posted a gain today with light volume. Volume totals have been cooling while hovering near the prior high and pivot point. Bullish action came after it reported Jun '23 quarterly earnings +40% on +39% sales revenues versus the year-ago period. See the latest FSU analysis for more details and a new annotated graph.
>>> FEATURED STOCK ARTICLE : Hovering Near High with Volume Totals Cooling - 8/14/2023 |
View all notes |
Set NEW NOTE alert |
Company Profile |
SEC
News |
Chart |
Request a new note
C
A
S
I |
LSCC
-
NASDAQ
Lattice Semiconductor
Elec-Semicondctor Fablss
|
$87.51
|
-0.82
-0.93% |
$87.78
|
1,130,091
61.48% of 50 DAV
50 DAV is 1,838,000
|
$98.18
-10.87%
|
6/13/2023
|
$91.73
|
PP = $96.92
|
|
MB = $101.77
|
Most Recent Note - 8/14/2023 6:04:07 PM
G - Posted a solid gain today rebounding toward its 50 DMA line ($89.50) which may act as resistance. Subsequent gains above the 50 DMA line are needed for its outlook to improve. Reported Jun '23 quarterly earnings +24% on +18% sales revenues versus the year-ago period, just below the +25% minimum earnings guideline (C criteria).
>>> FEATURED STOCK ARTICLE : Perched Near Pivot Point After Best-Ever Close - 7/17/2023 |
View all notes |
Set NEW NOTE alert |
Company Profile |
SEC
News |
Chart |
Request a new note
C
A
S
I |
Symbol/Exchange
Company Name
Industry Group |
PRICE |
CHANGE
(%Change) |
Day High |
Volume
(% DAV)
(% 50 day avg vol) |
52 Wk Hi
% From Hi |
Featured
Date |
Price
Featured |
Pivot Featured |
|
Max Buy |
XPEL
-
NASDAQ
XPEL
Auto/Truck-Replace Parts
|
$84.26
|
-0.50
-0.59% |
$84.45
|
107,921
81.14% of 50 DAV
50 DAV is 133,000
|
$87.46
-3.66%
|
6/28/2023
|
$83.14
|
PP = $87.11
|
|
MB = $91.47
|
Most Recent Note - 8/11/2023 5:17:11 PM
G - Posted another solid gain today, promptly rebounding well above its 50 DMA line ($80.27), showing resilience after triggering a technical sell signal on 8/09/23. Faces little resistance due to overhead supply up to the $87 level. Reported Jun '23 quarterly earnings +33% on +22% sales revenues versus the year-ago period. Volume and volatility often increase near earnings news.
>>> FEATURED STOCK ARTICLE : Consolidating After Rebounding Above 50-Day Moving Average - 8/2/2023 |
View all notes |
Set NEW NOTE alert |
Company Profile |
SEC
News |
Chart |
Request a new note
C
A
S
I |
PII
-
NYSE
Polaris Industries Inc
AUTOMOTIVE - Recreational Vehicles
|
$121.33
|
-2.37
-1.92% |
$123.74
|
402,441
66.20% of 50 DAV
50 DAV is 607,900
|
$138.29
-12.26%
|
7/11/2023
|
$126.92
|
PP = $123.97
|
|
MB = $130.17
|
Most Recent Note - 8/11/2023 5:11:06 PM
G - Pulled back today for a 7th consecutive loss with below-average volume and undercut its 50 DMA line ($124.65) raising concerns. Recently reported Jun '23 quarterly earnings +0% versus the year-ago period, below the +25% minimum earnings guideline (C criteria). See the latest FSU analysis for more details and a new annotated graph.
>>> FEATURED STOCK ARTICLE : Quiet Pullback Undercut 50-Day Moving Average Line - 8/11/2023 |
View all notes |
Set NEW NOTE alert |
Company Profile |
SEC
News |
Chart |
Request a new note
C
A
S
I |
ESQ
-
NASDAQ
Esquire Finl Hldgs
Finance-Commercial Loans
|
$48.06
|
-1.52
-3.07% |
$49.50
|
13,685
47.19% of 50 DAV
50 DAV is 29,000
|
$54.03
-11.05%
|
7/14/2023
|
$45.80
|
PP = $48.23
|
|
MB = $50.64
|
Most Recent Note - 8/15/2023 6:04:08 PM
Y - Volume was below average behind today's 3rd consecutive loss. Testing prior highs in the $47 area defining important near-term support coinciding with its 50 DMA line. See the latest FSU analysis for more details and a new annotated graph.
>>> FEATURED STOCK ARTICLE : Pullback with Light Volume Testing Important Support Level - 8/15/2023 |
View all notes |
Set NEW NOTE alert |
Company Profile |
SEC
News |
Chart |
Request a new note
C
A
S
I |
MEDP
-
NASDAQ
Medpace Holdings
Medical-Research Eqp/Svc
|
$265.26
|
-0.36
-0.14% |
$267.24
|
146,733
38.31% of 50 DAV
50 DAV is 383,000
|
$269.44
-1.55%
|
7/25/2023
|
$196.32
|
PP = $241.57
|
|
MB = $253.65
|
Most Recent Note - 8/14/2023 5:58:42 PM
G - Color code is changed to green while quietly perched above its "max buy" level near its all-time high. Prior highs in the $241 area define support to watch above its 50 DMA line ($239). Reported earnings increases above the +25% minimum earnings guideline (C criteria) in the past 5 quarterly comparisons through Jun '23.
>>> FEATURED STOCK ARTICLE : Medpace Posted a Solid Volume-Driven Gain for a New High - 7/25/2023 |
View all notes |
Set NEW NOTE alert |
Company Profile |
SEC
News |
Chart |
Request a new note
C
A
S
I |
COKE
-
NASDAQ
Coca-Cola Consolidated
Beverages-Non-Alcoholic
|
$718.41
|
-2.41
-0.33% |
$726.89
|
16,818
39.11% of 50 DAV
50 DAV is 43,000
|
$745.53
-3.64%
|
8/3/2023
|
$718.56
|
PP = $694.30
|
|
MB = $729.02
|
Most Recent Note - 8/11/2023 5:15:14 PM
G - Volume was below average behind today's gain for another new all-time high, rising above its "max buy" level and its color code is changed to green. Prior highs in the $693 area define initial support to watch on pullbacks. Fundamentals remain strong
>>> FEATURED STOCK ARTICLE : Powerful Breakout for COKE - 8/3/2023 |
View all notes |
Set NEW NOTE alert |
Company Profile |
SEC
News |
Chart |
Request a new note
C
A
S
I |
Symbol/Exchange
Company Name
Industry Group |
PRICE |
CHANGE
(%Change) |
Day High |
Volume
(% DAV)
(% 50 day avg vol) |
52 Wk Hi
% From Hi |
Featured
Date |
Price
Featured |
Pivot Featured |
|
Max Buy |
ACLS
-
NASDAQ
Axcelis Technologies
Elec-Semiconductor Equip
|
$169.61
|
-0.78
-0.46% |
$170.80
|
211,802
38.72% of 50 DAV
50 DAV is 547,000
|
$201.00
-15.62%
|
8/4/2023
|
$181.59
|
PP = $201.10
|
|
MB = $211.16
|
Most Recent Note - 8/11/2023 5:12:58 PM
G - Slumped further below its 50 DMA line ($176.66) and below recent lows with yet another loss today backed by above-average volume. A prompt rebound above the 50 DMA line is needed for its outlook to improve. Fundamentals remain strong.
>>> FEATURED STOCK ARTICLE : Formed Ascending Base and Now Testing 50-Day Moving Average - 8/4/2023 |
View all notes |
Set NEW NOTE alert |
Company Profile |
SEC
News |
Chart |
Request a new note
C
A
S
I |
PLUS
-
NASDAQ
ePlus
Computer-Tech Services
|
$64.95
|
-0.23
-0.35% |
$65.61
|
131,785
112.64% of 50 DAV
50 DAV is 117,000
|
$75.90
-14.43%
|
8/8/2023
|
$67.60
|
PP = $62.92
|
|
MB = $66.07
|
Most Recent Note - 8/14/2023 6:00:05 PM
Y - Stubbornly holding its ground since a noted "breakaway gap" on 8/08/23 helped it hit a new all-time high with +202% above average volume triggering a technical buy signal. Reported earnings +42% on +25% sales revenues for the Jun '23 quarter versus the year ago period, its 3rd consecutive quarterly earnings increase above the +25% minimum guideline (C criteria) helping iot better match the winning models of the fact-based investment system. Annual earnings growth (A criteria) has been strong.
>>> FEATURED STOCK ARTICLE : ePLUS Gapped Up but Ended in Lower Half of Intra-Day Range - 8/8/2023 |
View all notes |
Set NEW NOTE alert |
Company Profile |
SEC
News |
Chart |
Request a new note
C
A
S
I |
|
|
|
THESE ARE NOT BUY RECOMMENDATIONS!
Comments contained in the body of this report are technical
opinions only. The material herein has been obtained
from sources believed to be reliable and accurate, however,
its accuracy and completeness cannot be guaranteed.
This site is not an investment advisor, hence it does
not endorse or recommend any securities or other investments.
Any recommendation contained in this report may not
be suitable for all investors and it is not to be deemed
an offer or solicitation on our part with respect to
the purchase or sale of any securities. All trademarks,
service marks and trade names appearing in this report
are the property of their respective owners, and are
likewise used for identification purposes only.
This report is a service available
only to active Paid Premium Members.
You may opt-out of receiving report notifications
at any time. Questions or comments may be submitted
by writing to Premium Membership Services 665 S.E. 10 Street, Suite 201 Deerfield Beach, FL 33441-5634 or by calling 1-800-965-8307
or 954-785-1121.
|
|
|