You are not logged in.
This means you
CAN ONLY VIEW reports that were published prior to Thursday, March 20, 2025.
You
MUST UPGRADE YOUR MEMBERSHIP if you want to see any current reports.
AFTER MARKET UPDATE - TUESDAY, AUGUST 22ND, 2023
Previous After Market Report Next After Market Report >>>
|
|
|
|
DOW |
-174.86 |
34,288.83 |
-0.51% |
|
Volume |
756,205,820 |
-8% |
|
Volume |
4,343,240,100 |
-0% |
|
NASDAQ |
+8.28 |
13,505.87 |
+0.06% |
|
Advancers |
1,209 |
43% |
|
Advancers |
1,766 |
41% |
|
S&P 500 |
-12.22 |
4,387.55 |
-0.28% |
|
Decliners |
1,629 |
57% |
|
Decliners |
2,528 |
59% |
|
Russell 2000 |
-5.18 |
1,850.84 |
-0.28% |
|
52 Wk Highs |
35 |
|
|
52 Wk Highs |
44 |
|
|
S&P 600 |
-2.77 |
1,193.44 |
-0.23% |
|
52 Wk Lows |
84 |
|
|
52 Wk Lows |
243 |
|
|
Last week's distributional action, clearly negative breadth, and waning leadership signaled a more worrisome market correction (M criteria). Greater caution is called for and disciplined investors should be ready to reduce exposure and raise cash by selling any weakening stocks on a case-by-case basis.
|
 |
Breadth Negative as Major Indices Ended Mixed
Kenneth J. Gruneisen - Passed the CAN SLIM® Master's Exam
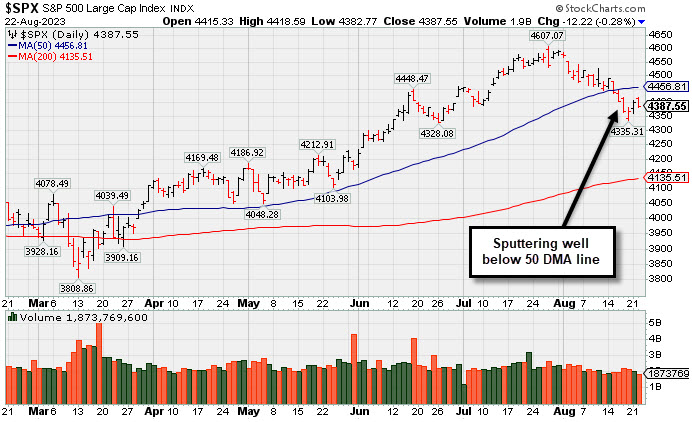
The major indices ultimately settled the session near their worst levels of the day. The Dow Jones Industrial Average fell 0.5%, the S&P 500 fell 0.3%, and the Nasdaq rose 0.1%. Volume totals reported were lighter than the prior session on the NYSE and on the Nasdaq exchange. Decliners led advancers by a 4-3 margin on the NYSE and by almost a 3-2 margin on the Nasdaq exchange. There were 15 high-ranked companies from the Leaders List that hit a new 52-week high and were listed on the BreakOuts Page, versus the total of 9 on the prior session. New 52-week lows totals still solidly outnumbered new 52-week highs totals on both the NYSE and on the Nasdaq exchange. The major indices are in a correction (M criteria). Leadership has quickly evaporated as indicated by waning new highs totals on both major exchanges. New buying efforts should be avoided until a new confirmed rally marked by a solid follow-through day.
PICTURED: The S&P 500 Index suffered another loss, sputtering well below its 50-day moving average (DMA) line.
The S&P 500 financials sector (-0.8%) saw the largest sector decline due to its weak bank components. The real estate sector (+0.3%), meanwhile, led the outperformers. Weak bank stocks were a notable overhang for the broader market after S&P downgraded the credit ratings of multiple banks, noting concerns about funding risks from rising rates and weaker profitability. Homebuilders outperformed the broader market, boosted in part by an existing home sales report for July that continued to show a lean supply of homes for sale.
Macy's (M -14.05%) cited weakening consumer credit conditions in its business following its earnings report. Dick's Sporting Goods (DKS -24.15%) was another big loser after earnings were well shy of consensus earnings estimates. DKS attributed its disappointing profits and guidance to inventory shrink (i.e. theft). Lowe's (LOW +3.75%) was a standout gainer after its quarterly report.
Treasury yields declined ultimately settled below their highs of the day as the 2-yr note yield note yield rose five basis points to 5.04% and the 10-yr note yield fell one basis point to 4.33%.
|
 Kenneth J. Gruneisen started out as a licensed stockbroker in August 1987, a couple of months prior to the historic stock market crash that took the Dow Jones Industrial Average down -22.6% in a single day. He has published daily fact-based fundamental and technical analysis on high-ranked stocks online for two decades. Through FACTBASEDINVESTING.COM, Kenneth provides educational articles, news, market commentary, and other information regarding proven investment systems that work in good times and bad.
Comments contained in the body of this report are technical opinions only and are not necessarily those of Gruneisen Growth Corp. The material herein has been obtained from sources believed to be reliable and accurate, however, its accuracy and completeness cannot be guaranteed. Our firm, employees, and customers may effect transactions, including transactions contrary to any recommendation herein, or have positions in the securities mentioned herein or options with respect thereto. Any recommendation contained in this report may not be suitable for all investors and it is not to be deemed an offer or solicitation on our part with respect to the purchase or sale of any securities. |
|
 |
Financial Indexes and Semiconductor Index Fell
Kenneth J. Gruneisen - Passed the CAN SLIM® Master's Exam
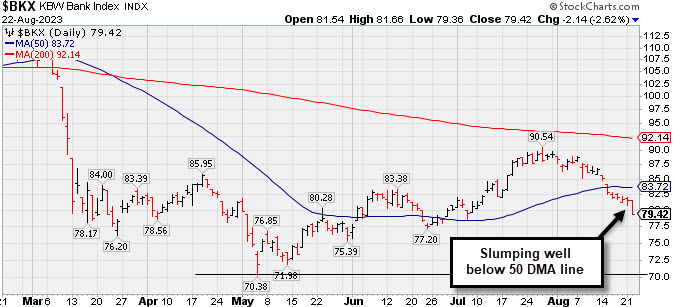
Financials were weak and created a drag on the major averages as the Bank Index ($BKX -2.62%) outpaced the Broker/Dealer Index ($XBD -1.07%) to the downside. The Semiconductor Index ($SOX -0.93%) lost ground while the Biotech Index ($BTK -0.05%) was unchanged, meanwhile the Networking Index ($NWX +0.69%) edged higher. The Retail Index ($RLX -0.14%) was little changed. Commodity-linked groups were mixed and indecisive as the Gold & Silver Index ($XAU +0.75%) edged higher while the Oil Services Index ($OSX -1.26%) and the Integrated Oil Index ($XOI -0.57%) both lost ground.
PICTURED: The Bank Index ($BKX -2.62%) is slumping well below its 50-day moving average (DMA) line but remains well above its 2023 low.
| Oil Services |
$OSX |
90.24 |
-1.15 |
-1.26% |
+7.61% |
| Integrated Oil |
$XOI |
1,850.86 |
-10.69 |
-0.57% |
+3.56% |
| Semiconductor |
$SOX |
3,527.69 |
-33.05 |
-0.93% |
+39.32% |
| Networking |
$NWX |
785.25 |
+5.35 |
+0.69% |
+0.25% |
| Broker/Dealer |
$XBD |
492.12 |
-5.31 |
-1.07% |
+9.57% |
| Retail |
$RLX |
3,545.76 |
-4.97 |
-0.14% |
+28.75% |
| Gold & Silver |
$XAU |
112.81 |
+0.83 |
+0.75% |
-6.66% |
| Bank |
$BKX |
79.42 |
-2.14 |
-2.62% |
-21.25% |
| Biotech |
$BTK |
5,239.48 |
-2.48 |
-0.05% |
-0.79% |
|
|
|
 |
Rebound Above 50-Day Moving Average Needed for Outlook to Improve
Kenneth J. Gruneisen - Passed the CAN SLIM® Master's Exam
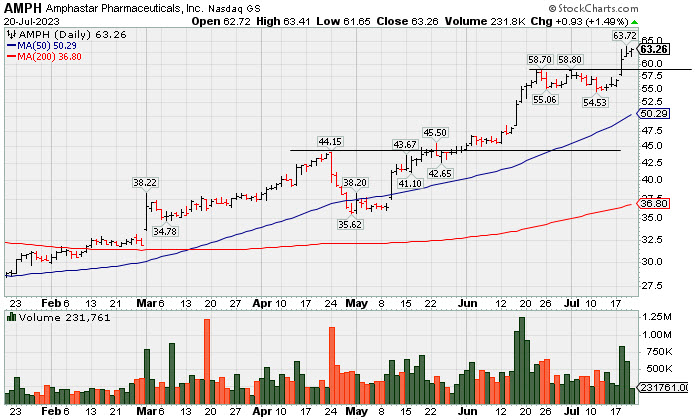
Amphastar Pharm (AMPH +$0.01 or +0.02% to $53.49) has recently sputtered below its 50-day-moving average (DMA) line ($57.23) which is acting as resistance after damaging volume-driven losses. A rebound above that important short-term average is needed for its outlook to improve. Fundamentals remain strong after it reported Jun '23 quarterly earnings +67% on +18% sales revenues versus the year-ago period.
AMPH was highlighted in yellow with pivot point cited based on its 4/24/23 high in the 5/15/23 mid-day report (read here). It was last coverned in greater detail on 7/20/23 with an annotated graph under the headline "6th Straight Gain for Amphastar".
It hails from the Medical-Biomed/Biotech group which is currently ranked 59th on the 197 Industry Groyups list (L cvriteria). It has a 99 Earnings Per Share Rating, well above the 80+ minimum guideline for buy candidates. The 3 latest quarterly comparisons has been well above the +25% minimum earnings guideline (C criteria). Annual earnings history (A criteria) has been strong.
The number of top-rated funds owning its shares reportedly rose from 435 in Mar '23 to 441 in Jun '23, a somewhat reassuring sign concerning the I criteria. Its current Up/Down Volume Ratio of 1.3, is an unbiased indication its shares have been under accumulation over the past 50 days.
|
|
|
Color Codes Explained :
Y - Better candidates highlighted by our
staff of experts.
G - Previously featured
in past reports as yellow but may no longer be buyable under the
guidelines.
***Last / Change / Volume data in this table is the closing quote data***
Symbol/Exchange
Company Name
Industry Group |
PRICE |
CHANGE
(%Change) |
Day High |
Volume
(% DAV)
(% 50 day avg vol) |
52 Wk Hi
% From Hi |
Featured
Date |
Price
Featured |
Pivot Featured |
|
Max Buy |
 STRL
-
NASDAQ
STRL
-
NASDAQ
Sterling Infrastructure
Bldg-Heavy Construction
|
$77.65
|
+0.24
0.31% |
$78.48
|
253,990
60.62% of 50 DAV
50 DAV is 419,000
|
$83.81
-7.35%
|
12/14/2022
|
$32.41
|
PP = $33.72
|
|
MB = $35.41
|
 Most Recent Note - 8/22/2023 6:18:13 PM
G - Hovering near its all-time high, very extended from any sound base, well above its 50 DMA line ($61) which defines support. Jun '23 quarterly earnings rose +37% on +13% sales revenues versus the year-ago period.
>>> FEATURED STOCK ARTICLE : Volume-Driven Gains Leave Construction Firm at All-Time High - 8/9/2023 |
View all notes |
Set NEW NOTE alert |
Company Profile |
SEC
News |
Chart |
Request a new note
C
A
S
I |
FIX
-
NYSE
Comfort Systems USA
Bldg-A/C and Heating Prds
|
$178.60
|
+1.58
0.89% |
$180.74
|
238,557
112.53% of 50 DAV
50 DAV is 212,000
|
$182.94
-2.37%
|
4/27/2023
|
$148.85
|
PP = $152.23
|
|
MB = $159.84
|
Most Recent Note - 8/21/2023 5:08:25 PM
G - Still stubbornly holding its ground near its all-time high. Its 50 DMA line ($168) defines important near-term support to watch on pullbacks. Fundamentals remain strong. See the latest FSU analysis for more details and a new annotated graph.
>>> FEATURED STOCK ARTICLE : FIX Still Stubbornly Hovering Near High - 8/21/2023 |
View all notes |
Set NEW NOTE alert |
Company Profile |
SEC
News |
Chart |
Request a new note
C
A
S
I |
KOF
-
NYSE
Coca-Cola Femsa ADR
Beverages-Non-Alcoholic
|
$86.00
|
+0.33
0.39% |
$86.80
|
122,910
83.61% of 50 DAV
50 DAV is 147,000
|
$91.23
-5.73%
|
6/9/2023
|
$88.61
|
PP = $91.33
|
|
MB = $95.90
|
Most Recent Note - 8/22/2023 6:23:12 PM
G - Recently rebounding above the 50 DMA line ($84.18) helping its outlook to improve. Faces some near-term resistance due to overhead supply up to the $91 area. Its Relative Strength Rating is currently 88. Reported Jun '23 quarterly earnings +23% on +26% sales revenues versus the year-ago period, below the +25% minimum guideline (C criteria).
>>> FEATURED STOCK ARTICLE : 50-Day Moving Average Line has Acted as Resistance - 8/10/2023 |
View all notes |
Set NEW NOTE alert |
Company Profile |
SEC
News |
Chart |
Request a new note
C
A
S
I |
CLH
-
NYSE
Clean Harbors
Pollution Control
|
$170.43
|
-1.78
-1.03% |
$172.58
|
251,001
67.11% of 50 DAV
50 DAV is 374,000
|
$178.33
-4.43%
|
3/10/2023
|
$136.89
|
PP = $136.74
|
|
MB = $143.58
|
Most Recent Note - 8/21/2023 5:11:23 PM
G - Still hovering near its all-time high with volume totals cooling. Its 50 DMA line ($165) defines important near-term support to watch on pullbacks. Reported earnings for the Jun '23 quarter -13% on +3% sales revenues versus the year-ago period, below the +25% minimum earnings guideline (C criteria), raising fundamental concerns.
>>> FEATURED STOCK ARTICLE : Volume Totals Have Been Cooling While Hovering Near High - 8/18/2023 |
View all notes |
Set NEW NOTE alert |
Company Profile |
SEC
News |
Chart |
Request a new note
C
A
S
I |
HUBB
-
NYSE
Hubbell
Electrical-Power/Equipmt
|
$307.18
|
-0.14
-0.05% |
$310.33
|
212,162
49.69% of 50 DAV
50 DAV is 427,000
|
$340.06
-9.67%
|
4/25/2023
|
$262.85
|
PP = $257.51
|
|
MB = $270.39
|
Most Recent Note - 8/21/2023 5:09:44 PM
G - Still lingering below its 50 DMA line ($319) yet perched only -9.6% off its all-time high. A rebound above the 50 DMA line is needed for its outlook to improve. Fundamentals remain strong after Jun '23 earnings rose +45% on +9% sales revenues versus the year-ago period.
>>> FEATURED STOCK ARTICLE : Pulled Back Undercutting 50 Day Moving Average Line - 7/26/2023 |
View all notes |
Set NEW NOTE alert |
Company Profile |
SEC
News |
Chart |
Request a new note
C
A
S
I |
Symbol/Exchange
Company Name
Industry Group |
PRICE |
CHANGE
(%Change) |
Day High |
Volume
(% DAV)
(% 50 day avg vol) |
52 Wk Hi
% From Hi |
Featured
Date |
Price
Featured |
Pivot Featured |
|
Max Buy |
PHM
-
NYSE
PulteGroup
Bldg-Resident/Comml
|
$78.83
|
+0.87
1.12% |
$79.75
|
2,329,695
90.19% of 50 DAV
50 DAV is 2,583,000
|
$86.16
-8.51%
|
4/25/2023
|
$65.17
|
PP = $64.01
|
|
MB = $67.21
|
Most Recent Note - 8/22/2023 6:24:59 PM
G - Sputtering below its 50 DMA line ($79.67) since a noted loss on 8/17/23 triggering a technical sell signal. A rebound above the 50 DMA line is needed for its outlook to improve. Recently reported earnings +18% for the Jun '23 quarter versus the year-ago period, below the +25% minimum guideline (C criteria) raising concerns.
>>> FEATURED STOCK ARTICLE : Reversed After Reaching a New All-Time High - 7/27/2023 |
View all notes |
Set NEW NOTE alert |
Company Profile |
SEC
News |
Chart |
Request a new note
C
A
S
I |
AMPH
-
NASDAQ
Amphastar Pharm
Medical-Biomed/Biotech
|
$53.49
|
+0.01
0.02% |
$53.85
|
282,329
62.05% of 50 DAV
50 DAV is 455,000
|
$67.66
-20.94%
|
5/15/2023
|
$43.56
|
PP = $44.15
|
|
MB = $46.36
|
Most Recent Note - 8/22/2023 6:16:23 PM
G - Stilll sputtering below its 50 DMA line ($57.23) after damaging volume-driven losses. A rebound above the 50 DMA line is needed for its outlook to improve. Fundamentals remain strong after it reported Jun '23 quarterly earnings +67% on +18% sales revenues versus the year-ago period. See the latest FSU analysis for more details and a new annotated graph.
>>> FEATURED STOCK ARTICLE : Rebound Above 50-Day Moving Average Needed for Outlook to Improve - 8/22/2023 |
View all notes |
Set NEW NOTE alert |
Company Profile |
SEC
News |
Chart |
Request a new note
C
A
S
I |
ANET
-
NYSE
Arista Networks
Computer-Networking
|
$187.52
|
+2.85
1.54% |
$189.18
|
3,630,294
113.62% of 50 DAV
50 DAV is 3,195,000
|
$190.65
-1.64%
|
8/1/2023
|
$188.84
|
PP = $178.46
|
|
MB = $187.38
|
Most Recent Note - 8/21/2023 5:16:02 PM
Y - Posted a gain with light volume today for its second-best-ever close. Stubbornly held its ground above the prior high and pivot point. Bullish action came after it reported Jun '23 quarterly earnings +40% on +39% sales revenues versus the year-ago period.
>>> FEATURED STOCK ARTICLE : Hovering Near High with Volume Totals Cooling - 8/14/2023 |
View all notes |
Set NEW NOTE alert |
Company Profile |
SEC
News |
Chart |
Request a new note
C
A
S
I |
LSCC
-
NASDAQ
Lattice Semiconductor
Elec-Semicondctor Fablss
|
$91.08
|
-0.11
-0.12% |
$93.13
|
1,198,123
68.35% of 50 DAV
50 DAV is 1,753,000
|
$98.18
-7.23%
|
6/13/2023
|
$91.73
|
PP = $96.92
|
|
MB = $101.77
|
Most Recent Note - 8/21/2023 5:14:35 PM
G - Posted a solid gain today with average volume, rebounding above its 50 DMA line ($90.26) helping its technical stance and outlook to improve. Reported Jun '23 quarterly earnings +24% on +18% sales revenues versus the year-ago period, just below the +25% minimum earnings guideline (C criteria). See the latest FSU analysis for more details and a new annotated graph.
>>> FEATURED STOCK ARTICLE : Rebound Needed Above 50-Day Moving Average for Lattice - 8/17/2023 |
View all notes |
Set NEW NOTE alert |
Company Profile |
SEC
News |
Chart |
Request a new note
C
A
S
I |
XPEL
-
NASDAQ
XPEL
Auto/Truck-Replace Parts
|
$84.64
|
+2.19
2.66% |
$84.70
|
99,944
76.88% of 50 DAV
50 DAV is 130,000
|
$87.46
-3.22%
|
8/22/2023
|
$84.64
|
PP = $87.56
|
|
MB = $91.94
|
Most Recent Note - 8/22/2023 6:20:46 PM
Y - Color code is changed to yellow with new pivot point cited based on its 7/11/23 high plus 10 cents. Faces little resistance due to overhead supply up to the $87 level. Still consolidating with average or below-average volume totals, staying above its 50 DMA line ($81.61). Fundamentals remain strong.
>>> FEATURED STOCK ARTICLE : Consolidating After Rebounding Above 50-Day Moving Average - 8/2/2023 |
View all notes |
Set NEW NOTE alert |
Company Profile |
SEC
News |
Chart |
Request a new note
C
A
S
I |
Symbol/Exchange
Company Name
Industry Group |
PRICE |
CHANGE
(%Change) |
Day High |
Volume
(% DAV)
(% 50 day avg vol) |
52 Wk Hi
% From Hi |
Featured
Date |
Price
Featured |
Pivot Featured |
|
Max Buy |
ESQ
-
NASDAQ
Esquire Finl Hldgs
Finance-Commercial Loans
|
$47.17
|
-0.32
-0.67% |
$47.54
|
15,927
56.88% of 50 DAV
50 DAV is 28,000
|
$54.03
-12.70%
|
7/14/2023
|
$45.80
|
PP = $48.23
|
|
MB = $50.64
|
Most Recent Note - 8/21/2023 5:13:10 PM
Y - Volume has been below average behind 6 losses in the span of 7 sessions and it is testing prior highs in the $47 area defining important near-term support coinciding with its 50 DMA line.
>>> FEATURED STOCK ARTICLE : Pullback with Light Volume Testing Important Support Level - 8/15/2023 |
View all notes |
Set NEW NOTE alert |
Company Profile |
SEC
News |
Chart |
Request a new note
C
A
S
I |
MEDP
-
NASDAQ
Medpace Holdings
Medical-Research Eqp/Svc
|
$248.20
|
+2.22
0.90% |
$250.00
|
239,135
64.63% of 50 DAV
50 DAV is 370,000
|
$269.44
-7.88%
|
7/25/2023
|
$196.32
|
PP = $241.57
|
|
MB = $253.65
|
Most Recent Note - 8/21/2023 5:19:03 PM
Y - Pulled back today for a 7th consecutive loss with higher (near average) volume. Its 50 DMA line ($242) and prior highs in the $241 area define important near-term support to watch. Fundamentals remain strong.
>>> FEATURED STOCK ARTICLE : Medpace Posted a Solid Volume-Driven Gain for a New High - 7/25/2023 |
View all notes |
Set NEW NOTE alert |
Company Profile |
SEC
News |
Chart |
Request a new note
C
A
S
I |
COKE
-
NASDAQ
Coca-Cola Consolidated
Beverages-Non-Alcoholic
|
$690.26
|
+0.68
0.10% |
$694.60
|
25,922
63.22% of 50 DAV
50 DAV is 41,000
|
$745.53
-7.41%
|
8/3/2023
|
$718.56
|
PP = $694.30
|
|
MB = $729.02
|
Most Recent Note - 8/22/2023 6:22:21 PM
G - Volume was below average today, consolidating near its all-time high but recently sputtering back below its pivot point raising concerns. Fundamentals remain strong.
>>> FEATURED STOCK ARTICLE : Powerful Breakout for COKE - 8/3/2023 |
View all notes |
Set NEW NOTE alert |
Company Profile |
SEC
News |
Chart |
Request a new note
C
A
S
I |
PLUS
-
NASDAQ
ePlus
Computer-Tech Services
|
$62.47
|
+0.76
1.23% |
$63.04
|
124,762
110.41% of 50 DAV
50 DAV is 113,000
|
$75.90
-17.69%
|
8/8/2023
|
$67.60
|
PP = $62.92
|
|
MB = $66.07
|
Most Recent Note - 8/21/2023 5:25:25 PM
Y - Pulled back with lighter volume today for a 7th consecutive loss, consolidating since a noted "breakaway gap" on 8/08/23. Reported earnings +42% on +25% sales revenues for the Jun '23 quarter versus the year-ago period, its 3rd consecutive quarterly earnings increase above the +25% minimum guideline (C criteria) helping it better match the winning models of the fact-based investment system. Annual earnings growth (A criteria) has been strong.
>>> FEATURED STOCK ARTICLE : ePLUS Gapped Up but Ended in Lower Half of Intra-Day Range - 8/8/2023 |
View all notes |
Set NEW NOTE alert |
Company Profile |
SEC
News |
Chart |
Request a new note
C
A
S
I |
|
|
|
THESE ARE NOT BUY RECOMMENDATIONS!
Comments contained in the body of this report are technical
opinions only. The material herein has been obtained
from sources believed to be reliable and accurate, however,
its accuracy and completeness cannot be guaranteed.
This site is not an investment advisor, hence it does
not endorse or recommend any securities or other investments.
Any recommendation contained in this report may not
be suitable for all investors and it is not to be deemed
an offer or solicitation on our part with respect to
the purchase or sale of any securities. All trademarks,
service marks and trade names appearing in this report
are the property of their respective owners, and are
likewise used for identification purposes only.
This report is a service available
only to active Paid Premium Members.
You may opt-out of receiving report notifications
at any time. Questions or comments may be submitted
by writing to Premium Membership Services 665 S.E. 10 Street, Suite 201 Deerfield Beach, FL 33441-5634 or by calling 1-800-965-8307
or 954-785-1121.
|
|
|