You are not logged in.
This means you
CAN ONLY VIEW reports that were published prior to Thursday, March 20, 2025.
You
MUST UPGRADE YOUR MEMBERSHIP if you want to see any current reports.
AFTER MARKET UPDATE - FRIDAY, JULY 21ST, 2023
Previous After Market Report Next After Market Report >>>
|
|
|
|
DOW |
+2.51 |
35,227.69 |
+0.01% |
|
Volume |
915,809,599 |
+11% |
|
Volume |
5,394,185,300 |
+5% |
|
NASDAQ |
-30.50 |
14,032.81 |
-0.22% |
|
Advancers |
1,423 |
49% |
|
Advancers |
1,996 |
46% |
|
S&P 500 |
+1.45 |
4,536.32 |
+0.03% |
|
Decliners |
1,463 |
51% |
|
Decliners |
2,353 |
54% |
|
Russell 2000 |
-6.90 |
1,960.26 |
-0.35% |
|
52 Wk Highs |
84 |
|
|
52 Wk Highs |
107 |
|
|
S&P 600 |
-4.22 |
1,256.75 |
-0.33% |
|
52 Wk Lows |
7 |
|
|
52 Wk Lows |
68 |
|
|
 |
Leadership Thinned as Major Indices Were Little Changed
Kenneth J. Gruneisen - Passed the CAN SLIM® Master's Exam
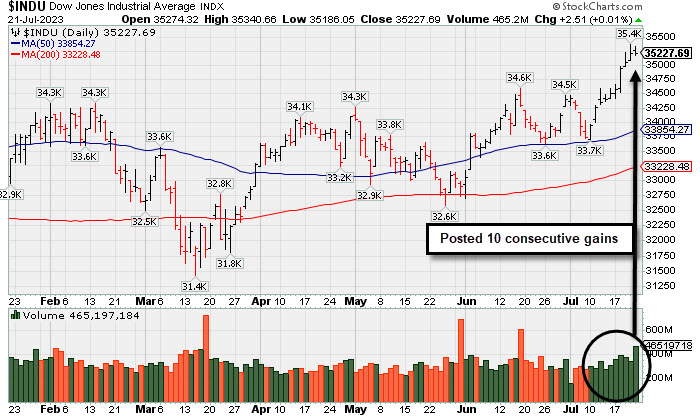
The market-cap weighted S&P 500 closed flat and the Dow Jones Industrial Average inched 2 points higher as it logged its tenth consecutive winning session. The volume totals reported were higher on the NYSE and on the Nasdaq exchange versus the prior session. Decliners narrowly led advancers on the NYSE and led by a 6-5 margin on the Nasdaq exchange. Leadership thinned as there were 26 high-ranked companies from the Leaders List that hit a new 52-week high and were listed on the BreakOuts Page, versus the total of 55 on the prior session, down considerably from 155 on Tuesday. New 52-week highs outnumbered new 52-week lows on the NYSE and on the Nasdaq exchange. The major indices are in a confirmed uptrend (M criteria). Appropriate new buying efforts may be considered under the fact-based investment system.
PICTURED: The Dow Jones Industrial Average has posted 10 consecutive gains.
Semiconductor stocks were a pocket of strength, bouncing back from losses Thursday. The PHLX Semiconductor Index rose 1.0%. Dow component American Express (AXP -3.9%) was a notable laggard, its earnings report featuring lower than expected revenues and a notable increase in the provision for credit losses.
Roughly half of the S&P 500 sectors closed with a gain led by utilities (+1.5%), health care (+1.0%), and energy (+0.8%). The communication services (-0.5%) and industrials (-0.5%) sectors resided at the bottom of the pack along with the financials (-0.3%) and information technology (-0.3%) sectors.
Next week will be policy meetings for the Fed, the ECB, and the Bank of Japan. The economic calendar, in turn, will feature a number of key releases highlighted by the Adv. Q2 GDP report and the June Personal Income and Spending Report that will include the Fed's preferred inflation gauge in the form of the core-PCE Price Index. As a reminder, the Nasdaq 100 special rebalance goes into effect before Monday's open.
|
 Kenneth J. Gruneisen started out as a licensed stockbroker in August 1987, a couple of months prior to the historic stock market crash that took the Dow Jones Industrial Average down -22.6% in a single day. He has published daily fact-based fundamental and technical analysis on high-ranked stocks online for two decades. Through FACTBASEDINVESTING.COM, Kenneth provides educational articles, news, market commentary, and other information regarding proven investment systems that work in good times and bad.
Comments contained in the body of this report are technical opinions only and are not necessarily those of Gruneisen Growth Corp. The material herein has been obtained from sources believed to be reliable and accurate, however, its accuracy and completeness cannot be guaranteed. Our firm, employees, and customers may effect transactions, including transactions contrary to any recommendation herein, or have positions in the securities mentioned herein or options with respect thereto. Any recommendation contained in this report may not be suitable for all investors and it is not to be deemed an offer or solicitation on our part with respect to the purchase or sale of any securities. |
|
 |
Semiconductor, Biotech, and Integrated Oil Indexes Rose
Kenneth J. Gruneisen - Passed the CAN SLIM® Master's Exam
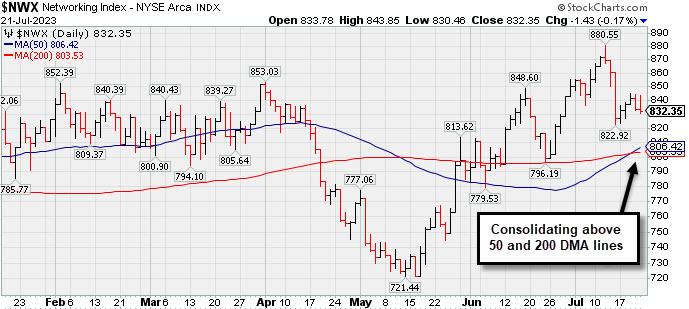
The Bank Index ($BKX -0.97%) lost ground while the Broker/Dealer Index ($XBD -0.02% finished flat and the Retail Index ($RLX +0.19%) inched higher. The tech sector was led by the Semiconductor Index ($SOX +0.96%) while the Biotech Index ($BTK +0.57%) posted a smaller gain and the Networking Index ($NWX -0.17%) suffered a small loss. The Gold & Silver Index ($XAU -0.18%) and the Oil Services Index ($OSX -0.27%) suffered small losses while the Integrated Oil Index ($XOI +1.07%) posted a gain.
PICTURED: The Networking Index ($NWX -0.17%) is consolidating above its 200-day and 50-day moving average (DMA) lines.
| Oil Services |
$OSX |
89.06 |
-0.24 |
-0.27% |
+6.20% |
| Integrated Oil |
$XOI |
1,766.09 |
+18.64 |
+1.07% |
-1.18% |
| Semiconductor |
$SOX |
3,698.85 |
+35.00 |
+0.96% |
+46.08% |
| Networking |
$NWX |
832.35 |
-1.43 |
-0.17% |
+6.26% |
| Broker/Dealer |
$XBD |
512.51 |
-0.09 |
-0.02% |
+14.11% |
| Retail |
$RLX |
3,495.31 |
+6.73 |
+0.19% |
+26.92% |
| Gold & Silver |
$XAU |
126.48 |
-0.23 |
-0.18% |
+4.65% |
| Bank |
$BKX |
87.67 |
-0.86 |
-0.97% |
-13.07% |
| Biotech |
$BTK |
5,411.76 |
+30.78 |
+0.57% |
+2.47% |
|
|
|
 |
Featured Stocks
Kenneth J. Gruneisen - Passed the CAN SLIM® Master's Exam
|
|
|
Color Codes Explained :
Y - Better candidates highlighted by our
staff of experts.
G - Previously featured
in past reports as yellow but may no longer be buyable under the
guidelines.
***Last / Change / Volume data in this table is the closing quote data***
Symbol/Exchange
Company Name
Industry Group |
PRICE |
CHANGE
(%Change) |
Day High |
Volume
(% DAV)
(% 50 day avg vol) |
52 Wk Hi
% From Hi |
Featured
Date |
Price
Featured |
Pivot Featured |
|
Max Buy |
 STRL
-
NASDAQ
STRL
-
NASDAQ
Sterling Infrastructure
Bldg-Heavy Construction
|
$57.96
|
-0.50
-0.86% |
$59.29
|
293,641
94.12% of 50 DAV
50 DAV is 312,000
|
$60.58
-4.32%
|
12/14/2022
|
$32.41
|
PP = $33.72
|
|
MB = $35.41
|
Most Recent Note - 7/18/2023 6:02:57 PM
G - Posted a 4th consecutive gain today hitting a new all-time high, very extended from any sound base. Mar '23 quarterly earnings were below the +25% minimum guideline (C criteria) raising fundamental concerns.
>>> FEATURED STOCK ARTICLE : Streak of Gains Lifts Sterling Infrastructure to New Highs - 7/3/2023 |
View all notes |
Set NEW NOTE alert |
Company Profile |
SEC
News |
Chart |
Request a new note
C
A
S
I |
FIX
-
NYSE
Comfort Systems USA
Bldg-A/C and Heating Prds
|
$164.79
|
-1.06
-0.64% |
$167.36
|
152,594
66.35% of 50 DAV
50 DAV is 230,000
|
$172.02
-4.20%
|
4/27/2023
|
$148.85
|
PP = $152.23
|
|
MB = $159.84
|
Most Recent Note - 7/19/2023 6:27:35 PM
G - Pulled back today with below-average after hitting a new all-time high on the prior session. No resistance remains due to overhead supply. Its 50 DMA line ($157.48) defines important near-term support to watch on pullbacks. See the latest FSU analysis for more details and a new annotated graph.
>>> FEATURED STOCK ARTICLE : Pulled Back From High With Lighter Volume - 7/19/2023 |
View all notes |
Set NEW NOTE alert |
Company Profile |
SEC
News |
Chart |
Request a new note
C
A
S
I |
KOF
-
NYSE
Coca-Cola Femsa ADR
Beverages-Non-Alcoholic
|
$83.33
|
+0.84
1.02% |
$83.75
|
54,167
32.44% of 50 DAV
50 DAV is 167,000
|
$91.23
-8.66%
|
6/9/2023
|
$88.61
|
PP = $91.33
|
|
MB = $95.90
|
Most Recent Note - 7/20/2023 1:18:11 PM
G - Pulling back with below-average volume behind recent losses. The longer it lingers below its 50 DMA line the worse its outlook gets. A rebound above the 50 DMA line ($85.81) is needed for its outlook to improve. Fundamentals remain strong.
>>> FEATURED STOCK ARTICLE : Slumping Below 50-Day Moving Average and Below Prior Low - 7/6/2023 |
View all notes |
Set NEW NOTE alert |
Company Profile |
SEC
News |
Chart |
Request a new note
C
A
S
I |
CLH
-
NYSE
Clean Harbors
Pollution Control
|
$169.14
|
-0.94
-0.55% |
$171.04
|
485,494
128.10% of 50 DAV
50 DAV is 379,000
|
$172.54
-1.97%
|
3/10/2023
|
$136.89
|
PP = $136.74
|
|
MB = $143.58
|
Most Recent Note - 7/18/2023 5:55:58 PM
G - Volume totals have been cooling after a noted "negative reversal" at its all-time high. It is extended from any sound base. Its 50 DMA line ($152.82) defines important near-term support to watch on pullbacks. Fundamentals remain strong. See the latest FSU analysis for more details and a new annotated graph.
>>> FEATURED STOCK ARTICLE : Negative Reversal at High After +26% Rally in 4 Months - 7/18/2023 |
View all notes |
Set NEW NOTE alert |
Company Profile |
SEC
News |
Chart |
Request a new note
C
A
S
I |
SPSC
-
NASDAQ
SPS Commerce
Comp Sftwr-Spec Enterprs
|
$181.39
|
-4.36
-2.35% |
$188.10
|
208,963
105.54% of 50 DAV
50 DAV is 198,000
|
$196.39
-7.64%
|
4/24/2023
|
$150.01
|
PP = $157.56
|
|
MB = $165.44
|
Most Recent Note - 7/18/2023 6:01:40 PM
G - Posted a 6th consecutive gain today, getting very extended from the previously noted base. Due to report Jun '23 quarterly results on 7/27/23.
>>> FEATURED STOCK ARTICLE : Perched Near High Following Noted Volume-Driven Gains - 6/21/2023 |
View all notes |
Set NEW NOTE alert |
Company Profile |
SEC
News |
Chart |
Request a new note
C
A
S
I |
Symbol/Exchange
Company Name
Industry Group |
PRICE |
CHANGE
(%Change) |
Day High |
Volume
(% DAV)
(% 50 day avg vol) |
52 Wk Hi
% From Hi |
Featured
Date |
Price
Featured |
Pivot Featured |
|
Max Buy |
HUBB
-
NYSE
Hubbell
Electrical-Power/Equipmt
|
$333.74
|
-4.07
-1.20% |
$340.06
|
378,833
101.29% of 50 DAV
50 DAV is 374,000
|
$339.56
-1.71%
|
4/25/2023
|
$262.85
|
PP = $257.51
|
|
MB = $270.39
|
Most Recent Note - 7/20/2023 1:19:24 PM
G - Touched another new all-time high today. Very extended from the prior base. Its 50 DMA line ($307) defines initial support to watch on pullbacks. Fundamentals remain strong.
>>> FEATURED STOCK ARTICLE : Hubbell on Track for 11th Weekly Gain - 6/22/2023 |
View all notes |
Set NEW NOTE alert |
Company Profile |
SEC
News |
Chart |
Request a new note
C
A
S
I |
NVR
-
NYSE
NVR
Bldg-Resident/Comml
|
$6,246.40
|
+20.32
0.33% |
$6,309.97
|
10,671
46.40% of 50 DAV
50 DAV is 23,000
|
$6,474.53
-3.52%
|
4/25/2023
|
$5,882.18
|
PP = $5,978.25
|
|
MB = $6,277.16
|
Most Recent Note - 7/20/2023 1:13:57 PM
G - Due to report Jun '23 quarterly results. The Mar '23 quarter was noted as it raised fundamental concerns. Pulling back today undercutting its "max buy" level after recently wedging to a new all-time high. Its prior low ($6,009 on 7/06) and 50 DMA line ($5,984) define near-term support watch.
>>> FEATURED STOCK ARTICLE : New High Close for Strong Homebuilder - 6/30/2023 |
View all notes |
Set NEW NOTE alert |
Company Profile |
SEC
News |
Chart |
Request a new note
C
A
S
I |
PHM
-
NYSE
PulteGroup
Bldg-Resident/Comml
|
$78.08
|
+0.56
0.72% |
$78.80
|
1,848,340
67.19% of 50 DAV
50 DAV is 2,751,000
|
$82.97
-5.89%
|
4/25/2023
|
$65.17
|
PP = $64.01
|
|
MB = $67.21
|
Most Recent Note - 7/20/2023 12:57:08 PM
G - Gappped up and touched a new high but there was a quick "negative reversal" for a considerable loss with volume running at an above average pace. Very extended from any sound base. Reported earnings +28% for the Mar '23 quarter versus the year-ago period. Important support to watch is defined by its 50 DMA line ($73.20).
>>> FEATURED STOCK ARTICLE : Negative Reversal After Hitting Another New High - 6/26/2023 |
View all notes |
Set NEW NOTE alert |
Company Profile |
SEC
News |
Chart |
Request a new note
C
A
S
I |
AMPH
-
NASDAQ
Amphastar Pharm
Medical-Biomed/Biotech
|
$61.62
|
-1.63
-2.58% |
$63.60
|
587,496
124.73% of 50 DAV
50 DAV is 471,000
|
$63.72
-3.30%
|
5/15/2023
|
$43.56
|
PP = $44.15
|
|
MB = $46.36
|
Most Recent Note - 7/20/2023 5:12:29 PM
G - Posted a 6th consecutive gain. It did not form a sound base of sufficient length. Its 50 DMA line ($50.28) defines important support to watch above prior highs in the $44 area. Fundamentals remain strong. See the latest FSU analysis for more details and a new annotated graph.
>>> FEATURED STOCK ARTICLE : 6th Straight Gain for Amphastar - 7/20/2023 |
View all notes |
Set NEW NOTE alert |
Company Profile |
SEC
News |
Chart |
Request a new note
C
A
S
I |
ANET
-
NYSE
Arista Networks
Computer-Networking
|
$171.64
|
+0.23
0.13% |
$173.78
|
1,638,385
51.41% of 50 DAV
50 DAV is 3,187,000
|
$178.36
-3.77%
|
5/30/2023
|
$176.35
|
PP = $171.54
|
|
MB = $180.12
|
 Most Recent Note - 7/21/2023 4:58:40 PM
G - Posted another gain today with below-average volume, leaving it perched near prior highs. It faces little near-term resistance due to overhead supply up to the $178 level. Fundamentals remain strong. Its 50 DMA line ($157.59) defines near-term support above the prior low ($148.32).
>>> FEATURED STOCK ARTICLE : Wedging Higher After Rebounding Above 50-Day Moving Average - 7/12/2023 |
View all notes |
Set NEW NOTE alert |
Company Profile |
SEC
News |
Chart |
Request a new note
C
A
S
I |
Symbol/Exchange
Company Name
Industry Group |
PRICE |
CHANGE
(%Change) |
Day High |
Volume
(% DAV)
(% 50 day avg vol) |
52 Wk Hi
% From Hi |
Featured
Date |
Price
Featured |
Pivot Featured |
|
Max Buy |
PANW
-
NASDAQ
Palo Alto Networks
Computer Sftwr-Security
|
$243.82
|
+1.77
0.73% |
$246.39
|
5,380,783
80.99% of 50 DAV
50 DAV is 6,644,000
|
$258.88
-5.82%
|
6/5/2023
|
$228.35
|
PP = $213.73
|
|
MB = $224.42
|
Most Recent Note - 7/21/2023 5:00:53 PM
G - Posted a small gain today with average volume and it remains perched near its all-time high. Its 50 DMA line ($228) defines near-term support to watch. Fundamentals remain strong.
>>> FEATURED STOCK ARTICLE : Strength Continues for Network Security Leader - 6/27/2023 |
View all notes |
Set NEW NOTE alert |
Company Profile |
SEC
News |
Chart |
Request a new note
C
A
S
I |
LSCC
-
NASDAQ
Lattice Semiconductor
Elec-Semicondctor Fablss
|
$87.45
|
+1.42
1.65% |
$87.92
|
1,644,921
70.36% of 50 DAV
50 DAV is 2,338,000
|
$98.18
-10.93%
|
6/13/2023
|
$91.73
|
PP = $96.92
|
|
MB = $101.77
|
Most Recent Note - 7/20/2023 1:11:10 PM
Y - Gapped down today, abruptly pulling back after it quietly touched a new 52-week high on Tuesday. Its 50 DMA line ($87) defines near-term support to watch. Subsequent gains above the pivot point backed by at least +40% above average volume may trigger a technical buy signal. Due to report Jun '23 quarterly results on 7/31/23.
>>> FEATURED STOCK ARTICLE : Perched Near Pivot Point After Best-Ever Close - 7/17/2023 |
View all notes |
Set NEW NOTE alert |
Company Profile |
SEC
News |
Chart |
Request a new note
C
A
S
I |
XPEL
-
NASDAQ
XPEL
Auto/Truck-Replace Parts
|
$80.27
|
-1.63
-1.99% |
$82.68
|
119,387
89.76% of 50 DAV
50 DAV is 133,000
|
$87.46
-8.22%
|
6/28/2023
|
$83.14
|
PP = $87.11
|
|
MB = $91.47
|
Most Recent Note - 7/20/2023 1:25:43 PM
Y - Volume totals have been cooling while consolidating after hitting a new 52-week high with volume-driven gains last week. Perched near the pivot point cited based on its 8/15/23 high plus 10 cents. Reported Mar '23 quarterly earnings +46% on +19% sales revenues versus the year ago period, its 3rd quarterly comparison above the +25% minimum earnings guideline (C criteria), helping it better match the winning models of the fact-based investment system.
>>> FEATURED STOCK ARTICLE : XPEL Returns to Featured Stocks List After Long Consolidation - 6/28/2023 |
View all notes |
Set NEW NOTE alert |
Company Profile |
SEC
News |
Chart |
Request a new note
C
A
S
I |
FTNT
-
NASDAQ
Fortinet
Computer Sftwr-Security
|
$78.16
|
+0.46
0.59% |
$79.14
|
8,905,872
167.72% of 50 DAV
50 DAV is 5,310,000
|
$81.24
-3.79%
|
7/10/2023
|
$78.29
|
PP = $74.45
|
|
MB = $78.17
|
Most Recent Note - 7/18/2023 6:06:41 PM
G - Color code is changed to green after rising above its "max buy" level. It is perched at its all-time high, stubbornly holding its ground after recent gains. Fundamentals remain strong.
>>> FEATURED STOCK ARTICLE : Fortinet Powered to New All-Time High - 7/10/2023 |
View all notes |
Set NEW NOTE alert |
Company Profile |
SEC
News |
Chart |
Request a new note
C
A
S
I |
PII
-
NYSE
Polaris
Leisure-Products
|
$134.38
|
+0.08
0.06% |
$135.69
|
561,819
103.47% of 50 DAV
50 DAV is 543,000
|
$135.83
-1.07%
|
7/11/2023
|
$126.92
|
PP = $123.97
|
|
MB = $130.17
|
Most Recent Note - 7/18/2023 6:09:18 PM
G - Color code is changed to green after rallying above its "max buy" level with today's volume-driven gain adding to a recent spurt higher. On pullbacks, the prior highs define initial support to watch above its 50 DMA line.
>>> FEATURED STOCK ARTICLE : Volume-Driven Breakout for Polaris - 7/11/2023 |
View all notes |
Set NEW NOTE alert |
Company Profile |
SEC
News |
Chart |
Request a new note
C
A
S
I |
Symbol/Exchange
Company Name
Industry Group |
PRICE |
CHANGE
(%Change) |
Day High |
Volume
(% DAV)
(% 50 day avg vol) |
52 Wk Hi
% From Hi |
Featured
Date |
Price
Featured |
Pivot Featured |
|
Max Buy |
ALGM
-
NASDAQ
Allegro MicroSystems
Elec-Semicondctor Fablss
|
$49.55
|
-0.08
-0.16% |
$50.65
|
1,857,667
123.52% of 50 DAV
50 DAV is 1,504,000
|
$53.05
-6.60%
|
7/13/2023
|
$49.86
|
PP = $48.82
|
|
MB = $51.26
|
Most Recent Note - 7/20/2023 1:16:00 PM
Y - Gapped down today, pulling back from its all-time high. Prior high in the $48 area defines initial support to watch. It was highlighted in yellow with pivot point cited based on its 4/03/23 high plus 10 cents in the 7/13/23 mid-day report.
>>> FEATURED STOCK ARTICLE : Volume Heavy Behind Considerable Breakout Gain - 7/13/2023 |
View all notes |
Set NEW NOTE alert |
Company Profile |
SEC
News |
Chart |
Request a new note
C
A
S
I |
ESQ
-
NASDAQ
Esquire Finl Hldgs
Finance-Commercial Loans
|
$48.92
|
+0.26
0.53% |
$49.38
|
16,831
58.04% of 50 DAV
50 DAV is 29,000
|
$49.29
-0.75%
|
7/14/2023
|
$45.80
|
PP = $48.23
|
|
MB = $50.64
|
Most Recent Note - 7/21/2023 4:59:26 PM
Y - Posted a small gain with light volume today inching to a new 52-week high. Subsequent gains above the pivot point backed by at least +40% above average volume are needed to trigger a proper technical buy signal.
>>> FEATURED STOCK ARTICLE : Esquire Perched Near Prior Highs - 7/14/2023 |
View all notes |
Set NEW NOTE alert |
Company Profile |
SEC
News |
Chart |
Request a new note
C
A
S
I |
|
|
|
THESE ARE NOT BUY RECOMMENDATIONS!
Comments contained in the body of this report are technical
opinions only. The material herein has been obtained
from sources believed to be reliable and accurate, however,
its accuracy and completeness cannot be guaranteed.
This site is not an investment advisor, hence it does
not endorse or recommend any securities or other investments.
Any recommendation contained in this report may not
be suitable for all investors and it is not to be deemed
an offer or solicitation on our part with respect to
the purchase or sale of any securities. All trademarks,
service marks and trade names appearing in this report
are the property of their respective owners, and are
likewise used for identification purposes only.
This report is a service available
only to active Paid Premium Members.
You may opt-out of receiving report notifications
at any time. Questions or comments may be submitted
by writing to Premium Membership Services 665 S.E. 10 Street, Suite 201 Deerfield Beach, FL 33441-5634 or by calling 1-800-965-8307
or 954-785-1121.
|
|
|