You are not logged in.
This means you
CAN ONLY VIEW reports that were published prior to Friday, February 7, 2025.
You
MUST UPGRADE YOUR MEMBERSHIP if you want to see any current reports.
AFTER MARKET UPDATE - FRIDAY, MAY 5TH, 2023
Previous After Market Report Next After Market Report >>>
|
|
|
|
DOW |
+546.64 |
33,674.38 |
+1.65% |
|
Volume |
933,125,261 |
-13% |
|
Volume |
4,644,500,900 |
-3% |
|
NASDAQ |
+269.01 |
12,235.41 |
+2.25% |
|
Advancers |
2,488 |
85% |
|
Advancers |
3,224 |
73% |
|
S&P 500 |
+75.03 |
4,136.25 |
+1.85% |
|
Decliners |
423 |
15% |
|
Decliners |
1,187 |
27% |
|
Russell 2000 |
+41.07 |
1,759.88 |
+2.39% |
|
52 Wk Highs |
45 |
|
|
52 Wk Highs |
99 |
|
|
S&P 600 |
+26.52 |
1,138.97 |
+2.38% |
|
52 Wk Lows |
47 |
|
|
52 Wk Lows |
135 |
|
|
 |
Market Rebounded With Lighter Volume Totals
Kenneth J. Gruneisen - Passed the CAN SLIM® Master's Exam
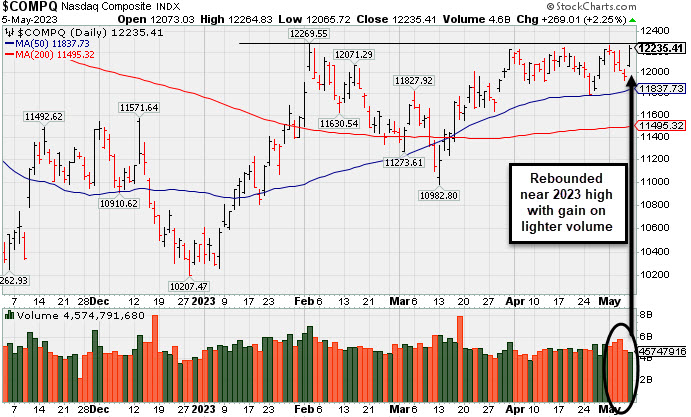
Friday the Dow climbed 546 points (1.7%), while the Nasdaq Composite added 2.3% and S&P 500 advanced 1.9%. For the week, the S&P 500 and Dow finished lower, while the Nasdaq Composite notched a weekly gain. Volume totals reported were lighter on the NYSE and on the Nasdaq exchange. Advancers led decliners by almost a 6-1 margin on the NYSE and by almost a 3-1 margin on the Nasdaq exchange. There were 30 high-ranked companies from the Leaders List that hit a new 52-week high and were listed on the BreakOuts Page, versus the total of 29 on the prior session. New 52-week lows narrowly outnumbered new highs on the NYSE and led by a larger margin on the Nasdaq exchange.The major indices are in an uptrend under pressure (M criteria). Appropriate new buying efforts may be considered under the fact-based investment system.
PICTURED: The Nasdaq Composite Index quickly rebounded near its 2023 high with a gain backed by lighter volume breaking a 4-day losing streak.
All sectors finished in positive territory on Friday as investors digested better-than-expected quarterly earnings from Apple Inc (AAPL +4.69%) . The technology giant beat top- and bottom-line estimates in the latest quarter amid a jump in iPhone sales. Regional bank shares also rallied today after being under pressure this week due to concerns about the health of the Financials sector.
On the data front today, the U.S. added 253,000 nonfarm payrolls in April, up from March’s revised 165,00 jobs, amid gains in healthcare and education jobs. The unemployment rate ticked lower to 3.4%, matching the lowest reading since 1969. Average hourly earnings rose 0.5% month-over-month, the biggest increase in wages since July, and 4.4% year-over-year. The labor force participation rate came in at 62.6%, unchanged from March’s data. Treasuries weakened, with the yield on the benchmark 10-year note up seven basis points (0.07%) to 3.43%, while the 30-year bond yield climbed three basis points (0.03%) to 3.75%. The yield on the two-year note, which is more sensitive to changes in monetary policy, advanced 15 basis points (0.15%) to 3.91%. In commodities, West Texas Intermediate (WTI) crude jumped 4.1% to $71.38/barrel but still finished the week lower amid concerns over the course of monetary policy and the global demand outlook. |
 Kenneth J. Gruneisen started out as a licensed stockbroker in August 1987, a couple of months prior to the historic stock market crash that took the Dow Jones Industrial Average down -22.6% in a single day. He has published daily fact-based fundamental and technical analysis on high-ranked stocks online for two decades. Through FACTBASEDINVESTING.COM, Kenneth provides educational articles, news, market commentary, and other information regarding proven investment systems that work in good times and bad.
Comments contained in the body of this report are technical opinions only and are not necessarily those of Gruneisen Growth Corp. The material herein has been obtained from sources believed to be reliable and accurate, however, its accuracy and completeness cannot be guaranteed. Our firm, employees, and customers may effect transactions, including transactions contrary to any recommendation herein, or have positions in the securities mentioned herein or options with respect thereto. Any recommendation contained in this report may not be suitable for all investors and it is not to be deemed an offer or solicitation on our part with respect to the purchase or sale of any securities. |
|
 |
Financial, Tech, and Energy-Linked Groups Led Gainers
Kenneth J. Gruneisen - Passed the CAN SLIM® Master's Exam
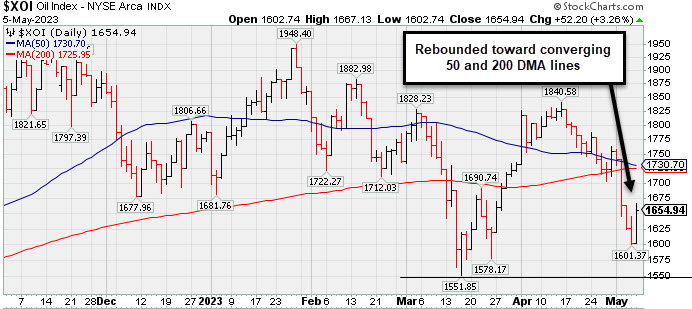
Finanicals rebounded on Friday with the Bank Index ($BKX +4.61%) and Broker/Dealer Index ($XBD +3.87%) both posting standout gains. The Retail Index ($RLX +1.53%) also noted a solid gain. The tech sector had a positive bias as the Semiconductor Index ($SOX +2.25%) and Biotech Index ($BTK +1.30%) bothn outpaced the Networking Index ($NWX +0.64%). The Oil Services Index ($OSX +2.93%) and Integrated Oil Index ($XOI +3.26%) both posted solid gains while rebounding form a steep 4-day pullback. The Gold & Silver Index ($XAU -0.37) ended slightly lower.
PICTURED: The Integrated Oil Index ($XOI +3.26%) has been slumping toward its March low, but Friday's solid gain helped it rebound toward its converging 50-day and 200-day moving average (DMA) lines.
| Oil Services |
$OSX |
74.91 |
+2.14 |
+2.93% |
-10.67% |
| Integrated Oil |
$XOI |
1,654.94 |
+52.20 |
+3.26% |
-7.40% |
| Semiconductor |
$SOX |
3,007.69 |
+66.06 |
+2.25% |
+18.78% |
| Networking |
$NWX |
738.32 |
+4.73 |
+0.64% |
-5.74% |
| Broker/Dealer |
$XBD |
433.54 |
+16.17 |
+3.87% |
-3.47% |
| Retail |
$RLX |
3,037.14 |
+45.66 |
+1.53% |
+10.28% |
| Gold & Silver |
$XAU |
140.59 |
-0.52 |
-0.37% |
+16.33% |
| Bank |
$BKX |
75.27 |
+3.32 |
+4.61% |
-25.36% |
| Biotech |
$BTK |
5,309.76 |
+68.13 |
+1.30% |
+0.54% |
|
|
|
 |
Featured Stocks
Kenneth J. Gruneisen - Passed the CAN SLIM® Master's Exam
|
|
|
Color Codes Explained :
Y - Better candidates highlighted by our
staff of experts.
G - Previously featured
in past reports as yellow but may no longer be buyable under the
guidelines.
***Last / Change / Volume data in this table is the closing quote data***
Symbol/Exchange
Company Name
Industry Group |
PRICE |
CHANGE
(%Change) |
Day High |
Volume
(% DAV)
(% 50 day avg vol) |
52 Wk Hi
% From Hi |
Featured
Date |
Price
Featured |
Pivot Featured |
|
Max Buy |
 GPK
-
NYSE
GPK
-
NYSE
Graphic Packaging
CONSUMER NON-DURABLES - Packaging and Containers
|
$25.70
|
+0.50
1.98% |
$25.86
|
2,050,669
66.36% of 50 DAV
50 DAV is 3,090,000
|
$26.11
-1.57%
|
10/25/2022
|
$22.75
|
PP = $24.17
|
|
MB = $25.38
|
Most Recent Note - 5/2/2023 12:35:36 PM
Y - Gapped up today then reversed into the red. Reported Mar '23 quarterly earnings +60% versus the year-ago period. Volume and volatility often increase near earnings news. Rebounded above its 50 DMA line ($24.41) last week helping its outlook improve. It is perched just -4.8% below its all-time high. Recent gains lacked great volume conviction. See the latest FSU analysis for more details and a new annotated graph.
>>> FEATURED STOCK ARTICLE : Packaging Firm Due to Report Earnings News - 5/1/2023 |
View all notes |
Set NEW NOTE alert |
Company Profile |
SEC
News |
Chart |
Request a new note
C
A
S
I |
STRL
-
NASDAQ
Sterling Infrastructure
MATERIALS and; CONSTRUCTION - Heavy Construction
|
$42.74
|
+2.11
5.19% |
$42.83
|
267,699
103.76% of 50 DAV
50 DAV is 258,000
|
$43.05
-0.72%
|
12/14/2022
|
$32.41
|
PP = $33.72
|
|
MB = $35.41
|
Most Recent Note - 5/4/2023 6:11:46 PM
G - Pulled back today after hitting a new all-time high with 5 consecutive gains backed by ever-increasing volume. Rebound above the 50 DMA line ($38) this week helped its technical stance improve. Reported Mar '23 quarterly earnings +0% on +10% sales revenues versus the year-ago period, below the +25% minimum earnings guideline (C criteria) raising fundamental concerns. Volume and volatility often increase near earnings news.
>>> FEATURED STOCK ARTICLE : 50-Day Moving Average Line Acted as Recent Resistance - 4/28/2023 |
View all notes |
Set NEW NOTE alert |
Company Profile |
SEC
News |
Chart |
Request a new note
C
A
S
I |
FIX
-
NYSE
Comfort Systems USA
MATERIALS and CONSTRUCTION - General Contractors
|
$151.87
|
+3.88
2.62% |
$154.15
|
464,654
148.93% of 50 DAV
50 DAV is 312,000
|
$153.90
-1.32%
|
4/27/2023
|
$148.85
|
PP = $152.23
|
|
MB = $159.84
|
 Most Recent Note - 5/5/2023 1:16:23 PM
Y - Hitting a new high with today's volume-driven gain. Previously noted - "Bullish action came after it reported Mar '23 quarterly earnings +66% on +33% sales revenues versus the year-ago period. Powered above its 50 DMA line ($140.70) with a considerable gain backed by twice its average volume. Its color code was changed to yellow with pivot point cited based on its 3/03/23 high plus 10 cents. Very little resistance remains due to overhead supply up to the $152 level. A gain and new high backed by at least +40% above average volume may trigger a technical buy signal."
>>> FEATURED STOCK ARTICLE : Consolidating Near 50-Day Moving Average and -10.5% off High - 4/21/2023 |
View all notes |
Set NEW NOTE alert |
Company Profile |
SEC
News |
Chart |
Request a new note
C
A
S
I |
KOF
-
NYSE
Coca-Cola Femsa ADR
FOOD and BEVERAGE - Beverages - Soft Drinks
|
$88.48
|
+1.51
1.74% |
$89.04
|
201,204
104.79% of 50 DAV
50 DAV is 192,000
|
$87.00
1.70%
|
3/7/2023
|
$76.63
|
PP = $77.11
|
|
MB = $80.97
|
Most Recent Note - 5/2/2023 6:32:12 PM
G - Rebounded near its all-time high with today's gain backed by near-average volume. Reported Mar '23 quarterly earnings +53% on +24% sales revenues versus the year-ago period. On pullbacks, prior highs in the $79-$77 area define initial support to watch along with its 50 DMA line ($78.88). See the latest FSU analysis for more details and a new annotated graph.
>>> FEATURED STOCK ARTICLE : Posted Gain Afrer Reporting Strong Mar '23 Quarterly Results - 5/2/2023 |
View all notes |
Set NEW NOTE alert |
Company Profile |
SEC
News |
Chart |
Request a new note
C
A
S
I |
CLH
-
NYSE
Clean Harbors
Pollution Control
|
$135.70
|
-0.84
-0.62% |
$138.13
|
481,254
105.08% of 50 DAV
50 DAV is 458,000
|
$147.76
-8.16%
|
3/10/2023
|
$136.89
|
PP = $136.74
|
|
MB = $143.58
|
Most Recent Note - 5/3/2023 12:20:17 PM
G - Reported Mar '23 quarterly earnings +64% versus the year-ago period. Volume and volatility often increase near earnings news. Recovered a lot after early weakness today violated its 50 DMA line ($137.67) with a big loss triggering a technical sell signal. Recently wedged up above its "max buy" level with gains backed by lackluster volume, not action considered indicative of fresh institutional buying demand. Fundamentals remain strong.
>>> FEATURED STOCK ARTICLE : Wedged to a New High Close Above "Max Buy" Level - 4/19/2023 |
View all notes |
Set NEW NOTE alert |
Company Profile |
SEC
News |
Chart |
Request a new note
C
A
S
I |
Symbol/Exchange
Company Name
Industry Group |
PRICE |
CHANGE
(%Change) |
Day High |
Volume
(% DAV)
(% 50 day avg vol) |
52 Wk Hi
% From Hi |
Featured
Date |
Price
Featured |
Pivot Featured |
|
Max Buy |
MTRN
-
NYSE
Materion
METALS and MINING - Industrial Metals and Minerals
|
$106.52
|
+0.15
0.14% |
$108.78
|
92,369
86.33% of 50 DAV
50 DAV is 107,000
|
$121.29
-12.18%
|
4/18/2023
|
$114.52
|
PP = $118.30
|
|
MB = $124.22
|
Most Recent Note - 5/4/2023 6:02:02 PM
G - Abruptly retreated today for damaging loss with above average volume as it again violated its 50 DMA line ($111) raising concerns, and its color code is changed to green. Disciplined investors may note that on the prior session it did not quite produce a gain and a strong close above the pivot point backed by at least +40% above average volume to trigger a proper technical buy signal. Reported Mar '23 quarterly earnings +13% versus the year-ago period, below the +25% minimum guideline (C criteria) raising fundamental concerns. Volume and volatility often increase near earnings news.
>>> FEATURED STOCK ARTICLE : Encountered Distributional Pressure When Poised for Breakout - 4/18/2023 |
View all notes |
Set NEW NOTE alert |
Company Profile |
SEC
News |
Chart |
Request a new note
C
A
S
I |
SPSC
-
NASDAQ
SPS Commerce
COMPUTER SOFTWARE and SERVICES - Application Software
|
$150.39
|
+1.39
0.93% |
$152.74
|
113,473
75.15% of 50 DAV
50 DAV is 151,000
|
$157.46
-4.49%
|
4/24/2023
|
$150.01
|
PP = $157.56
|
|
MB = $165.44
|
Most Recent Note - 5/4/2023 6:10:28 PM
Y - Although it pulled back today with lighter volume, its color code is changed to yellow after rebounding above its 50 DMA line ($148.35) which had acted as resistance. Subsequent gains above the pivot point backed by at least +40% above average volume may trigger a technical buy signal. Reported Mar '23 quarterly earnings +22% on +20% versus the year-ago period, below the +25% minimum earnings guideline (C criteria) raising some fundamental concerns. Volume and volatility often increase near earnings news.
>>> FEATURED STOCK ARTICLE : Sputtered While Perched in Striking Distance of 52-Week HIgh - 4/24/2023 |
View all notes |
Set NEW NOTE alert |
Company Profile |
SEC
News |
Chart |
Request a new note
C
A
S
I |
HUBB
-
NYSE
Hubbell
Electrical-Power/Equipmt
|
$272.09
|
+2.58
0.96% |
$273.91
|
321,609
79.02% of 50 DAV
50 DAV is 407,000
|
$282.19
-3.58%
|
4/25/2023
|
$262.85
|
PP = $257.51
|
|
MB = $270.39
|
Most Recent Note - 5/2/2023 6:29:36 PM
G - Posted a 7th consecutive gain today hitting a new high above its "max buy" level with volume +73% above average and its color code is changed to green. Bullish action came after its strong Mar '23 quarterly results. Prior highs in the $263 area define initial support to watch on pullbacks.
>>> FEATURED STOCK ARTICLE : Gap Up Following Earnings Triggered Technical Buy Signal - 4/25/2023 |
View all notes |
Set NEW NOTE alert |
Company Profile |
SEC
News |
Chart |
Request a new note
C
A
S
I |
NVR
-
NYSE
NVR Inc
MATERIALS and CONSTRUCTION - Residential Construction
|
$5,852.47
|
+51.12
0.88% |
$5,879.25
|
19,005
82.63% of 50 DAV
50 DAV is 23,000
|
$5,986.96
-2.25%
|
4/25/2023
|
$5,882.18
|
PP = $5,978.25
|
|
MB = $6,277.16
|
Most Recent Note - 5/3/2023 10:08:59 AM
G - Still perched near its all-time high with today's 5th consecutive gain. Reported Mar '23 quarterly earnings -14% on -3% sales revenues versus the year-ago period, below the +25% minimum earnings guideline (C criteria) raising fundamental concerns, and its color code was changed to green. Confirming gains and a close above the pivot point backed by at least +40% above average volume may clinch a proper technical buy signal. Prior quarterly comparisons were well above the +25% minimum earnings guideline (C criteria). Annual earnings (A criteria) growth has been very strong.
>>> FEATURED STOCK ARTICLE : Fell From High and Raised Concern With Subpar Mar '23 Report - 4/27/2023 |
View all notes |
Set NEW NOTE alert |
Company Profile |
SEC
News |
Chart |
Request a new note
C
A
S
I |
PHM
-
NYSE
PulteGroup
MATERIALS and CONSTRUCTION - Residential Construction
|
$67.02
|
+0.65
0.98% |
$67.22
|
2,454,658
82.18% of 50 DAV
50 DAV is 2,987,000
|
$67.40
-0.56%
|
4/25/2023
|
$65.17
|
PP = $64.01
|
|
MB = $67.21
|
Most Recent Note - 5/3/2023 10:07:19 AM
Y - Churning above-average volume for the past week yet it remains perched near its all-time high and "max buy" level. Highlighted in yellow with pivot point cited based on its May 2021 high in the 4/25/23 mid-day report. Bullish action came after it reported earnings +28% for the Mar '23 quarter versus the year-ago period. Prior highs in the $64-60 area define initial support to watch above its 50 DMA line ($58.26).
>>> FEATURED STOCK ARTICLE : Recently Rallying to New All-Time Highs - 4/26/2023 |
View all notes |
Set NEW NOTE alert |
Company Profile |
SEC
News |
Chart |
Request a new note
C
A
S
I |
Symbol/Exchange
Company Name
Industry Group |
PRICE |
CHANGE
(%Change) |
Day High |
Volume
(% DAV)
(% 50 day avg vol) |
52 Wk Hi
% From Hi |
Featured
Date |
Price
Featured |
Pivot Featured |
|
Max Buy |
COKE
-
NASDAQ
Coca-Cola Consolidated
FOOD and BEVERAGE - Beverages - Soft Drinks
|
$655.84
|
-1.85
-0.28% |
$670.91
|
71,997
199.99% of 50 DAV
50 DAV is 36,000
|
$694.20
-5.53%
|
5/4/2023
|
$646.66
|
PP = $656.21
|
|
MB = $689.02
|
Most Recent Note - 5/4/2023 5:54:08 PM
Y - Posted a solid gain backed by +128% above average volume and closed above the new pivot point cited based on its 6/07/22 high plus 10 cents, triggering a technical buy signal. Bullish action came after it reported Mar '23 quarterly earnings +93% on +12% sales revenues versus the year-ago period, continuing its strong earnings track record. Went through a deep consolidation since dropped from the Featured Stocks list when noted on 6/16/22. Abruptly stalled and encountered distributional pressure after hitting a new high. See the latest FSU analysis for more details and a new annotated graph.
>>> FEATURED STOCK ARTICLE : COKE is Showing Real Strength - 5/4/2023 |
View all notes |
Set NEW NOTE alert |
Company Profile |
SEC
News |
Chart |
Request a new note
C
A
S
I |
|
|
|
THESE ARE NOT BUY RECOMMENDATIONS!
Comments contained in the body of this report are technical
opinions only. The material herein has been obtained
from sources believed to be reliable and accurate, however,
its accuracy and completeness cannot be guaranteed.
This site is not an investment advisor, hence it does
not endorse or recommend any securities or other investments.
Any recommendation contained in this report may not
be suitable for all investors and it is not to be deemed
an offer or solicitation on our part with respect to
the purchase or sale of any securities. All trademarks,
service marks and trade names appearing in this report
are the property of their respective owners, and are
likewise used for identification purposes only.
This report is a service available
only to active Paid Premium Members.
You may opt-out of receiving report notifications
at any time. Questions or comments may be submitted
by writing to Premium Membership Services 665 S.E. 10 Street, Suite 201 Deerfield Beach, FL 33441-5634 or by calling 1-800-965-8307
or 954-785-1121.
|
|
|