You are not logged in.
This means you
CAN ONLY VIEW reports that were published prior to Thursday, March 20, 2025.
You
MUST UPGRADE YOUR MEMBERSHIP if you want to see any current reports.
AFTER MARKET UPDATE - MONDAY, APRIL 17TH, 2023
Previous After Market Report Next After Market Report >>>
|
|
|
|
DOW |
+100.71 |
33,987.18 |
+0.30% |
|
Volume |
812,085,515 |
+2% |
|
Volume |
4,814,889,000 |
+4% |
|
NASDAQ |
+34.26 |
12,157.72 |
+0.28% |
|
Advancers |
1,762 |
61% |
|
Advancers |
2,698 |
60% |
|
S&P 500 |
+13.68 |
4,151.32 |
+0.33% |
|
Decliners |
1,149 |
39% |
|
Decliners |
1,761 |
39% |
|
Russell 2000 |
+21.68 |
1,802.84 |
+1.22% |
|
52 Wk Highs |
53 |
|
|
52 Wk Highs |
82 |
|
|
S&P 600 |
+6.91 |
1,170.62 |
+0.59% |
|
52 Wk Lows |
39 |
|
|
52 Wk Lows |
172 |
|
|
 |
Major Indice Posted Small Gains With Slighly Higher Volume Totals
Kenneth J. Gruneisen - Passed the CAN SLIM® Master's Exam
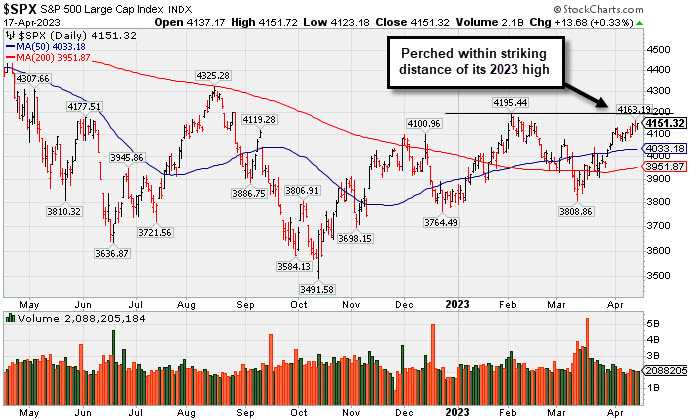
The Dow climbed 100 points (0.3%), while the Nasdaq Composite and S&P 500 Index also rose 0.3%. Volume totals reported were higher than the prior session on the NYSE and on the Nasdaq exchange, hinting at a slight uptick in institutional buying demand. Breadth was positive as advancers led decliners by a 3-2 margin on the NYSE and on the Nasdaq exchange. There were 34 high-ranked companies from the Leaders Listthat hit a new 52-week high and were listed on the BreakOuts Page, versus the total of 31 on the prior session. New 52-week highs outnumbered new 52-week lows on the NYSE but new lows still solidly outnumbered new highs on the Nasdaq exchange.The major indices are in a confirmed uptrend (M criteria). Appropriate new buying efforts may be considered under the fact-based investment system.
PICTURED: The S&P 500 Index is perched withing striking distance of its February 2023 high.
Eight of 11 sectors finished in positive territory as U.S. equities finished higher Monday. Investors assessed the future course of interest rate hikes and digested a batch of first-quarter corporate earnings. In earnings, Charles Schwab Corp. (SCHW +3.94%) topped analysts’ expectations for profit and noted first-quarter net income rose 14% from a year earlier. Revenue climbed 10%, coming in just below analyst forecasts. The company also reported a 30% decline in deposits compared to a year ago and announced it is pausing its stock buyback program.
On the data front, the New York Federal Reserve (Fed) Manufacturing Activity Index came in at 10.8 in April to move into expansionary territory for the first time in five months. The report cited a bounce in new orders and shipments as the reason for the much-improved print. Meanwhile, the National Association of Home Builders (NAHB) Housing Market Index came in at 45 in April, in-line with estimates and a tick higher than March’s 44 print. It was the fourth-straight month of increases, and the report noted demand for new homes is climbing as people are optimistic the real estate market is potentially recovering. Treasuries weakened, with the yield on the 10-year note climbing nine basis points (0.09%) to 3.60%, while the 30-year bond yield gained eight basis points (0.08%) to 3.81%. The yield on the two-year note advanced ten basis points (0.10%) to 4.19%. In commodities, West Texas Intermediate (WTI) crude fell 1.9% to $80.97/barrel as investors await key economic data from China.
|
 Kenneth J. Gruneisen started out as a licensed stockbroker in August 1987, a couple of months prior to the historic stock market crash that took the Dow Jones Industrial Average down -22.6% in a single day. He has published daily fact-based fundamental and technical analysis on high-ranked stocks online for two decades. Through FACTBASEDINVESTING.COM, Kenneth provides educational articles, news, market commentary, and other information regarding proven investment systems that work in good times and bad.
Comments contained in the body of this report are technical opinions only and are not necessarily those of Gruneisen Growth Corp. The material herein has been obtained from sources believed to be reliable and accurate, however, its accuracy and completeness cannot be guaranteed. Our firm, employees, and customers may effect transactions, including transactions contrary to any recommendation herein, or have positions in the securities mentioned herein or options with respect thereto. Any recommendation contained in this report may not be suitable for all investors and it is not to be deemed an offer or solicitation on our part with respect to the purchase or sale of any securities. |
|
 |
Financial, Retail, and Biotech Indexes Rose
Kenneth J. Gruneisen - Passed the CAN SLIM® Master's Exam
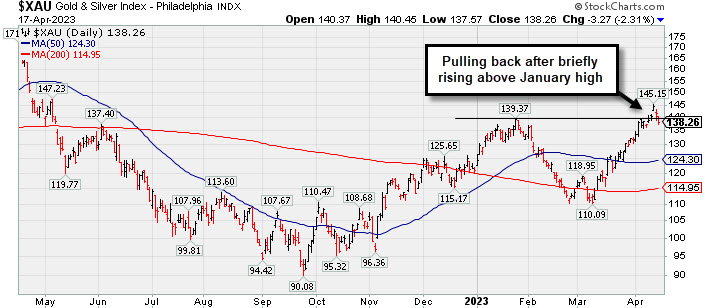
Gains from the Bank Index ($BKX +1.40%), Broker/Dealer Index ($XBD +0.84%), and Retail Index ($RLX +0.53%) had a positive influence on the major averages. The Biotech Index ($BTK +0.90%) posted a gain but the Semiconductor Index ($SOX -0.12%) inched lower and the Networking Index ($NWX -1.10%) slumped. Commodity-liniked groups had a negative bias as the Gold & Silver Index ($XAU -2.31%) outpaced the Integrated Oil Index ($XOI -1.55%) and the Oil Services Index ($OSX -0.73%) to the downside.
PICTURED: The Gold & Silver Index ($XAU -2.31%) is pulling back after briefly roising above its January high.
| Oil Services |
$OSX |
82.29 |
-0.60 |
-0.73% |
-1.87% |
| Integrated Oil |
$XOI |
1,800.75 |
-28.28 |
-1.55% |
+0.76% |
| Semiconductor |
$SOX |
3,066.68 |
-3.77 |
-0.12% |
+21.11% |
| Networking |
$NWX |
816.46 |
-9.10 |
-1.10% |
+4.23% |
| Broker/Dealer |
$XBD |
459.19 |
+3.84 |
+0.84% |
+2.24% |
| Retail |
$RLX |
2,994.50 |
+15.68 |
+0.53% |
+8.73% |
| Gold & Silver |
$XAU |
138.26 |
-3.27 |
-2.31% |
+14.40% |
| Bank |
$BKX |
84.14 |
+1.16 |
+1.40% |
-16.57% |
| Biotech |
$BTK |
5,439.71 |
+48.27 |
+0.90% |
+3.00% |
|
|
|
 |
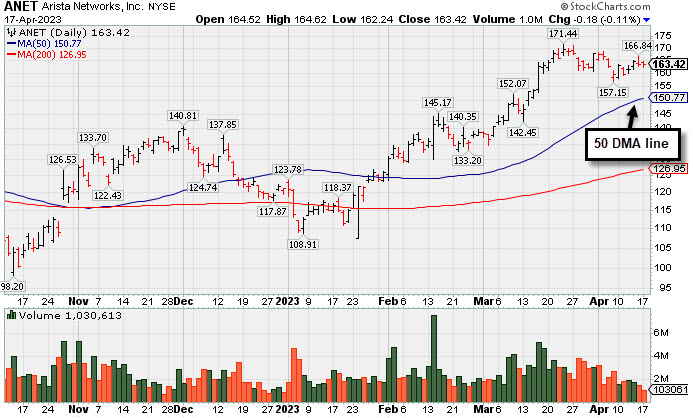
Near High With Volume Cooling Following Volume-Driven Gains
Kenneth J. Gruneisen - Passed the CAN SLIM® Master's Exam
Arista Networks Inc (ANET -$0.18 or -0.11% to $163.42) pulled back for a 2nd small loss today with below-average volume. Volume totals have been cooling, meanwhile it is hovering just -4.7% off its high. It is extended from any sound base after an impressive spurt of volume-driven gains. Prior highs in the $148-145 area define important support to watch along with its 50 DMA line ($149.51).
ANET currently has a 98 Earnings Per Share Rating. It reported Dec '22 quarterly earnings +72% on +55% sales revenues versus the year ago period, its 5th quarterly comparison strong and steady above the +25% minimum earnings guideline (C criteria). Annual earnings had a downturn in FY 20 like many during the pandemic.
The number of top-rated funds owning its shares rose from 1,758 in Dec '21 to 2,107 in Mar '23, a reassuring sign concerning the I criteria. Its current Up/Down Volume Ratio of 1.8 is an unbiased indication its shares have been under accumulation over the past 50 days. The high-ranked Computer - Networking firm has a Timeliness Rating of A and a Sponsorship Rating of C. Its small supply of 245.1 million shares (S criteria) in the public float may contribute to greater volatility in the event of institutional buying or selling.
|
|
|
Color Codes Explained :
Y - Better candidates highlighted by our
staff of experts.
G - Previously featured
in past reports as yellow but may no longer be buyable under the
guidelines.
***Last / Change / Volume data in this table is the closing quote data***
Symbol/Exchange
Company Name
Industry Group |
PRICE |
CHANGE
(%Change) |
Day High |
Volume
(% DAV)
(% 50 day avg vol) |
52 Wk Hi
% From Hi |
Featured
Date |
Price
Featured |
Pivot Featured |
|
Max Buy |
 GPK
-
NYSE
GPK
-
NYSE
Graphic Packaging
CONSUMER NON-DURABLES - Packaging and Containers
|
$24.91
|
+0.15
0.61% |
$24.93
|
1,877,418
59.49% of 50 DAV
50 DAV is 3,156,000
|
$25.62
-2.77%
|
10/25/2022
|
$22.75
|
PP = $24.17
|
|
MB = $25.38
|
 Most Recent Note - 4/17/2023 3:47:51 PM
Y - Volume totals have been near average or lighter than average while consolidating below its "max buy" level and just -3% below its all-time high. Recent gains lacked great volume conviction. Its 50 DMA line ($24.16) and recent low ($22.99 on 3/16/23) define important near-term support to watch.
>>> FEATURED STOCK ARTICLE : Quietly Consolidating Just Below "Max Buy" Level - 4/10/2023 |
View all notes |
Set NEW NOTE alert |
Company Profile |
SEC
News |
Chart |
Request a new note
C
A
S
I |
STRL
-
NASDAQ
Sterling Infrastructure
MATERIALS and; CONSTRUCTION - Heavy Construction
|
$37.38
|
+0.66
1.80% |
$37.48
|
161,939
63.51% of 50 DAV
50 DAV is 255,000
|
$42.00
-11.00%
|
12/14/2022
|
$32.41
|
PP = $33.72
|
|
MB = $35.41
|
Most Recent Note - 4/14/2023 3:59:44 PM
G - Posting a 5th consecutive gain today with below-average volume. A rebound above the 50 DMA line ($37.72) is needed for its outlook to improve.
>>> FEATURED STOCK ARTICLE : Volume-Driven 50-Day Moving Average Violation Triggered Sell Signal - 4/5/2023 |
View all notes |
Set NEW NOTE alert |
Company Profile |
SEC
News |
Chart |
Request a new note
C
A
S
I |
PERI
-
NASDAQ
Perion Network
Comml Svcs-Advertising
|
$41.85
|
+1.59
3.95% |
$42.75
|
981,381
127.95% of 50 DAV
50 DAV is 767,000
|
$42.04
-0.45%
|
1/25/2023
|
$31.79
|
PP = $33.19
|
|
MB = $34.85
|
Most Recent Note - 4/17/2023 12:21:08 PM
G - Hitting another new all-time high with today's 3rd consecutive gain. Its 50 DMA line ($36) defines important near-term support to watch.
>>> FEATURED STOCK ARTICLE : Hit Another New High With Gain Backed by Light Volume - 3/31/2023 |
View all notes |
Set NEW NOTE alert |
Company Profile |
SEC
News |
Chart |
Request a new note
C
A
S
I |
ALGM
-
NASDAQ
Allegro MicroSystems
Elec-Semiconductor Mfg
|
$43.36
|
-1.68
-3.73% |
$45.26
|
1,920,891
129.88% of 50 DAV
50 DAV is 1,479,000
|
$48.72
-11.00%
|
1/31/2023
|
$37.80
|
PP = $38.38
|
|
MB = $40.30
|
Most Recent Note - 4/17/2023 12:14:24 PM
G - Violating its 50 DMA line ($44.80) with today's damaging loss raising concerns and triggering a technical sell signal. Only a prompt rebound above the 50 DMA line would help its outlook improve.
>>> FEATURED STOCK ARTICLE : Consolidating Near 50 DMA Line After Recent Rally - 4/11/2023 |
View all notes |
Set NEW NOTE alert |
Company Profile |
SEC
News |
Chart |
Request a new note
C
A
S
I |
FIX
-
NYSE
Comfort Systems USA
MATERIALS and CONSTRUCTION - General Contractors
|
$132.46
|
+1.48
1.13% |
$133.44
|
118,267
41.50% of 50 DAV
50 DAV is 285,000
|
$152.13
-12.93%
|
2/23/2023
|
$136.52
|
PP = $128.78
|
|
MB = $135.22
|
Most Recent Note - 4/14/2023 3:58:23 PM
G - Volume totals have been cooling while still sputtering above prior highs in the $128 area which are acting as support. Only a prompt rebound above the 50 DMA line ($135.36) would help its outlook improve. Fundamentals remain strong.
>>> FEATURED STOCK ARTICLE : Pullback With Higher Volume While Consolidating - 4/4/2023 |
View all notes |
Set NEW NOTE alert |
Company Profile |
SEC
News |
Chart |
Request a new note
C
A
S
I |
Symbol/Exchange
Company Name
Industry Group |
PRICE |
CHANGE
(%Change) |
Day High |
Volume
(% DAV)
(% 50 day avg vol) |
52 Wk Hi
% From Hi |
Featured
Date |
Price
Featured |
Pivot Featured |
|
Max Buy |
KOF
-
NYSE
Coca-Cola Femsa ADR
FOOD and BEVERAGE - Beverages - Soft Drinks
|
$83.51
|
-0.13
-0.16% |
$84.57
|
315,260
174.18% of 50 DAV
50 DAV is 181,000
|
$84.55
-1.23%
|
3/7/2023
|
$76.63
|
PP = $77.11
|
|
MB = $80.97
|
Most Recent Note - 4/17/2023 3:43:23 PM
G - Hovering at its all-time high following a noted streak of 12 consecutive gains. Extended from the prior base. On pullbacks, prior highs in the $79-$77 area define initial support to watch above its 50 DMA line ($76.15).
>>> FEATURED STOCK ARTICLE : Streak of 11 Straight Gains into New High Territory - 4/12/2023 |
View all notes |
Set NEW NOTE alert |
Company Profile |
SEC
News |
Chart |
Request a new note
C
A
S
I |
ANET
-
NYSE
Arista Networks
Computer-Networking
|
$163.42
|
-0.18
-0.11% |
$164.62
|
1,030,621
38.85% of 50 DAV
50 DAV is 2,653,000
|
$171.44
-4.68%
|
3/8/2023
|
$147.59
|
PP = $148.67
|
|
MB = $156.10
|
Most Recent Note - 4/17/2023 5:48:38 PM
G - Ended lower for a 2nd small loss today with below-average volume. It is extended from any sound base after an impressive spurt of volume-driven gains. Prior highs in the $148-145 area define important support to watch along with its 50 DMA line ($150.77). See the latest FSU analysis for more details and a new annotated graph.
>>> FEATURED STOCK ARTICLE : Near High With Volume Cooling Following Volume-Driven Gains - 4/17/2023 |
View all notes |
Set NEW NOTE alert |
Company Profile |
SEC
News |
Chart |
Request a new note
C
A
S
I |
CLH
-
NYSE
Clean Harbors
Pollution Control
|
$143.31
|
-0.23
-0.16% |
$145.04
|
248,750
57.32% of 50 DAV
50 DAV is 434,000
|
$144.79
-1.02%
|
3/10/2023
|
$136.89
|
PP = $136.74
|
|
MB = $143.58
|
Most Recent Note - 4/17/2023 3:45:46 PM
Y - Perched at its all-time high and near its "max buy" level, holding its ground with volume totals cooling. Found prompt support near its 50 DMA line ($135.35). Below that important short-term average, the recent low ($129.93 on 3/24/23) defines the next important support where a violation would raise concerns and trigger a more worrisome technical sell signal. Fundamentals remain strong.
>>> FEATURED STOCK ARTICLE : Finding Support Recently at 50-Day Moving Average Line - 3/29/2023 |
View all notes |
Set NEW NOTE alert |
Company Profile |
SEC
News |
Chart |
Request a new note
C
A
S
I |
|
|
|
THESE ARE NOT BUY RECOMMENDATIONS!
Comments contained in the body of this report are technical
opinions only. The material herein has been obtained
from sources believed to be reliable and accurate, however,
its accuracy and completeness cannot be guaranteed.
This site is not an investment advisor, hence it does
not endorse or recommend any securities or other investments.
Any recommendation contained in this report may not
be suitable for all investors and it is not to be deemed
an offer or solicitation on our part with respect to
the purchase or sale of any securities. All trademarks,
service marks and trade names appearing in this report
are the property of their respective owners, and are
likewise used for identification purposes only.
This report is a service available
only to active Paid Premium Members.
You may opt-out of receiving report notifications
at any time. Questions or comments may be submitted
by writing to Premium Membership Services 665 S.E. 10 Street, Suite 201 Deerfield Beach, FL 33441-5634 or by calling 1-800-965-8307
or 954-785-1121.
|
|
|