You are not logged in.
This means you
CAN ONLY VIEW reports that were published prior to Thursday, March 20, 2025.
You
MUST UPGRADE YOUR MEMBERSHIP if you want to see any current reports.
AFTER MARKET UPDATE - WEDNESDAY, APRIL 12TH, 2023
Previous After Market Report Next After Market Report >>>
|
|
|
|
DOW |
-38.29 |
33,646.50 |
-0.11% |
|
Volume |
809,897,610 |
-1% |
|
Volume |
4,892,013,300 |
+5% |
|
NASDAQ |
-102.54 |
11,929.34 |
-0.85% |
|
Advancers |
1,314 |
46% |
|
Advancers |
1,702 |
38% |
|
S&P 500 |
-16.99 |
4,091.95 |
-0.41% |
|
Decliners |
1,566 |
54% |
|
Decliners |
2,758 |
62% |
|
Russell 2000 |
-12.90 |
1,773.70 |
-0.72% |
|
52 Wk Highs |
53 |
|
|
52 Wk Highs |
84 |
|
|
S&P 600 |
-9.14 |
1,163.24 |
-0.78% |
|
52 Wk Lows |
26 |
|
|
52 Wk Lows |
193 |
|
|
 |
Major Indices Sputter Despite Some Signs of Easing Inflation
Kenneth J. Gruneisen - Passed the CAN SLIM® Master's Exam
The Dow lost 38 points (-0.1%) while the Nasdaq Composite decreased 0.9% and the S&P 500 declined 0.4%. Volume totals reported were mixed, lighter than the prior session on the NYSE and higher on the Nasdaq exchange. Breadth was negative as decliners led advancers by an 8-7 margin on the NYSE and by 3-2 on the Nasdaq exchange. There were 21 high-ranked companies from the Leaders Listthat hit a new 52-week high and were listed on the BreakOuts Page, versus the total of 25 on the prior session. New 52-week highs outnumbered new 52-week lows on the NYSE but new lows still outnumbered new highs on the Nasdaq exchange.The major indices are in a confirmed uptrend (M criteria). Appropriate new buying efforts may be considered under the fact-based investment system.
PICTURED: The S&P 500 Index is consolidating above its 50-day and 200-day moving average (DMA) lines, still lingering below its February high.
Seven of the eleven sectors finished in negative territory as U.S. equities reversed earlier gains to close in the red Wednesday. March’s Consumer Price Index (CPI) reading came in lower-than-expected. Even though last month’s reading showed inflation may be easing, the overall growth rate is still above the Federal Reserve’s (Fed) 2% target. Many analysts estimate the Fed will increase interest rates again at the May meeting before potentially pausing.
On the data front, March’s CPI came in at 0.1% month-over-month, easing from February’s 0.4% gain, while the year-over-year rate eased from 6% to 5%, notching the smallest annual increase in nearly two years. Meanwhile, core CPI, which excludes the more volatile food and energy prices, met analysts’ estimates with 0.4% month-over-month and 5.6% year-over-year growth. Rounding out today’s docket, investors were able to parse through the Fed’s meeting minutes from March, providing insights into the Fed’s monetary policy going forward.
Treasuries are mixed, with the yield on the 10-year note down three basis points (0.03%) to 3.40%, while the 30-year bond yield increased one basis point (0.01%) to 3.63%. The yield on the two-year note, which is more sensitive to changes in Fed policy, lost seven basis points (0.07%) to 3.96%. In commodities, West Texas Intermediate (WTI) crude increased 2.1% to $83.23/barrel amid easing inflation in the U.S. Meanwhile, the Biden administration announced it plans to refill the U.S. Strategic Petroleum Reserve (SPR) with hopes to refill it at a low price.
|
 Kenneth J. Gruneisen started out as a licensed stockbroker in August 1987, a couple of months prior to the historic stock market crash that took the Dow Jones Industrial Average down -22.6% in a single day. He has published daily fact-based fundamental and technical analysis on high-ranked stocks online for two decades. Through FACTBASEDINVESTING.COM, Kenneth provides educational articles, news, market commentary, and other information regarding proven investment systems that work in good times and bad.
Comments contained in the body of this report are technical opinions only and are not necessarily those of Gruneisen Growth Corp. The material herein has been obtained from sources believed to be reliable and accurate, however, its accuracy and completeness cannot be guaranteed. Our firm, employees, and customers may effect transactions, including transactions contrary to any recommendation herein, or have positions in the securities mentioned herein or options with respect thereto. Any recommendation contained in this report may not be suitable for all investors and it is not to be deemed an offer or solicitation on our part with respect to the purchase or sale of any securities. |
|
 |
Broker/Dealer, Oil Services, and Gold & Silver Indexes Rose
Kenneth J. Gruneisen - Passed the CAN SLIM® Master's Exam
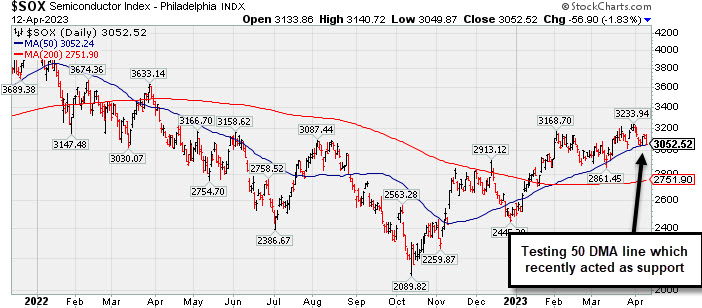
The Retail Index ($RLX -1.63%) and Bank Index ($BKX -0.77%) both created a drag on the major averages while the Broker/Dealer Index ($XBD +0.44%) edged higher. The Semiconductor Index ($SOX -1.83%) led the tech sectort lower while the Networking Index ($NWX -0.29%) and Biotech Index ($BTK -0.26%) both edged lower. The Gold & Silver Index ($XAU +0.90%) and Oil Services Index ($OSX +0.66%) both posted gains while the Integrated Oil Index ($XOI -0.01%) finished flat.
PICTURED: The Semiconductor Index ($SOX -1.83%) pulled back today testing its 50-day moving average (DMA) line which recently acted as support.
| Oil Services |
$OSX |
82.72 |
+0.54 |
+0.66% |
-1.36% |
| Integrated Oil |
$XOI |
1,814.92 |
-0.16 |
-0.01% |
+1.55% |
| Semiconductor |
$SOX |
3,052.52 |
-56.90 |
-1.83% |
+20.55% |
| Networking |
$NWX |
825.28 |
-2.41 |
-0.29% |
+5.36% |
| Broker/Dealer |
$XBD |
447.38 |
+1.97 |
+0.44% |
-0.39% |
| Retail |
$RLX |
2,894.22 |
-47.83 |
-1.63% |
+5.09% |
| Gold & Silver |
$XAU |
140.30 |
+1.25 |
+0.90% |
+16.08% |
| Bank |
$BKX |
81.49 |
-0.63 |
-0.77% |
-19.20% |
| Biotech |
$BTK |
5,336.85 |
-13.84 |
-0.26% |
+1.06% |
|
|
|
 |
Streak of 11 Straight Gains into New High Territory
Kenneth J. Gruneisen - Passed the CAN SLIM® Master's Exam
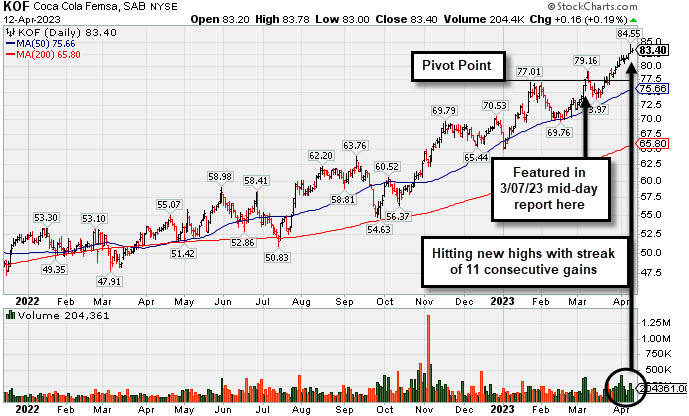
Coca Cola Femsa Sab Ads (KOF +$0.16 or +0.19% to $83.40) has been hitting new all-time highs during a streak of 11 consecutive gains, getting extended from the prior base. On pullbacks, prior highs in the $79-$77 area define initial support to watch above its 50-day moving average (DMA) line ($75.76).
KOF was highlighted in yellow with pivot point cited based on its 1/24/23 high plus 10 cents in the 3/07/23 mid-day report (read here). It was last shown in great detail on 3/24/23 with an annotated graph under the headline "Gain for Best-Ever Close With Near Average Volume".
KOF has a 93 Earnings Per Share Rating. It reported Jun, Sep and Dec '22 quarterly earnings increases above the +25% minimum guideline (C criteria) backed by strong sales revenues growth. Annal earnings had a downturn in FY '20 like many companies during the pandemic.
It hails from the Beverages - Non-Alcoholic group which is currently ranked 42nd on the 197 Industry Groups list. There are only 107.1 million shares in the public float (S criteria). The number of top-rated funds owning its shares rose from 120 in Mar '22 to 171 in Mar '23, a reassuring sign concerning the I criteria. Its current Up/Down Volume Ratio of 2.0 is an unbiased indication its shares have been under accumulation over the past 50 days. |
|
|
Color Codes Explained :
Y - Better candidates highlighted by our
staff of experts.
G - Previously featured
in past reports as yellow but may no longer be buyable under the
guidelines.
***Last / Change / Volume data in this table is the closing quote data***
Symbol/Exchange
Company Name
Industry Group |
PRICE |
CHANGE
(%Change) |
Day High |
Volume
(% DAV)
(% 50 day avg vol) |
52 Wk Hi
% From Hi |
Featured
Date |
Price
Featured |
Pivot Featured |
|
Max Buy |
 GPK
-
NYSE
GPK
-
NYSE
Graphic Packaging
CONSUMER NON-DURABLES - Packaging and Containers
|
$24.84
|
-0.40
-1.58% |
$25.33
|
3,243,668
100.58% of 50 DAV
50 DAV is 3,225,000
|
$25.62
-3.04%
|
10/25/2022
|
$22.75
|
PP = $24.17
|
|
MB = $25.38
|
 Most Recent Note - 4/12/2023 5:24:18 PM
Y - Still consolidating below its "max buy" level and just -3% below its all-time high. Recent gains lacked great volume conviction. Its 50 DMA line ($24.10) and recent low ($22.99 on 3/16/23) define important near-term support to watch.
>>> FEATURED STOCK ARTICLE : Quietly Consolidating Just Below "Max Buy" Level - 4/10/2023 |
View all notes |
Set NEW NOTE alert |
Company Profile |
SEC
News |
Chart |
Request a new note
C
A
S
I |
STRL
-
NASDAQ
Sterling Infrastructure
MATERIALS and; CONSTRUCTION - Heavy Construction
|
$35.52
|
+0.13
0.37% |
$35.91
|
183,766
69.61% of 50 DAV
50 DAV is 264,000
|
$42.00
-15.43%
|
12/14/2022
|
$32.41
|
PP = $33.72
|
|
MB = $35.41
|
Most Recent Note - 4/11/2023 5:46:51 PM
G - Still sputtering and failing to rebound after damaging losses with above-average volume violated its 50 DMA line ($37.70) triggering a technical sell signal. A rebound above the 50 DMA line is needed for its outlook to improve.
>>> FEATURED STOCK ARTICLE : Volume-Driven 50-Day Moving Average Violation Triggered Sell Signal - 4/5/2023 |
View all notes |
Set NEW NOTE alert |
Company Profile |
SEC
News |
Chart |
Request a new note
C
A
S
I |
PERI
-
NASDAQ
Perion Network
Comml Svcs-Advertising
|
$38.83
|
-1.04
-2.61% |
$40.69
|
460,144
57.95% of 50 DAV
50 DAV is 794,000
|
$42.04
-7.64%
|
1/25/2023
|
$31.79
|
PP = $33.19
|
|
MB = $34.85
|
Most Recent Note - 4/12/2023 5:21:47 PM
G - Pulled back today with below-average volume. Volume totals have been cooling while consolidating near its all-time high. Its 50 DMA line ($35.57) defines important near-term support to watch.
>>> FEATURED STOCK ARTICLE : Hit Another New High With Gain Backed by Light Volume - 3/31/2023 |
View all notes |
Set NEW NOTE alert |
Company Profile |
SEC
News |
Chart |
Request a new note
C
A
S
I |
ALGM
-
NASDAQ
Allegro MicroSystems
Elec-Semiconductor Mfg
|
$44.82
|
-0.54
-1.19% |
$45.90
|
846,581
51.25% of 50 DAV
50 DAV is 1,652,000
|
$48.72
-8.00%
|
1/31/2023
|
$37.80
|
PP = $38.38
|
|
MB = $40.30
|
Most Recent Note - 4/11/2023 5:41:30 PM
G - Volume totals have been cooling while consolidating just above its 50 DMA line ($44.31) which defines important near-term support to watch on pullbacks. See the latest FSU analysis for more details and a new annotated graph.
>>> FEATURED STOCK ARTICLE : Consolidating Near 50 DMA Line After Recent Rally - 4/11/2023 |
View all notes |
Set NEW NOTE alert |
Company Profile |
SEC
News |
Chart |
Request a new note
C
A
S
I |
FIX
-
NYSE
Comfort Systems USA
MATERIALS and CONSTRUCTION - General Contractors
|
$130.56
|
+0.89
0.69% |
$131.50
|
188,887
65.36% of 50 DAV
50 DAV is 289,000
|
$152.13
-14.18%
|
2/23/2023
|
$136.52
|
PP = $128.78
|
|
MB = $135.22
|
Most Recent Note - 4/11/2023 5:43:57 PM
G - Still sputtering near prior highs in the $128 area which are acting as support after damaging losses violated its 50 DMA line ($134.71) triggering a technical sell signal. Only a prompt rebound above the 50 DMA line would help its outlook improve. Fundamentals remain strong.
>>> FEATURED STOCK ARTICLE : Pullback With Higher Volume While Consolidating - 4/4/2023 |
View all notes |
Set NEW NOTE alert |
Company Profile |
SEC
News |
Chart |
Request a new note
C
A
S
I |
Symbol/Exchange
Company Name
Industry Group |
PRICE |
CHANGE
(%Change) |
Day High |
Volume
(% DAV)
(% 50 day avg vol) |
52 Wk Hi
% From Hi |
Featured
Date |
Price
Featured |
Pivot Featured |
|
Max Buy |
KOF
-
NYSE
Coca-Cola Femsa ADR
FOOD and BEVERAGE - Beverages - Soft Drinks
|
$83.40
|
+0.16
0.19% |
$83.78
|
204,362
110.47% of 50 DAV
50 DAV is 185,000
|
$84.55
-1.36%
|
3/7/2023
|
$76.63
|
PP = $77.11
|
|
MB = $80.97
|
Most Recent Note - 4/12/2023 5:20:22 PM
G - Hitting new all-time highs with a streak of 11 consecutive gains, getting extended from the prior base. On pullbacks, prior highs in the $79-$77 area define initial support to watch above its 50 DMA line ($75.66). See the latest FSU analysis for more details and a new annotated graph.
>>> FEATURED STOCK ARTICLE : Streak of 11 Straight Gains into New High Territory - 4/12/2023 |
View all notes |
Set NEW NOTE alert |
Company Profile |
SEC
News |
Chart |
Request a new note
C
A
S
I |
ANET
-
NYSE
Arista Networks
Computer-Networking
|
$161.41
|
+1.80
1.13% |
$162.99
|
1,895,716
70.26% of 50 DAV
50 DAV is 2,698,000
|
$171.44
-5.85%
|
3/8/2023
|
$147.59
|
PP = $148.67
|
|
MB = $156.10
|
Most Recent Note - 4/11/2023 5:47:59 PM
G - Pulled back today with below-average volume. Very extended from any sound base after an impressive spurt of volume-driven gains. Prior highs in the $148-145 area define important support to watch along with its 50 DMA line ($148).
>>> FEATURED STOCK ARTICLE : Pulling Back After Getting Very Extended From Prior Base - 3/28/2023 |
View all notes |
Set NEW NOTE alert |
Company Profile |
SEC
News |
Chart |
Request a new note
C
A
S
I |
CLH
-
NYSE
Clean Harbors
Pollution Control
|
$140.89
|
+2.49
1.80% |
$141.59
|
280,582
64.80% of 50 DAV
50 DAV is 433,000
|
$144.20
-2.30%
|
3/10/2023
|
$136.89
|
PP = $136.74
|
|
MB = $143.58
|
Most Recent Note - 4/12/2023 5:22:48 PM
Y - Posted a 3rd consecutive gain today with below-average volume. Found prompt support near its 50 DMA line ($134.57). Below that important short-term average, the recent low ($129.93 on 3/24/23) defines the next important support where a violation would raise concerns and trigger a more worrisome technical sell signal. Fundamentals remain strong.
>>> FEATURED STOCK ARTICLE : Finding Support Recently at 50-Day Moving Average Line - 3/29/2023 |
View all notes |
Set NEW NOTE alert |
Company Profile |
SEC
News |
Chart |
Request a new note
C
A
S
I |
|
|
|
THESE ARE NOT BUY RECOMMENDATIONS!
Comments contained in the body of this report are technical
opinions only. The material herein has been obtained
from sources believed to be reliable and accurate, however,
its accuracy and completeness cannot be guaranteed.
This site is not an investment advisor, hence it does
not endorse or recommend any securities or other investments.
Any recommendation contained in this report may not
be suitable for all investors and it is not to be deemed
an offer or solicitation on our part with respect to
the purchase or sale of any securities. All trademarks,
service marks and trade names appearing in this report
are the property of their respective owners, and are
likewise used for identification purposes only.
This report is a service available
only to active Paid Premium Members.
You may opt-out of receiving report notifications
at any time. Questions or comments may be submitted
by writing to Premium Membership Services 665 S.E. 10 Street, Suite 201 Deerfield Beach, FL 33441-5634 or by calling 1-800-965-8307
or 954-785-1121.
|
|
|