You are not logged in.
This means you
CAN ONLY VIEW reports that were published prior to Thursday, March 20, 2025.
You
MUST UPGRADE YOUR MEMBERSHIP if you want to see any current reports.
AFTER MARKET UPDATE - MONDAY, APRIL 10TH, 2023
Previous After Market Report Next After Market Report >>>
|
|
|
|
DOW |
+101.23 |
33,586.52 |
+0.30% |
|
Volume |
824,872,485 |
+8% |
|
Volume |
4,278,339,200 |
+12% |
|
NASDAQ |
-3.60 |
12,084.36 |
-0.03% |
|
Advancers |
1,877 |
64% |
|
Advancers |
2,548 |
57% |
|
S&P 500 |
+4.09 |
4,109.11 |
+0.10% |
|
Decliners |
1,055 |
36% |
|
Decliners |
1,910 |
43% |
|
Russell 2000 |
+17.98 |
1,772.44 |
+1.02% |
|
52 Wk Highs |
34 |
|
|
52 Wk Highs |
57 |
|
|
S&P 600 |
+13.84 |
1,163.85 |
+1.20% |
|
52 Wk Lows |
39 |
|
|
52 Wk Lows |
167 |
|
|
 |
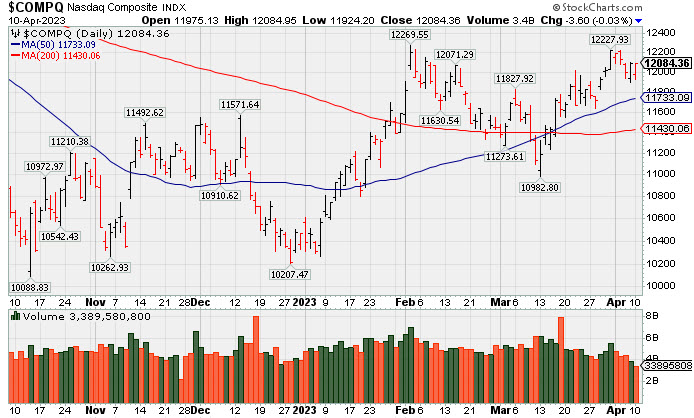
Major Averages Had a Slightly Positive Bias
Kenneth J. Gruneisen - Passed the CAN SLIM® Master's Exam
The Dow added 101 points (0.3%) while the Nasdaq Composite hovered around the flat line and the S&P 500 increased 0.1%. Volume totals reported were higher than the prior session on the NYSE and on the Nasdaq exchange. Breadth was positive as advancers led decliners by almost a 2-1 margin on the NYSE and by 5-4 on the Nasdaq exchange. Leadership remained thin as there were 13 high-ranked companies from the Leaders List that hit a new 52-week high and were listed on the BreakOuts Page, versus the total of 11 on the prior session. New 52-week lows totals outnumbered new 52-week highs totals on the NYSE and on the Nasdaq exchange. The major indices are in a confirmed uptrend (M criteria). Appropriate new buying efforts may be considered under the fact-based investment system.
PICTURED: The Nasdaq Composite Index is quietly consolidating above its 50-day moving average (DMA) line after rebounding toward its February high in recent weeks.
Six of the eleven sectors finished in positive territory as U.S. equities finished mixed on Monday. Recessionary fears rose ahead of this week’s inflation data. March’s Consumer Price Index (CPI) and Purchaser Price Index (PPI) are slated to be released on Wednesday and Thursday this week, allowing investors more insight into the state of the economy ahead of the Federal Reserve’s (Fed) next meeting on May 3. Many analysts are already estimating another potential rate hike after Friday’s strong employment data.
On the data front, February’s finalized wholesale inventories was unexpectedly revised a tick lower to 0.1%, compared to January’s decline of 0.5%. In corporate news, investors can expect the first batch of large banks to report first quarter financials throughout the week.
Treasuries weakened, with the yield on the 10-year note up twelve basis points (0.12%) to 3.42%, while the 30-year bond yield increased eight basis points (0.08%) to 3.63%. The yield on the two-year note, which is more sensitive to changes in Fed policy, gained 19 basis points (0.19%) to 4.01%. In commodities, West Texas Intermediate (WTI) crude declined 1.2% to $79.77/barrel amid weakening demand. According to analysts, spending on oil exploration is forecasted to rise above pre-pandemic levels this year. It is estimated that the companies representing approximately 70% of the global output may spend roughly $376 billion in exploration this year, up 11% from 2022. In the metals complex, gold is down 1.1% amid a stronger greenback.
|
 Kenneth J. Gruneisen started out as a licensed stockbroker in August 1987, a couple of months prior to the historic stock market crash that took the Dow Jones Industrial Average down -22.6% in a single day. He has published daily fact-based fundamental and technical analysis on high-ranked stocks online for two decades. Through FACTBASEDINVESTING.COM, Kenneth provides educational articles, news, market commentary, and other information regarding proven investment systems that work in good times and bad.
Comments contained in the body of this report are technical opinions only and are not necessarily those of Gruneisen Growth Corp. The material herein has been obtained from sources believed to be reliable and accurate, however, its accuracy and completeness cannot be guaranteed. Our firm, employees, and customers may effect transactions, including transactions contrary to any recommendation herein, or have positions in the securities mentioned herein or options with respect thereto. Any recommendation contained in this report may not be suitable for all investors and it is not to be deemed an offer or solicitation on our part with respect to the purchase or sale of any securities. |
|
 |
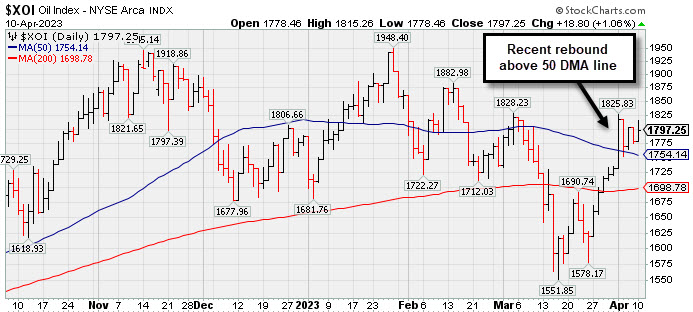
Financial, Retail, Energy, and Most Tech Indexes Rose
Kenneth J. Gruneisen - Passed the CAN SLIM® Master's Exam
The Bank Index ($BKX +0.82%), Broker/Dealer Index ($XBD +0.55%), and Retail Index ($RLX +0.46%) each posted a small gain. The Semiconductor Index ($SOX +1.80%) and Networking Index ($NWX +0.98%) bothn rose while the Biotech Index ($BTK -1.02%) ended lower. Commodity-linked groups were also mixed on Monday as the Oil Services Index ($OSX +1.17%) and Integrated Oil Index ($XOI +1.06%) both posted gains, meanwhile the Gold & Silver Index ($XAU -0.96%) lost ground.
PICTURED: The Broker/Dealer Index ($XBD +0.27%) recently rebounded above its 50-day moving average (DMA) line.
| Oil Services |
$OSX |
80.81 |
+0.93 |
+1.17% |
-3.63% |
| Integrated Oil |
$XOI |
1,797.25 |
+18.80 |
+1.06% |
+0.56% |
| Semiconductor |
$SOX |
3,126.97 |
+55.21 |
+1.80% |
+23.49% |
| Networking |
$NWX |
836.89 |
+8.09 |
+0.98% |
+6.84% |
| Broker/Dealer |
$XBD |
441.41 |
+2.41 |
+0.55% |
-1.72% |
| Retail |
$RLX |
2,967.15 |
+13.63 |
+0.46% |
+7.74% |
| Gold & Silver |
$XAU |
137.36 |
-1.33 |
-0.96% |
+13.65% |
| Bank |
$BKX |
81.08 |
+0.66 |
+0.82% |
-19.60% |
| Biotech |
$BTK |
5,336.93 |
-54.90 |
-1.02% |
+1.06% |
|
|
|
 |
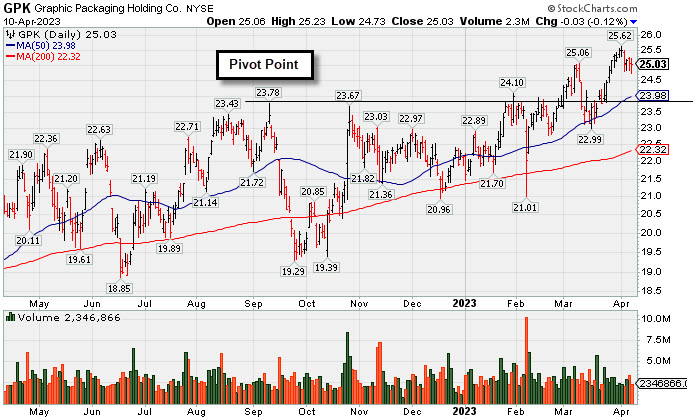
Quietly Consolidating Just Below "Max Buy" Level
Kenneth J. Gruneisen - Passed the CAN SLIM® Master's Exam
Graphic Packaging Hldg (GPK -$0.03 or -0.12% to $25.03) is quietly consolidating just below its "max buy" level and just -2.3% below its all-time high. Recent gains lacked great volume conviction. Its 50-day moving average (DMA) line ($24.04) and recent low ($22.99 on 3/16/23) define important near-term support to watch.
GPK was last shown in this FSU section on 2/27/23 with an annotated graph under the headline, "Quietly Lingering Near High With Strong Fundamentals". It was highlighted in yellow with pivot point cited based on its 9/12/22 high plus 10 cents in the 10/25/22 mid-day report (read here). It has an 98 Earnings Per Share Rating. It reported Dec '22 quarterly earnings +74% on +20% sales revenues versus the year ago period. The past 4 quarterly comparisons were well above the +25% minimum earnings guideline (C criteria). Its annual earnings history has been good, meeting the fact-based investment system's fundamental guidelines (A criteria).
The Paper & Paper Products group is ranked 138th on the 197 Industry Groups list and it has a D+ (31) Group Relative Strength Rating (L criteria). The number of top-rated funds owning its shares rose from 596 in Sep '21 to 784 in Mar '23, a reassuring sign concerning the I criteria. Its current Up/Down Volume Ratio of 1.4 is an unbiased indication its shares have been under accumulation over the past 50 days.
|
|
|
Color Codes Explained :
Y - Better candidates highlighted by our
staff of experts.
G - Previously featured
in past reports as yellow but may no longer be buyable under the
guidelines.
***Last / Change / Volume data in this table is the closing quote data***
Symbol/Exchange
Company Name
Industry Group |
PRICE |
CHANGE
(%Change) |
Day High |
Volume
(% DAV)
(% 50 day avg vol) |
52 Wk Hi
% From Hi |
Featured
Date |
Price
Featured |
Pivot Featured |
|
Max Buy |
 GPK
-
NYSE
GPK
-
NYSE
Graphic Packaging
CONSUMER NON-DURABLES - Packaging and Containers
|
$25.03
|
-0.03
-0.12% |
$25.23
|
2,346,866
72.23% of 50 DAV
50 DAV is 3,249,000
|
$25.62
-2.30%
|
10/25/2022
|
$22.75
|
PP = $24.17
|
|
MB = $25.38
|
 Most Recent Note - 4/10/2023 6:46:24 PM
Y - Is quietly consolidating just below its "max buy" level and just -2.3% below its all-time high. Recent gains lacked great volume conviction. Its 50 DMA line ($24.04) and recent low ($22.99 on 3/16/23) define important near-term support to watch. See the latest FSU analysis for more details and a new annotated graph.
>>> FEATURED STOCK ARTICLE : Quietly Consolidating Just Below "Max Buy" Level - 4/10/2023 |
View all notes |
Set NEW NOTE alert |
Company Profile |
SEC
News |
Chart |
Request a new note
C
A
S
I |
STRL
-
NASDAQ
Sterling Infrastructure
MATERIALS and; CONSTRUCTION - Heavy Construction
|
$35.12
|
+0.48
1.39% |
$35.62
|
134,503
49.63% of 50 DAV
50 DAV is 271,000
|
$42.00
-16.38%
|
12/14/2022
|
$32.41
|
PP = $33.72
|
|
MB = $35.41
|
Most Recent Note - 4/5/2023 6:14:48 PM
G - Suffered damaging losses with above-average volume and violated its 50 DMA line ($37.63) triggering a technical sell signal. Only a prompt rebound above the 50 DMA line would help its outlook improve. See the latest FSU analysis for more details and a new annotated graph.
>>> FEATURED STOCK ARTICLE : Volume-Driven 50-Day Moving Average Violation Triggered Sell Signal - 4/5/2023 |
View all notes |
Set NEW NOTE alert |
Company Profile |
SEC
News |
Chart |
Request a new note
C
A
S
I |
PERI
-
NASDAQ
Perion Network
Comml Svcs-Advertising
|
$39.34
|
-0.79
-1.97% |
$39.81
|
687,902
86.53% of 50 DAV
50 DAV is 795,000
|
$42.04
-6.42%
|
1/25/2023
|
$31.79
|
PP = $33.19
|
|
MB = $34.85
|
Most Recent Note - 4/6/2023 1:04:31 PM
G - Pulling back today for a 2nd small loss with light volume following volume-driven gains for new all-time highs. Its 50 DMA line ($35.18) defines important near-term support to watch.
>>> FEATURED STOCK ARTICLE : Hit Another New High With Gain Backed by Light Volume - 3/31/2023 |
View all notes |
Set NEW NOTE alert |
Company Profile |
SEC
News |
Chart |
Request a new note
C
A
S
I |
ALGM
-
NASDAQ
Allegro MicroSystems
Elec-Semiconductor Mfg
|
$46.20
|
+1.14
2.53% |
$46.24
|
935,713
55.24% of 50 DAV
50 DAV is 1,694,000
|
$48.72
-5.17%
|
1/31/2023
|
$37.80
|
PP = $38.38
|
|
MB = $40.30
|
Most Recent Note - 4/10/2023 6:48:20 PM
G - Posted a gain today with below-average volume, consolidating just above its 50 DMA line ($44.12) which defines important near-term support to watch on pullbacks.
>>> FEATURED STOCK ARTICLE : Extended From Prior Base and Perched Near All-Time High - 3/22/2023 |
View all notes |
Set NEW NOTE alert |
Company Profile |
SEC
News |
Chart |
Request a new note
C
A
S
I |
FIX
-
NYSE
Comfort Systems USA
MATERIALS and CONSTRUCTION - General Contractors
|
$130.55
|
+1.24
0.96% |
$132.48
|
335,341
121.94% of 50 DAV
50 DAV is 275,000
|
$152.13
-14.19%
|
2/23/2023
|
$136.52
|
PP = $128.78
|
|
MB = $135.22
|
Most Recent Note - 4/5/2023 12:45:53 PM
G - Violated its 50 DMA line ($134.03) and undercut the prior lows with today's big loss triggering a technical sell signal. Prior loss with above-average volume was noted as "action indicative of distributional pressure." Only a prompt rebound above the 50 DMA line would help its outlook improve. Fundamentals remain strong.
>>> FEATURED STOCK ARTICLE : Pullback With Higher Volume While Consolidating - 4/4/2023 |
View all notes |
Set NEW NOTE alert |
Company Profile |
SEC
News |
Chart |
Request a new note
C
A
S
I |
Symbol/Exchange
Company Name
Industry Group |
PRICE |
CHANGE
(%Change) |
Day High |
Volume
(% DAV)
(% 50 day avg vol) |
52 Wk Hi
% From Hi |
Featured
Date |
Price
Featured |
Pivot Featured |
|
Max Buy |
KOF
-
NYSE
Coca-Cola Femsa ADR
FOOD and BEVERAGE - Beverages - Soft Drinks
|
$82.67
|
+0.79
0.96% |
$82.84
|
176,732
95.53% of 50 DAV
50 DAV is 185,000
|
$82.41
0.32%
|
3/7/2023
|
$76.63
|
PP = $77.11
|
|
MB = $80.97
|
Most Recent Note - 4/10/2023 6:27:08 PM
G - Hit yet another new all-time high with today's 9th consecutive gain, getting extended from the prior base. On pullbacks, prior highs in the $79-$77 area define initial support to watch above its 50 DMA line ($75.30).
>>> FEATURED STOCK ARTICLE : Gain for Best-Ever Close With Near Average Volume - 3/24/2023 |
View all notes |
Set NEW NOTE alert |
Company Profile |
SEC
News |
Chart |
Request a new note
C
A
S
I |
ANET
-
NYSE
Arista Networks
Computer-Networking
|
$163.13
|
+3.28
2.05% |
$163.43
|
1,482,968
54.99% of 50 DAV
50 DAV is 2,697,000
|
$171.44
-4.85%
|
3/8/2023
|
$147.59
|
PP = $148.67
|
|
MB = $156.10
|
Most Recent Note - 4/10/2023 6:49:17 PM
G - Posted a small gain with below-average volume. Very extended from any sound base after an impressive spurt of volume-driven gains. Prior highs in the $148-145 area define initial support to watch above its 50 DMA line ($147.31).
>>> FEATURED STOCK ARTICLE : Pulling Back After Getting Very Extended From Prior Base - 3/28/2023 |
View all notes |
Set NEW NOTE alert |
Company Profile |
SEC
News |
Chart |
Request a new note
C
A
S
I |
CLH
-
NYSE
Clean Harbors
Pollution Control
|
$137.05
|
+3.11
2.32% |
$137.14
|
263,340
62.26% of 50 DAV
50 DAV is 423,000
|
$144.20
-4.96%
|
3/10/2023
|
$136.89
|
PP = $136.74
|
|
MB = $143.58
|
Most Recent Note - 4/10/2023 6:52:48 PM
Y - Posted a gain today with below-average volume, finding support near its 50 DMA line ($134.10). Below that important short-term average, the recent low ($129.93 on 3/24/23) defines the next important support where a violation would raise concerns and trigger a more worrisome technical sell signal. Fundamentals remain strong.
>>> FEATURED STOCK ARTICLE : Finding Support Recently at 50-Day Moving Average Line - 3/29/2023 |
View all notes |
Set NEW NOTE alert |
Company Profile |
SEC
News |
Chart |
Request a new note
C
A
S
I |
|
|
|
THESE ARE NOT BUY RECOMMENDATIONS!
Comments contained in the body of this report are technical
opinions only. The material herein has been obtained
from sources believed to be reliable and accurate, however,
its accuracy and completeness cannot be guaranteed.
This site is not an investment advisor, hence it does
not endorse or recommend any securities or other investments.
Any recommendation contained in this report may not
be suitable for all investors and it is not to be deemed
an offer or solicitation on our part with respect to
the purchase or sale of any securities. All trademarks,
service marks and trade names appearing in this report
are the property of their respective owners, and are
likewise used for identification purposes only.
This report is a service available
only to active Paid Premium Members.
You may opt-out of receiving report notifications
at any time. Questions or comments may be submitted
by writing to Premium Membership Services 665 S.E. 10 Street, Suite 201 Deerfield Beach, FL 33441-5634 or by calling 1-800-965-8307
or 954-785-1121.
|
|
|