You are not logged in.
This means you
CAN ONLY VIEW reports that were published prior to Thursday, March 20, 2025.
You
MUST UPGRADE YOUR MEMBERSHIP if you want to see any current reports.
AFTER MARKET UPDATE - THURSDAY, APRIL 1ST, 2021
Previous After Market Report Next After Market Report >>>
|
|
|
|
DOW |
+171.66 |
33,153.21 |
+0.52% |
|
Volume |
877,150,556 |
-29% |
|
Volume |
4,537,551,300 |
-9% |
|
NASDAQ |
+234.00 |
13,480.87 |
+1.77% |
|
Advancers |
2,634 |
80% |
|
Advancers |
3,128 |
76% |
|
S&P 500 |
+46.98 |
4,019.87 |
+1.18% |
|
Decliners |
654 |
20% |
|
Decliners |
995 |
24% |
|
Russell 2000 |
+33.38 |
2,253.90 |
+1.50% |
|
52 Wk Highs |
191 |
|
|
52 Wk Highs |
132 |
|
|
S&P 600 |
+20.95 |
1,340.30 |
+1.59% |
|
52 Wk Lows |
11 |
|
|
52 Wk Lows |
24 |
|
|
 |
Major Indices Rose With Quiet Volume Totals Ahead of Holiday
Kenneth J. Gruneisen - Passed the CAN SLIM® Master's Exam
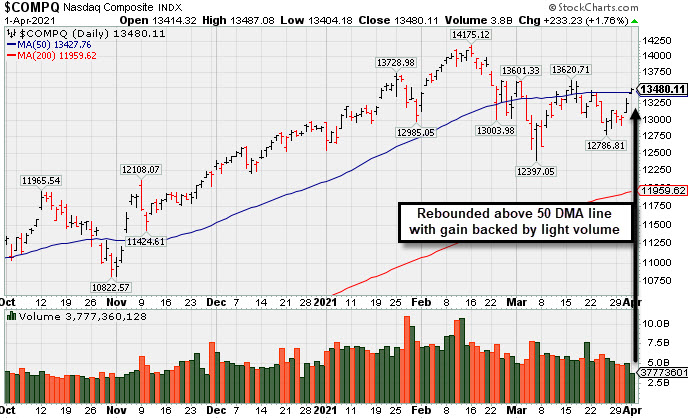
The S&P 500 jumped 1.2%, closing above the 4,000 level for the first time. For the week, the broad benchmark added 1.1%. A rally in tech shares propelled the Nasdaq Composite 1.8% higher, bringing its weekly advance to 2.6%. The Dow gained 171 points, pushing into positive territory for the week (+0.2%). The volume totals were lighter than the prior session totals on the NYSE and on the Nasdaq exchange. Breadth was positive as advancers led decliners by a 4-1 margin on the NYSE and by a 3-1 margin on the Nasdaq exchange. Leadership improved as there were 37 high-ranked companies from the Leaders List that hit new 52-week highs and were listed on the BreakOuts Page, versus the total of 32 on the prior session. New 52-week highs totals expanded and again outnumbered shrinking new 52-week lows on the NYSE on the Nasdaq exchange. The major indices (M criteria) are in a confirmed uptrend. Investors are reminded to always make buying and selling decisions on case-by-case basis under the strict criteria and rules of the fact-based investment system.
PICTURED: The Nasdaq Composite Index rebounded above its 50-day moving average (DMA) line with a gain backed by light volume.
U.S. stocks climbed on Thursday as President Biden's $2.25 trillion infrastructure plan helped fuel economic growth expectations. Heading into the long holiday weekend, all eyes are on the Labor Department’s monthly jobs report, due to be released on Friday despite a market holiday. Non-farm payrolls are expected to increase by 660,000 in March, which would mark the fastest pace of hiring in five months.
On the data front today, the Institute for Supply Management's (ISM) gauge of U.S. manufacturing activity surged to its best level since 1983. Separately, initial jobless claims came in at 719,000 in the latest week, above expectations of 675,000. Treasuries strengthened, nearly erasing a weekly decline as the yield on the 10-year Treasury note dropped six basis points to 1.68%. In commodities, WTI crude jumped 3.5% to $61.21/barrel after OPEC+ said they would gradually increase output for three months starting in May.
Eight of 11 S&P 500 sectors closed in positive territory, with the Energy, Technology, and Communication Services groups each rising more than 2%. In corporate news, Johnson & Johnson (JNJ -0.92%) fell after reporting a batch of its COVID-19 vaccines would be tossed, as they failed to meet quality standards. In earnings, Micron Technology (MU +4.76%) following a top and bottom line beat. |
 Kenneth J. Gruneisen started out as a licensed stockbroker in August 1987, a couple of months prior to the historic stock market crash that took the Dow Jones Industrial Average down -22.6% in a single day. He has published daily fact-based fundamental and technical analysis on high-ranked stocks online for two decades. Through FACTBASEDINVESTING.COM, Kenneth provides educational articles, news, market commentary, and other information regarding proven investment systems that work in good times and bad.
Comments contained in the body of this report are technical opinions only and are not necessarily those of Gruneisen Growth Corp. The material herein has been obtained from sources believed to be reliable and accurate, however, its accuracy and completeness cannot be guaranteed. Our firm, employees, and customers may effect transactions, including transactions contrary to any recommendation herein, or have positions in the securities mentioned herein or options with respect thereto. Any recommendation contained in this report may not be suitable for all investors and it is not to be deemed an offer or solicitation on our part with respect to the purchase or sale of any securities. |
|
 |
Widespread Gains Boosted All Group Indexes
Kenneth J. Gruneisen - Passed the CAN SLIM® Master's Exam
Commodity-linked groups had a positive bias as the Gold & Silver Index ($XAU +4.12%) outpaced the Oil Services Index ($OSX +2.68%) and Integrated Oil Index ($XOI +3.30%). The Semiconductor Index ($SOX +3.70%) led the tech sector while the Networking Index ($NWX +1.71%) and Biotech Index ($BTK +1.69%) also notched solid gains. The Broker/Dealer Index ($XBD +2.31%), Bank Index ($BKX +1.05%), and Retail Index ($RLX +1.50%) rounded out Thursday's widely positive session.
PICTURED: The Broker/Dealer Index ($XBD +2.31%) found support at its 50-day moving average (DMA) line and has rebounded toward its all-time high.
| Oil Services |
$OSX |
55.13 |
+1.44 |
+2.68% |
+24.37% |
| Integrated Oil |
$XOI |
1,040.68 |
+33.23 |
+3.30% |
+31.32% |
| Semiconductor |
$SOX |
3,240.43 |
+115.49 |
+3.70% |
+15.92% |
| Networking |
$NWX |
800.28 |
+13.48 |
+1.71% |
+11.60% |
| Broker/Dealer |
$XBD |
449.93 |
+10.17 |
+2.31% |
+19.16% |
| Retail |
$RLX |
3,705.63 |
+54.90 |
+1.50% |
+4.00% |
| Gold & Silver |
$XAU |
139.93 |
+5.54 |
+4.12% |
-2.96% |
| Bank |
$BKX |
121.40 |
+1.27 |
+1.05% |
+23.99% |
| Biotech |
$BTK |
5,571.95 |
+92.61 |
+1.69% |
-2.91% |
|
|
|
 |
Strong Breakout Action With +67% Above Average Volume
Kenneth J. Gruneisen - Passed the CAN SLIM® Master's Exam
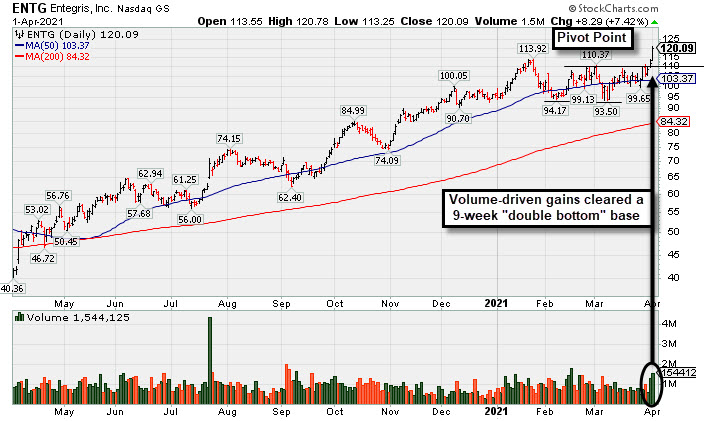
Entegris Inc (ENTG +$8.29 or +7.,42% to $120.09) finished strong after highlighted in yellow in the earlier mid day report (read here) with pivot point cited based on its 3/02/21 high after a 9-week "double bottom" base. It rallied for a new all-time high (N criteria) with today's 3rd consecutive gain backed by ever-increasing volume, quickly getting extended from prior highs. Technically, it broke out on the prior session with +40% above average volume.
The company hails from the ELECTRONICS - Semiconductor Equipment and Materials industry group which is currently ranked 30th on the 197 Industry Groups list (L criteria). It has a 95 Earnings Per Share rating and favorable fundamentals were previously noted in the 2/16/21 mid-day report - "Reported earnings +29% on +21% sales revenues for the Dec '20 quarter versus the year-ago period, its 3rd strong quarter backed with an improving sales revenues growth rate, helping it better match the +25% minimum guideline (C criteria). Annual earnings (A criteria) growth has been strong and steady after a downturn in FY '12."
There are 134.9 million shares outstanding (S criteria). The number of top-rated funds owning its shares rose from 617 in Mar '20 to 730 in Dec '20, a reassuring sign concerning the I criteria. It has a Timeliness rating of A and Sponsorship rating of B.
|
|
|
Color Codes Explained :
Y - Better candidates highlighted by our
staff of experts.
G - Previously featured
in past reports as yellow but may no longer be buyable under the
guidelines.
***Last / Change / Volume data in this table is the closing quote data***
Symbol/Exchange
Company Name
Industry Group |
PRICE |
CHANGE
(%Change) |
Day High |
Volume
(% DAV)
(% 50 day avg vol) |
52 Wk Hi
% From Hi |
Featured
Date |
Price
Featured |
Pivot Featured |
|
Max Buy |
 FBC
-
NYSE
FBC
-
NYSE
Flagstar Bancorp Inc
BANKING - Savings and Loans
|
$45.56
|
+0.46
1.02% |
$45.79
|
322,765
48.83% of 50 DAV
50 DAV is 661,000
|
$51.58
-11.67%
|
3/4/2021
|
$47.26
|
PP = $48.02
|
|
MB = $50.42
|
Most Recent Note - 3/29/2021 5:20:46 PM
G - Still sputtering below its 50 DMA line ($45.70) Only a prompt rebound would help its outlook improve. Near-term support to watch is prior lows.
>>> FEATURED STOCK ARTICLE : Slumping Into Prior Base Following Breakout - 3/22/2021 |
View all notes |
Set NEW NOTE alert |
Company Profile |
SEC
News |
Chart |
Request a new note
C
A
S
I |
CRL
-
NYSE
Charles River Labs Intl
DRUGS - Biotechnology
|
$294.17
|
+4.34
1.50% |
$295.69
|
282,147
89.86% of 50 DAV
50 DAV is 314,000
|
$303.79
-3.17%
|
12/17/2020
|
$247.06
|
PP = $257.98
|
|
MB = $270.88
|
Most Recent Note - 3/31/2021 6:27:48 PM
G - Posted a gain today with above average volume but ended near the session low. Consolidating above its 50 DMA line ($280) which acted as support throughout its ongoing ascent. Its Relative Strength Rating is 75, below the 80+ minimum guideline for buy candidates. Recently reported Dec '20 quarterly earnings +19% on +14% sales revenues versus the year ago period, below the +25% minimum earnings guideline (C criteria), raising fundamental concerns.
>>> FEATURED STOCK ARTICLE : Made Gradual Progress, Now Extended From Any Sound Base - 3/16/2021 |
View all notes |
Set NEW NOTE alert |
Company Profile |
SEC
News |
Chart |
Request a new note
C
A
S
I |
ENTG
-
NASDAQ
Entegris Inc
ELECTRONICS - Semiconductor Equipment and Mate
|
$120.09
|
+8.29
7.42% |
$120.78
|
1,544,125
167.29% of 50 DAV
50 DAV is 923,000
|
$114.00
5.34%
|
4/1/2021
|
$118.42
|
PP = $110.37
|
|
MB = $115.89
|
 Most Recent Note - 4/1/2021 5:56:54 PM
Y - Finished strong after highlighted in yellow in the earlier mid-day report with pivot point cited based on its 3/02/21 high after a 9-week "double bottom" base. Rallied for a new all-time high with +67% above average volume behind today's 3rd consecutive gain, quickly getting extended. Technically, it broke out on the prior session with +40% above average volume. The 2/16/21 mid-day report noted - "Reported earnings +29% on +21% sales revenues for the Dec '20 quarter versus the year-ago period, its 3rd strong quarter backed with an improving sales revenues growth rate, helping it better match the +25% minimum guideline (C criteria). Annual earnings (A criteria) growth has been strong and steady after a downturn in FY '12." See the latest FSU analysis for more details and a new annotated graph.
>>> FEATURED STOCK ARTICLE : Strong Breakout Action With +67% Above Average Volume - 4/1/2021 |
View all notes |
Set NEW NOTE alert |
Company Profile |
SEC
News |
Chart |
Request a new note
C
A
S
I |
OPY
-
NYSE
Oppenheimer Holdings Inc
FINANCIAL SERVICES - Investment Brokerage - Regiona
|
$40.84
|
+0.79
1.97% |
$41.00
|
87,873
63.68% of 50 DAV
50 DAV is 138,000
|
$44.38
-7.98%
|
2/25/2021
|
$38.95
|
PP = $38.11
|
|
MB = $40.02
|
Most Recent Note - 3/31/2021 6:19:52 PM
Y - Consolidating near its "max buy" level after getting extended from the previously noted base. Its 50 DMA line ($38.15) defines near-term support to watch. See the latest FSU analysis for more details and a new annotated graph.
>>> FEATURED STOCK ARTICLE : Oppenheimer Consolidating Near Max Buy Level - 3/31/2021 |
View all notes |
Set NEW NOTE alert |
Company Profile |
SEC
News |
Chart |
Request a new note
C
A
S
I |
EDUC
-
NASDAQ
Educational Development
WHOLESALE - Basic Materials Wholesale
|
$17.33
|
+0.28
1.64% |
$17.82
|
11,885
32.12% of 50 DAV
50 DAV is 37,000
|
$20.00
-13.35%
|
3/10/2021
|
$17.89
|
PP = $20.10
|
|
MB = $21.11
|
Most Recent Note - 3/30/2021 5:30:47 PM
Y - Recently found support above its 50 DMA line ($16.18) but it has met stubborn resistance in the $19-20 area. Subsequent gains above the pivot point backed by at least +40% above average volume are needed to trigger a proper technical buy signal. This thinly traded Media - Books firm's annual earnings (A criteria) history has strong. See the latest FSU analysis for more details and a new annotated graph.
>>> FEATURED STOCK ARTICLE : Consolidating Above 50 DMA Line Perched Near High - 3/30/2021 |
View all notes |
Set NEW NOTE alert |
Company Profile |
SEC
News |
Chart |
Request a new note
C
A
S
I |
Symbol/Exchange
Company Name
Industry Group |
PRICE |
CHANGE
(%Change) |
Day High |
Volume
(% DAV)
(% 50 day avg vol) |
52 Wk Hi
% From Hi |
Featured
Date |
Price
Featured |
Pivot Featured |
|
Max Buy |
SMPL
-
NASDAQ
Simply Good Foods Co
Food-Confectionery
|
$30.95
|
+0.53
1.74% |
$31.17
|
547,564
78.08% of 50 DAV
50 DAV is 701,300
|
$35.25
-12.20%
|
12/28/2020
|
$30.40
|
PP = $31.44
|
|
MB = $33.01
|
Most Recent Note - 3/30/2021 12:43:38 PM
G - Consolidating just above its 50 DMA line ($29.87), however, its Relative Strength Rating is 61, below the 80+ minimum guideline for buy candidates. Faces resistance due to overhead supply up to the $35 level.
>>> FEATURED STOCK ARTICLE : Violation of 50-Day Moving Average Triggered Technical Sell Signal - 3/24/2021 |
View all notes |
Set NEW NOTE alert |
Company Profile |
SEC
News |
Chart |
Request a new note
C
A
S
I |
QRVO
-
NASDAQ
Qorvo Inc
ELECTRONICS - Semiconductor - Integrated Cir
|
$192.90
|
+10.20
5.58% |
$194.28
|
1,979,037
134.45% of 50 DAV
50 DAV is 1,472,000
|
$191.83
0.56%
|
4/1/2021
|
$190.48
|
PP = $191.92
|
|
MB = $201.52
|
Most Recent Note - 4/1/2021 12:56:19 PM
Y - Color code is changed to yellow after forming a base of sufficient length. Gapped up for a 2nd consecutive session today hitting a new 52-week high, trying to rally from any orderly 9-week base. Traded above and below its 50 DMA line in recent months. Reported Dec '20 quarterly earnings +66% on +26% sales revenues versus the year ago period. Three of the 4 latest quarterly comparisons were above the +25% minimum guideline (C criteria). Annual earnings growth has been steady.
There are no Featured Stock Updates™ available for this stock at this time. You may request one by clicking the Request a New Note link below |
View all notes |
Set NEW NOTE alert |
Company Profile |
SEC
News |
Chart |
Request a new note
C
A
S
I |
UI
-
NYSE
Ubiquiti Inc
Telecom-Infrastructure
|
$289.15
|
-9.15
-3.07% |
$300.00
|
294,976
223.47% of 50 DAV
50 DAV is 132,000
|
$401.81
-28.04%
|
3/26/2021
|
$383.00
|
PP = $362.99
|
|
MB = $381.14
|
Most Recent Note - 3/31/2021 6:26:41 PM
G - Color code is changed to green after today's 3rd consecutive big loss with even heavier volume violated its 50 DMA line ($327) triggering a technical sell signal. It quickly negated the prior breakout raising immediate concerns. Prior low ($297) may act as support, meanwhile, a rebound above the 50 DMA line is needed for its outlook to improve.
>>> FEATURED STOCK ARTICLE : Volume +231% Above Average With Breakout Gain - 3/26/2021 |
View all notes |
Set NEW NOTE alert |
Company Profile |
SEC
News |
Chart |
Request a new note
C
A
S
I |
DT
-
NYSE
Dynatrace Inc
Computer Sftwr-Enterprse
|
$49.55
|
+1.31
2.72% |
$50.59
|
1,650,714
61.92% of 50 DAV
50 DAV is 2,666,000
|
$56.94
-12.98%
|
2/4/2021
|
$51.39
|
PP = $48.95
|
|
MB = $51.40
|
Most Recent Note - 3/31/2021 6:22:28 PM
G - Posted a gain with light volume today rebounding toward its 50 DMA line ($49.88) after damaging losses undercut prior highs in the $48 area. Its Relative Strength Rating is 59, well below the 80+ minimum guideline for buy candidates. Fundamentals remain strong after it reported Dec '20 earnings +70% on +28% sales revenues versus the year ago period.
>>> FEATURED STOCK ARTICLE : 50-Day Moving Average Line Tested Again - 3/19/2021 |
View all notes |
Set NEW NOTE alert |
Company Profile |
SEC
News |
Chart |
Request a new note
C
A
S
I |
MRBK
-
NASDAQ
Meridian Corp
Banks-Northeast
|
$25.83
|
-0.17
-0.65% |
$26.03
|
23,595
65.54% of 50 DAV
50 DAV is 36,000
|
$27.96
-7.62%
|
2/22/2021
|
$25.58
|
PP = $26.10
|
|
MB = $27.41
|
Most Recent Note - 3/30/2021 12:22:08 PM
Y - Perched within close striking distance of its all-time high. Its prior low ($24.13 on 3/25/21) and its 50 DMA line ($23.95) define important near-term support to watch where violations may trigger technical sell signals. Its Relative Strength Rating is 77, still below the 80+ minimum guideline.
>>> FEATURED STOCK ARTICLE : Prior High Defines Initial Support to Watch - 3/15/2021 |
View all notes |
Set NEW NOTE alert |
Company Profile |
SEC
News |
Chart |
Request a new note
C
A
S
I |
Symbol/Exchange
Company Name
Industry Group |
PRICE |
CHANGE
(%Change) |
Day High |
Volume
(% DAV)
(% 50 day avg vol) |
52 Wk Hi
% From Hi |
Featured
Date |
Price
Featured |
Pivot Featured |
|
Max Buy |
|
|
|
THESE ARE NOT BUY RECOMMENDATIONS!
Comments contained in the body of this report are technical
opinions only. The material herein has been obtained
from sources believed to be reliable and accurate, however,
its accuracy and completeness cannot be guaranteed.
This site is not an investment advisor, hence it does
not endorse or recommend any securities or other investments.
Any recommendation contained in this report may not
be suitable for all investors and it is not to be deemed
an offer or solicitation on our part with respect to
the purchase or sale of any securities. All trademarks,
service marks and trade names appearing in this report
are the property of their respective owners, and are
likewise used for identification purposes only.
This report is a service available
only to active Paid Premium Members.
You may opt-out of receiving report notifications
at any time. Questions or comments may be submitted
by writing to Premium Membership Services 665 S.E. 10 Street, Suite 201 Deerfield Beach, FL 33441-5634 or by calling 1-800-965-8307
or 954-785-1121.
|
|
|