You are not logged in.
This means you
CAN ONLY VIEW reports that were published prior to Thursday, March 20, 2025.
You
MUST UPGRADE YOUR MEMBERSHIP if you want to see any current reports.
AFTER MARKET UPDATE - WEDNESDAY, MARCH 31ST, 2021
Previous After Market Report Next After Market Report >>>
|
|
|
|
DOW |
-85.41 |
32,981.55 |
-0.26% |
|
Volume |
1,241,375,141 |
+41% |
|
Volume |
4,989,493,100 |
+7% |
|
NASDAQ |
+201.48 |
13,246.87 |
+1.54% |
|
Advancers |
1,770 |
55% |
|
Advancers |
2,494 |
62% |
|
S&P 500 |
+14.34 |
3,972.89 |
+0.36% |
|
Decliners |
1,452 |
45% |
|
Decliners |
1,496 |
37% |
|
Russell 2000 |
+24.72 |
2,220.52 |
+1.13% |
|
52 Wk Highs |
188 |
|
|
52 Wk Highs |
100 |
|
|
S&P 600 |
+3.14 |
1,319.35 |
+0.24% |
|
52 Wk Lows |
15 |
|
|
52 Wk Lows |
44 |
|
|
 |
Leadership Improved But Major Indices Ended Mixed
Kenneth J. Gruneisen - Passed the CAN SLIM® Master's Exam
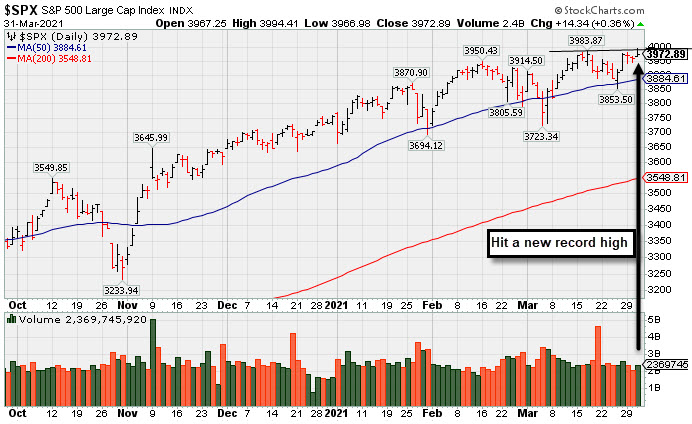
The S&P 500 advanced 0.4%, ending just shy of a new closing record and extending its monthly rise to 4.2%. The Dow fell 85 points, paring its robust March rally to 6.6%. The tech-heavy Nasdaq Composite jumped 1.5%, advancing for a fifth straight month with a 0.4% uptick. All three benchmarks rose for a fourth consecutive quarter, with the Dow gaining 7.8%, the S&P 500 climbing 5.8%, and the Nasdaq Composite adding 2.8%. The volume totals were higher than the prior session totals on the NYSE and on the Nasdaq exchange. Breadth was positive as advancers led decliners by a 6-5 margin on the NYSE and by a 5-3 margin on the Nasdaq exchange. Leadership improved as there were 32 high-ranked companies from the Leaders List that hit new 52-week highs and were listed on the BreakOuts Page, versus the total of 12 on the prior session. New 52-week highs expanded and outnumbered shrinking new 52-week lows on the NYSE on the Nasdaq exchange. The major indices (M criteria) are in a confirmed uptrend. Investors are reminded to always make buying and selling decisions on case-by-case basis under the strict criteria and rules of the fact-based investment system.
PICTURED: The S&P 500 Index hit a new record high. It found support at its 50-day moving average (DMA) line during the latest pullbacks.
U.S. stocks finished mostly higher on Wednesday amid a rally in tech and growth-oriented shares. Investors focused on the details of President Biden's infrastructure plan released ahead of his speech later this afternoon. The eight-year proposal would be worth $2.25 trillion and partially funded by an increase in the corporate tax rate to 28% from 21%. Treasuries declined, with the yield on the 10-year note adding three basis points to 1.74%, having jumped 34 basis points since the end of February and seeing its largest quarterly increase since the end of 2016. On the data front, a report from ADP showed U.S. private payrolls posted its biggest gain in six months in March.
Six of 11 S&P 500 sectors ended in negative territory. Energy stocks lagged, with WTI crude sliding 2% to $59.33/barrel after an OPEC+ panel meeting ended without an oil policy recommendation ahead of the group’s meeting tomorrow. Technology outperformed, with Apple (AAPL +1.88%) rising on the heels of an analyst upgrade. Microsoft (MSFT +1.69%) rose after winning a $22 billion contract to manufacture augmented reality headsets for the U.S. Army. |
 Kenneth J. Gruneisen started out as a licensed stockbroker in August 1987, a couple of months prior to the historic stock market crash that took the Dow Jones Industrial Average down -22.6% in a single day. He has published daily fact-based fundamental and technical analysis on high-ranked stocks online for two decades. Through FACTBASEDINVESTING.COM, Kenneth provides educational articles, news, market commentary, and other information regarding proven investment systems that work in good times and bad.
Comments contained in the body of this report are technical opinions only and are not necessarily those of Gruneisen Growth Corp. The material herein has been obtained from sources believed to be reliable and accurate, however, its accuracy and completeness cannot be guaranteed. Our firm, employees, and customers may effect transactions, including transactions contrary to any recommendation herein, or have positions in the securities mentioned herein or options with respect thereto. Any recommendation contained in this report may not be suitable for all investors and it is not to be deemed an offer or solicitation on our part with respect to the purchase or sale of any securities. |
|
 |
Semiconductor, Biotech, and Gold & Silver indexes Led Gainers
Kenneth J. Gruneisen - Passed the CAN SLIM® Master's Exam
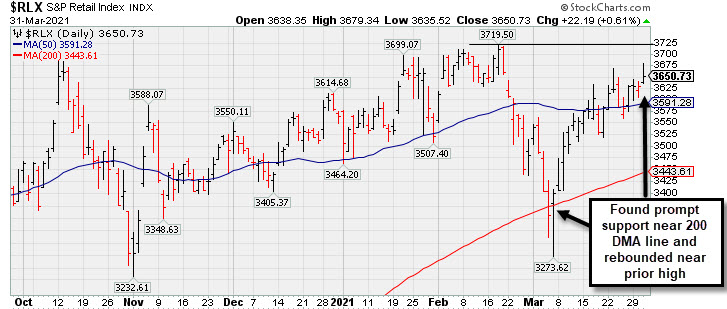
The Bank Index ($BKX -1.01%) lost ground while both the Broker/Dealer Index ($XBD +0.59%) and the Retail Index ($RLX +0.61%) posted modest gains that helped boost the major averages. The Semiconductor Index ($SOX +2.64%) and Biotech Index ($BTK +2.07%) led the tech sector higher, meanwhile, the Networking Index ($NWX -0.76%) lost ground. Energy-linked shares were mixed as the Oil Services Index ($OSX +0.77%) rose while the Integrated Oil Index ($XOI -0.96%) fell. Meanwhile, the Gold & Silver Index ($XAU +2.02%) posted a solid gain.PICTURED: The Retail Index ($RLX +0.61%) found support near its 200-day moving average (DMA) line and has rebounded near the prior high.
| Oil Services |
$OSX |
53.70 |
+0.41 |
+0.77% |
+21.13% |
| Integrated Oil |
$XOI |
1,007.45 |
-9.72 |
-0.96% |
+27.13% |
| Semiconductor |
$SOX |
3,124.94 |
+80.40 |
+2.64% |
+11.78% |
| Networking |
$NWX |
786.80 |
-6.01 |
-0.76% |
+9.72% |
| Broker/Dealer |
$XBD |
439.76 |
+2.58 |
+0.59% |
+16.46% |
| Retail |
$RLX |
3,650.73 |
+22.19 |
+0.61% |
+2.45% |
| Gold & Silver |
$XAU |
134.39 |
+2.66 |
+2.02% |
-6.80% |
| Bank |
$BKX |
120.14 |
-1.22 |
-1.01% |
+22.70% |
| Biotech |
$BTK |
5,479.34 |
+111.13 |
+2.07% |
-4.52% |
|
|
|
 |
Oppenheimer Consolidating Near Max Buy Level
Kenneth J. Gruneisen - Passed the CAN SLIM® Master's Exam
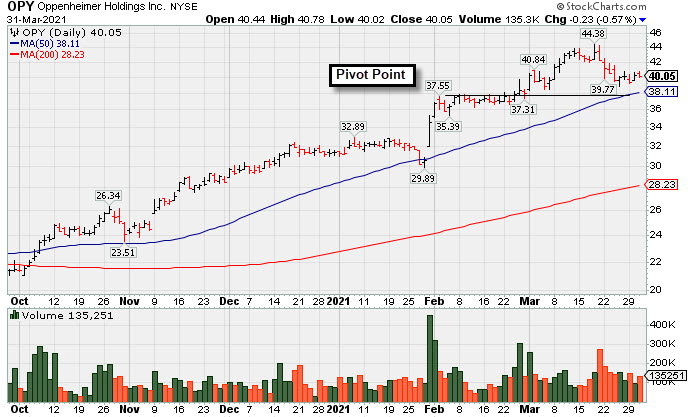
Oppenheimer Holdings Inc (OPY -$0.23 or -0.57% to $40.05) is consolidating near its "max buy" level after getting extended from the previously noted base. Its 50-day moving average (DMA) line ($38.15) defines near-term support to watch.
OPY was first highlighted in yellow with pivot point cited based on its 2/05/21 high plus 10 cents in the 2/25/21 mid-day report (read here). It was shown in the FSU section on 3/12/21 with an annotated graph under the headline, "Perched at Record High After 6 Consecutive Gains".
OPY made progress since noted in the 2/05/21 mid-day report - "Reported Dec '20 quarterly earnings +235% on +43% sales revenues versus the year ago period. Showed strong earnings increases over the year ago period in the past 3 quarterly comparisons. Annual earnings (A criteria) growth has been strong after a downturn and losses in FY '15 & '16." It has the highest possible Earnings Per Share Rating of 99.
The company hails from the FINANCIAL SERVICES - Investment Brokerage - Regional industry group which is now ranked 35th on the 197 Industry Groups list(L criteria). There is a small supply of only 9.2 million shares in the publicly traded float (S criteria) which can contribute to greater price volatility in the event of institutional buying or selling. The number of top-rated funds owning its shares reportedly fell from 212 in Jun '20 to 199 in Dec '20, however, its current Up/Down Volume Ratio of 1.2 is an unbiased indication its shares have been under slight accumulation over the past 50 days (I criteria).
|
|
|
Color Codes Explained :
Y - Better candidates highlighted by our
staff of experts.
G - Previously featured
in past reports as yellow but may no longer be buyable under the
guidelines.
***Last / Change / Volume data in this table is the closing quote data***
Symbol/Exchange
Company Name
Industry Group |
PRICE |
CHANGE
(%Change) |
Day High |
Volume
(% DAV)
(% 50 day avg vol) |
52 Wk Hi
% From Hi |
Featured
Date |
Price
Featured |
Pivot Featured |
|
Max Buy |
 FBC
-
NYSE
FBC
-
NYSE
Flagstar Bancorp Inc
BANKING - Savings and Loans
|
$45.10
|
-0.04
-0.09% |
$45.54
|
400,508
60.59% of 50 DAV
50 DAV is 661,000
|
$51.58
-12.56%
|
3/4/2021
|
$47.26
|
PP = $48.02
|
|
MB = $50.42
|
Most Recent Note - 3/29/2021 5:20:46 PM
G - Still sputtering below its 50 DMA line ($45.70) Only a prompt rebound would help its outlook improve. Near-term support to watch is prior lows.
>>> FEATURED STOCK ARTICLE : Slumping Into Prior Base Following Breakout - 3/22/2021 |
View all notes |
Set NEW NOTE alert |
Company Profile |
SEC
News |
Chart |
Request a new note
C
A
S
I |
CRL
-
NYSE
Charles River Labs Intl
DRUGS - Biotechnology
|
$289.83
|
+1.87
0.65% |
$296.50
|
549,924
176.82% of 50 DAV
50 DAV is 311,000
|
$303.79
-4.60%
|
12/17/2020
|
$247.06
|
PP = $257.98
|
|
MB = $270.88
|
 Most Recent Note - 3/31/2021 6:27:48 PM
G - Posted a gain today with above average volume but ended near the session low. Consolidating above its 50 DMA line ($280) which acted as support throughout its ongoing ascent. Its Relative Strength Rating is 75, below the 80+ minimum guideline for buy candidates. Recently reported Dec '20 quarterly earnings +19% on +14% sales revenues versus the year ago period, below the +25% minimum earnings guideline (C criteria), raising fundamental concerns.
>>> FEATURED STOCK ARTICLE : Made Gradual Progress, Now Extended From Any Sound Base - 3/16/2021 |
View all notes |
Set NEW NOTE alert |
Company Profile |
SEC
News |
Chart |
Request a new note
C
A
S
I |
OPY
-
NYSE
Oppenheimer Holdings Inc
FINANCIAL SERVICES - Investment Brokerage - Regiona
|
$40.05
|
-0.23
-0.57% |
$40.78
|
135,251
98.01% of 50 DAV
50 DAV is 138,000
|
$44.38
-9.76%
|
2/25/2021
|
$38.95
|
PP = $38.11
|
|
MB = $40.02
|
Most Recent Note - 3/31/2021 6:19:52 PM
Y - Consolidating near its "max buy" level after getting extended from the previously noted base. Its 50 DMA line ($38.15) defines near-term support to watch. See the latest FSU analysis for more details and a new annotated graph.
>>> FEATURED STOCK ARTICLE : Perched at Record High After 6 Consecutive Gains - 3/12/2021 |
View all notes |
Set NEW NOTE alert |
Company Profile |
SEC
News |
Chart |
Request a new note
C
A
S
I |
EDUC
-
NASDAQ
Educational Development
WHOLESALE - Basic Materials Wholesale
|
$17.05
|
-0.29
-1.67% |
$17.89
|
19,932
53.87% of 50 DAV
50 DAV is 37,000
|
$20.00
-14.75%
|
3/10/2021
|
$17.89
|
PP = $20.10
|
|
MB = $21.11
|
Most Recent Note - 3/30/2021 5:30:47 PM
Y - Recently found support above its 50 DMA line ($16.18) but it has met stubborn resistance in the $19-20 area. Subsequent gains above the pivot point backed by at least +40% above average volume are needed to trigger a proper technical buy signal. This thinly traded Media - Books firm's annual earnings (A criteria) history has strong. See the latest FSU analysis for more details and a new annotated graph.
>>> FEATURED STOCK ARTICLE : Consolidating Above 50 DMA Line Perched Near High - 3/30/2021 |
View all notes |
Set NEW NOTE alert |
Company Profile |
SEC
News |
Chart |
Request a new note
C
A
S
I |
SMPL
-
NASDAQ
Simply Good Foods Co
Food-Confectionery
|
$30.42
|
+0.09
0.30% |
$31.21
|
663,712
94.56% of 50 DAV
50 DAV is 701,900
|
$35.25
-13.70%
|
12/28/2020
|
$30.40
|
PP = $31.44
|
|
MB = $33.01
|
Most Recent Note - 3/30/2021 12:43:38 PM
G - Consolidating just above its 50 DMA line ($29.87), however, its Relative Strength Rating is 61, below the 80+ minimum guideline for buy candidates. Faces resistance due to overhead supply up to the $35 level.
>>> FEATURED STOCK ARTICLE : Violation of 50-Day Moving Average Triggered Technical Sell Signal - 3/24/2021 |
View all notes |
Set NEW NOTE alert |
Company Profile |
SEC
News |
Chart |
Request a new note
C
A
S
I |
Symbol/Exchange
Company Name
Industry Group |
PRICE |
CHANGE
(%Change) |
Day High |
Volume
(% DAV)
(% 50 day avg vol) |
52 Wk Hi
% From Hi |
Featured
Date |
Price
Featured |
Pivot Featured |
|
Max Buy |
UI
-
NYSE
Ubiquiti Inc
Telecom-Infrastructure
|
$298.30
|
-50.70
-14.53% |
$343.00
|
805,652
677.02% of 50 DAV
50 DAV is 119,000
|
$401.81
-25.76%
|
3/26/2021
|
$383.00
|
PP = $362.99
|
|
MB = $381.14
|
Most Recent Note - 3/31/2021 6:26:41 PM
G - Color code is changed to green after today's 3rd consecutive big loss with even heavier volume violated its 50 DMA line ($327) triggering a technical sell signal. It quickly negated the prior breakout raising immediate concerns. Prior low ($297) may act as support, meanwhile, a rebound above the 50 DMA line is needed for its outlook to improve.
>>> FEATURED STOCK ARTICLE : Volume +231% Above Average With Breakout Gain - 3/26/2021 |
View all notes |
Set NEW NOTE alert |
Company Profile |
SEC
News |
Chart |
Request a new note
C
A
S
I |
DT
-
NYSE
Dynatrace Inc
Computer Sftwr-Enterprse
|
$48.24
|
+1.52
3.25% |
$49.00
|
1,849,816
69.58% of 50 DAV
50 DAV is 2,658,500
|
$56.94
-15.28%
|
2/4/2021
|
$51.39
|
PP = $48.95
|
|
MB = $51.40
|
Most Recent Note - 3/31/2021 6:22:28 PM
G - Posted a gain with light volume today rebounding toward its 50 DMA line ($49.88) after damaging losses undercut prior highs in the $48 area. Its Relative Strength Rating is 59, well below the 80+ minimum guideline for buy candidates. Fundamentals remain strong after it reported Dec '20 earnings +70% on +28% sales revenues versus the year ago period.
>>> FEATURED STOCK ARTICLE : 50-Day Moving Average Line Tested Again - 3/19/2021 |
View all notes |
Set NEW NOTE alert |
Company Profile |
SEC
News |
Chart |
Request a new note
C
A
S
I |
MRBK
-
NASDAQ
Meridian Corp
Banks-Northeast
|
$26.00
|
-0.12
-0.46% |
$26.34
|
21,841
60.67% of 50 DAV
50 DAV is 36,000
|
$27.96
-7.01%
|
2/22/2021
|
$25.58
|
PP = $26.10
|
|
MB = $27.41
|
Most Recent Note - 3/30/2021 12:22:08 PM
Y - Perched within close striking distance of its all-time high. Its prior low ($24.13 on 3/25/21) and its 50 DMA line ($23.95) define important near-term support to watch where violations may trigger technical sell signals. Its Relative Strength Rating is 77, still below the 80+ minimum guideline.
>>> FEATURED STOCK ARTICLE : Prior High Defines Initial Support to Watch - 3/15/2021 |
View all notes |
Set NEW NOTE alert |
Company Profile |
SEC
News |
Chart |
Request a new note
C
A
S
I |
|
|
|
THESE ARE NOT BUY RECOMMENDATIONS!
Comments contained in the body of this report are technical
opinions only. The material herein has been obtained
from sources believed to be reliable and accurate, however,
its accuracy and completeness cannot be guaranteed.
This site is not an investment advisor, hence it does
not endorse or recommend any securities or other investments.
Any recommendation contained in this report may not
be suitable for all investors and it is not to be deemed
an offer or solicitation on our part with respect to
the purchase or sale of any securities. All trademarks,
service marks and trade names appearing in this report
are the property of their respective owners, and are
likewise used for identification purposes only.
This report is a service available
only to active Paid Premium Members.
You may opt-out of receiving report notifications
at any time. Questions or comments may be submitted
by writing to Premium Membership Services 665 S.E. 10 Street, Suite 201 Deerfield Beach, FL 33441-5634 or by calling 1-800-965-8307
or 954-785-1121.
|
|
|