You are not logged in.
This means you
CAN ONLY VIEW reports that were published prior to Thursday, March 20, 2025.
You
MUST UPGRADE YOUR MEMBERSHIP if you want to see any current reports.
AFTER MARKET UPDATE - WEDNESDAY, MARCH 24TH, 2021
Previous After Market Report Next After Market Report >>>
|
|
|
|
DOW |
-3.09 |
32,420.06 |
-0.01% |
|
Volume |
1,013,601,303 |
-5% |
|
Volume |
6,147,000,900 |
+11% |
|
NASDAQ |
-265.91 |
12,961.78 |
-2.01% |
|
Advancers |
1,388 |
43% |
|
Advancers |
984 |
25% |
|
S&P 500 |
-21.38 |
3,889.14 |
-0.55% |
|
Decliners |
1,832 |
57% |
|
Decliners |
2,977 |
75% |
|
Russell 2000 |
-51.42 |
2,134.27 |
-2.35% |
|
52 Wk Highs |
70 |
|
|
52 Wk Highs |
66 |
|
|
S&P 600 |
-22.42 |
1,266.83 |
-1.74% |
|
52 Wk Lows |
129 |
|
|
52 Wk Lows |
296 |
|
|
 |
Breadth Negative While Major Indices Stall and Slump
Kenneth J. Gruneisen - Passed the CAN SLIM® Master's Exam
The Dow faltered in the final hour of trading, reversing a more than 300 point gain to end 3 points lower, while the S&P 500 fell 0.6%. The tech-heavy Nasdaq Composite slumped 2%. The volume totals were mixed, lighter than the prior session total on the NYSE and higher on the Nasdaq exchange. Breadth was negative as decliners led advancers by a 9-7 margin on the NYSE and by a 3-1 margin on the Nasdaq exchange. Leadership remained thin as there were 8 high-ranked companies from the Leaders List that hit new 52-week highs and were listed on the BreakOuts Page, versus the total of 5 on the prior session. New 52-week lows totals swelled and outnumbered new 52-week highs totals on both the NYSE and the Nasdaq exchange. The major indices are in a confirmed uptrend (M criteria). Investors are reminded to always make buying and selling decisions on case-by-case basis under the strict criteria and rules of the fact-based investment system.
PICTURED: The Nasdaq Composite Index met resistance at its 50-day moving average (DMA) line. It is slumping back toward the prior low which defines important near-term chart support to watch.
U.S. equities ended lower on Wednesday, as growth stocks resumed their underperformance against their value-oriented counterparts. Treasuries advanced following solid demand for a record $61 billion five-year note auction, with the 10-year note yield falling one basis point to 1.61%.
Six of 11 S&P 500 sectors finished in negative territory, with Communication Services leading laggards. Energy stocks outperformed as WTI crude jumped 5.1% to $60.73/barrel after traffic was blocked in the Suez Canal, one of the world's busiest maritime trade routes. The Industrial group also bucked the downtrend, with Caterpillar (CAT +1.37%) rising. In corporate news, cruise liners slid after the CDC said it would maintain a rule limiting sailing until November 1. Elsewhere, Intel (INTC -2.27%) fell, reversing earlier gains that came after the chipmaker announced plans to build two new plants in Arizona. In earnings, General Mills (GIS -4.32%) fell following a disappointing profit tally.
On the data front, preliminary reports from research firm IHS Markit showed both U.S. manufacturing and services sector activity accelerated less than expected in March. Separately, durable goods orders declined 1.1% last month for its first drop since April. Meanwhile, Congressional testimony from Fed Chair Jerome Powell and Treasury Secretary Janet Yellen were in focus for a second day. The Fed Chief reiterated that the recent run-up in Treasury yields has been an orderly process and a signal of confidence. |
 Kenneth J. Gruneisen started out as a licensed stockbroker in August 1987, a couple of months prior to the historic stock market crash that took the Dow Jones Industrial Average down -22.6% in a single day. He has published daily fact-based fundamental and technical analysis on high-ranked stocks online for two decades. Through FACTBASEDINVESTING.COM, Kenneth provides educational articles, news, market commentary, and other information regarding proven investment systems that work in good times and bad.
Comments contained in the body of this report are technical opinions only and are not necessarily those of Gruneisen Growth Corp. The material herein has been obtained from sources believed to be reliable and accurate, however, its accuracy and completeness cannot be guaranteed. Our firm, employees, and customers may effect transactions, including transactions contrary to any recommendation herein, or have positions in the securities mentioned herein or options with respect thereto. Any recommendation contained in this report may not be suitable for all investors and it is not to be deemed an offer or solicitation on our part with respect to the purchase or sale of any securities. |
|
 |
Retail, Broker/Dealer, and Tech Indexes Fell
Kenneth J. Gruneisen - Passed the CAN SLIM® Master's Exam
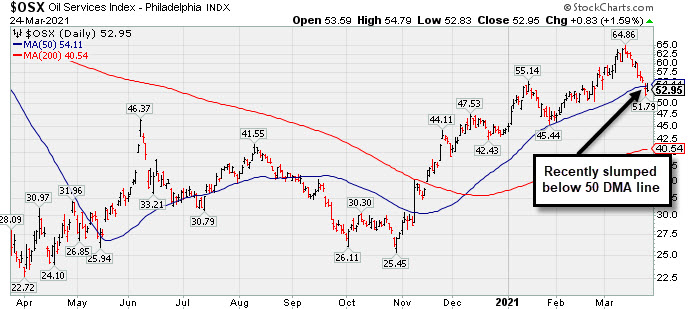
Losses for the Broker/Dealer Index ($XBD -1.49%) and Retail Index ($RLX -1.06%) created a drag on the major indices while the Bank Index ($BKX +0.01%) finished flat. The tech sector had a negative bias as the Semiconductor Index ($SOX -1.31%), Networking Index ($NWX -2.17%), and Biotech Index ($BTK -2.16%) suffered unanimous losses. Commodity-linked groups were mixed as the Oil Services Index ($OSX +1.50%) and Integrated Oil Index ($XOI +2.80%) both notched gains but the Gold & Silver Index ($XAU -1.17%) fell.
PICTURED: The Oil Services Index ($OSX +1.50%) recently slumped back below its 50-day moving average (DMA) line.
| Oil Services |
$OSX |
52.91 |
+0.78 |
+1.50% |
+19.35% |
| Integrated Oil |
$XOI |
1,009.13 |
+27.44 |
+2.80% |
+27.34% |
| Semiconductor |
$SOX |
2,955.09 |
-39.12 |
-1.31% |
+5.71% |
| Networking |
$NWX |
771.74 |
-17.15 |
-2.17% |
+7.62% |
| Broker/Dealer |
$XBD |
431.76 |
-6.54 |
-1.49% |
+14.34% |
| Retail |
$RLX |
3,583.33 |
-38.43 |
-1.06% |
+0.56% |
| Gold & Silver |
$XAU |
133.70 |
-1.59 |
-1.17% |
-7.28% |
| Bank |
$BKX |
116.07 |
+0.01 |
+0.01% |
+18.55% |
| Biotech |
$BTK |
5,329.50 |
-117.45 |
-2.16% |
-7.14% |
|
|
|
 |
Violation of 50-Day Moving Average Triggered Technical Sell Signal
Kenneth J. Gruneisen - Passed the CAN SLIM® Master's Exam
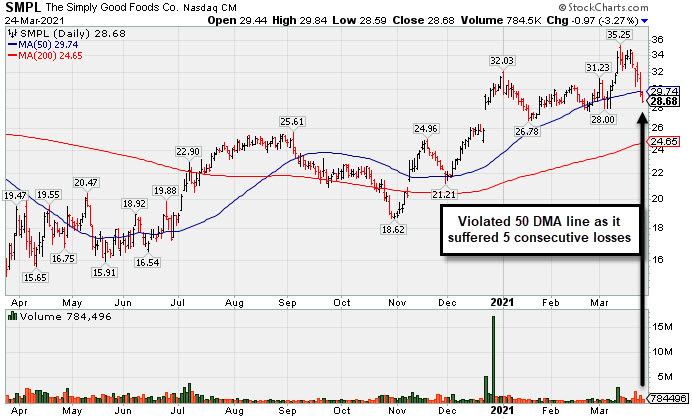
Simply Good Foods Co (SMPL -$0.97 or -3.27% to $28.68) violated its 50-day moving average (DMA) line ($29.74) and triggered a technical sell signal as it suffered a 5th consecutive loss. Its Relative Strength Rating has slumped to 64, below the 80+ minimum guideline for buy candidates. Its prior low ($26.78) defines the next important near term support to watch.
Fundamentals remain strong. It report Nov '20 quarterly earnings +32% on +52% sales revenues versus the year ago period, its 4th consecutive quarterly comparison above the +25% minimum earnings guideline (C criteria). Its annual earnings history (A criteria) has been strong.
SMPL completed a new Pubic Offering on 10/09/19. The company has a Timeliness Rating of C and Sponsorship Rating of C. The number of top-rated funds owning its shares fell from 442 in Dec '19 to 348 in Dec '20, and its current Up/Down Volume Ratio of 0.9 is an unbiased indication its shares have been under distributional pressure over the past 50 days.
Some leadership has been provided by other companies in the Food/Beverage Sector, however, the Food-Confectionery industry group has a Group Relative Strength Rating of 6 (E) which is a concern regarding the L criteria. There are only 5 companies listed in the group.
|
|
|
Color Codes Explained :
Y - Better candidates highlighted by our
staff of experts.
G - Previously featured
in past reports as yellow but may no longer be buyable under the
guidelines.
***Last / Change / Volume data in this table is the closing quote data***
Symbol/Exchange
Company Name
Industry Group |
PRICE |
CHANGE
(%Change) |
Day High |
Volume
(% DAV)
(% 50 day avg vol) |
52 Wk Hi
% From Hi |
Featured
Date |
Price
Featured |
Pivot Featured |
|
Max Buy |
 FBC
-
NYSE
FBC
-
NYSE
Flagstar Bancorp Inc
BANKING - Savings and Loans
|
$44.09
|
-0.90
-2.00% |
$46.94
|
440,687
66.27% of 50 DAV
50 DAV is 665,000
|
$51.58
-14.52%
|
3/4/2021
|
$47.26
|
PP = $48.02
|
|
MB = $50.42
|
Most Recent Note - 3/23/2021 4:21:06 PM
G - Suffered a 4th consecutive loss today with lighter volume and violated its 50 DMA line ($45.59) raising greater concerns. Color code is changed to green. Only a prompt rebound would help its outlook improve. Near-term support to watch is prior lows. See the latest FSU analysis for more details and an annotated graph.
>>> FEATURED STOCK ARTICLE : Slumping Into Prior Base Following Breakout - 3/22/2021 |
View all notes |
Set NEW NOTE alert |
Company Profile |
SEC
News |
Chart |
Request a new note
C
A
S
I |
CRL
-
NYSE
Charles River Labs Intl
DRUGS - Biotechnology
|
$276.21
|
-4.10
-1.46% |
$281.64
|
284,695
90.67% of 50 DAV
50 DAV is 314,000
|
$303.79
-9.08%
|
12/17/2020
|
$247.06
|
PP = $257.98
|
|
MB = $270.88
|
Most Recent Note - 3/23/2021 5:31:37 PM
G - Today's loss had lighter volume as it slumped near its 50 DMA line ($279) which acted as support throughout its ongoing ascent. Its Relative Strength Rating is 76, below the 80+ minimum guideline for buy candidates. Recently reported Dec '20 quarterly earnings +19% on +14% sales revenues versus the year ago period, below the +25% minimum earnings guideline (C criteria), raising fundamental concerns.
>>> FEATURED STOCK ARTICLE : Made Gradual Progress, Now Extended From Any Sound Base - 3/16/2021 |
View all notes |
Set NEW NOTE alert |
Company Profile |
SEC
News |
Chart |
Request a new note
C
A
S
I |
OPY
-
NYSE
Oppenheimer Holdings Inc
FINANCIAL SERVICES - Investment Brokerage - Regiona
|
$39.59
|
-0.93
-2.30% |
$41.59
|
143,545
108.75% of 50 DAV
50 DAV is 132,000
|
$44.38
-10.79%
|
2/25/2021
|
$38.95
|
PP = $38.11
|
|
MB = $40.02
|
 Most Recent Note - 3/24/2021 6:04:32 PM
Y - Color code is changed to yellow after closing below its "max buy" level with today's 4th consecutive loss on lighter volume. Its 50 DMA line ($37.39) defines near-term support to watch.
>>> FEATURED STOCK ARTICLE : Perched at Record High After 6 Consecutive Gains - 3/12/2021 |
View all notes |
Set NEW NOTE alert |
Company Profile |
SEC
News |
Chart |
Request a new note
C
A
S
I |
CLFD
-
NASDAQ
Clearfield Inc
TELECOMMUNICATIONS - Cables / Satalite Equipment
|
$29.69
|
+0.03
0.10% |
$31.24
|
303,959
172.70% of 50 DAV
50 DAV is 176,000
|
$38.75
-23.38%
|
1/20/2021
|
$31.38
|
PP = $28.42
|
|
MB = $29.84
|
Most Recent Note - 3/23/2021 4:12:07 PM
G - Sank further below its 50 DMA line ($32.62) with today's 4th consecutive damaging loss. Prior highs in the $28 area previously acted as support. Fundamentals remain strong.
>>> FEATURED STOCK ARTICLE : Quiet Gain Repaired 50-Day Moving Average Violation - 3/9/2021 |
View all notes |
Set NEW NOTE alert |
Company Profile |
SEC
News |
Chart |
Request a new note
C
A
S
I |
EDUC
-
NASDAQ
Educational Development
WHOLESALE - Basic Materials Wholesale
|
$16.89
|
-0.45
-2.60% |
$17.90
|
14,520
38.21% of 50 DAV
50 DAV is 38,000
|
$20.00
-15.55%
|
3/10/2021
|
$17.89
|
PP = $20.10
|
|
MB = $21.11
|
Most Recent Note - 3/23/2021 5:29:49 PM
Y - Retreating after challenging its 52-week high. Subsequent gains above the pivot point backed by at least +40% above average volume are needed to trigger a proper technical buy signal. This thinly traded Media - Books firm's annual earnings (A criteria) history has strong.
>>> FEATURED STOCK ARTICLE : Gain Leaves Media - Books Firm Perched Near Pivot Point - 3/10/2021 |
View all notes |
Set NEW NOTE alert |
Company Profile |
SEC
News |
Chart |
Request a new note
C
A
S
I |
Symbol/Exchange
Company Name
Industry Group |
PRICE |
CHANGE
(%Change) |
Day High |
Volume
(% DAV)
(% 50 day avg vol) |
52 Wk Hi
% From Hi |
Featured
Date |
Price
Featured |
Pivot Featured |
|
Max Buy |
SMPL
-
NASDAQ
Simply Good Foods Co
Food-Confectionery
|
$28.68
|
-0.97
-3.27% |
$29.84
|
784,496
112.49% of 50 DAV
50 DAV is 697,400
|
$35.25
-18.64%
|
12/28/2020
|
$30.40
|
PP = $31.44
|
|
MB = $33.01
|
Most Recent Note - 3/24/2021 6:00:52 PM
G - Violated its 50 DMA line ($29.76) triggering a technical sell signal with 5 consecutive damaging losses. Only a prompt rebound would help its outlook improve. Its Relative Strength Rating is 64, below the 80+ minimum guideline for buy candidates. See the latest FSU analysis for more details and a new annotated graph.
>>> FEATURED STOCK ARTICLE : Violation of 50-Day Moving Average Triggered Technical Sell Signal - 3/24/2021 |
View all notes |
Set NEW NOTE alert |
Company Profile |
SEC
News |
Chart |
Request a new note
C
A
S
I |
XPEL
-
NASDAQ
Xpel Inc
Auto/Truck-Tires andamp; Misc
|
$51.36
|
-1.86
-3.49% |
$54.62
|
183,254
60.48% of 50 DAV
50 DAV is 303,000
|
$65.74
-21.87%
|
3/11/2021
|
$59.70
|
PP = $60.87
|
|
MB = $63.91
|
Most Recent Note - 3/23/2021 4:17:36 PM
G - Today's loss violated its 50 DMA line ($54.16) triggering a technical sell signal. Color code is changed to green. Only a prompt rebound would help its outlook improve.
>>> FEATURED STOCK ARTICLE : Powerful Breakout Backed by Heavy Volume - 3/11/2021 |
View all notes |
Set NEW NOTE alert |
Company Profile |
SEC
News |
Chart |
Request a new note
C
A
S
I |
DT
-
NYSE
Dynatrace Inc
Computer Sftwr-Enterprse
|
$48.04
|
-2.56
-5.06% |
$51.37
|
2,035,276
76.83% of 50 DAV
50 DAV is 2,649,000
|
$56.94
-15.63%
|
2/4/2021
|
$51.39
|
PP = $48.95
|
|
MB = $51.40
|
Most Recent Note - 3/24/2021 6:07:05 PM
G - Color code is changed to green after today's big loss violated its 50 DMA line ($49.46) raising concerns. Prior highs in the $48 area help define import near-term support. More damaging losses would raise serious concerns. Its Relative Strength Rating has slumped to 54, well below the 80+ minimum guideline for buy candidates. Fundamentals remain strong after it reported Dec '20 earnings +70% on +28% sales revenues versus the year ago period.
>>> FEATURED STOCK ARTICLE : 50-Day Moving Average Line Tested Again - 3/19/2021 |
View all notes |
Set NEW NOTE alert |
Company Profile |
SEC
News |
Chart |
Request a new note
C
A
S
I |
MRBK
-
NASDAQ
Meridian Corp
Banks-Northeast
|
$25.23
|
-0.35
-1.37% |
$26.67
|
41,814
122.98% of 50 DAV
50 DAV is 34,000
|
$27.96
-9.76%
|
2/22/2021
|
$25.58
|
PP = $26.10
|
|
MB = $27.41
|
Most Recent Note - 3/24/2021 6:02:32 PM
Y - Reversed an early gain and closed near the session low with today's 3rd consecutive loss. Prior high defines initial support to watch above its 50 DMA line ($23.57) on pullbacks.
>>> FEATURED STOCK ARTICLE : Prior High Defines Initial Support to Watch - 3/15/2021 |
View all notes |
Set NEW NOTE alert |
Company Profile |
SEC
News |
Chart |
Request a new note
C
A
S
I |
|
|
|
THESE ARE NOT BUY RECOMMENDATIONS!
Comments contained in the body of this report are technical
opinions only. The material herein has been obtained
from sources believed to be reliable and accurate, however,
its accuracy and completeness cannot be guaranteed.
This site is not an investment advisor, hence it does
not endorse or recommend any securities or other investments.
Any recommendation contained in this report may not
be suitable for all investors and it is not to be deemed
an offer or solicitation on our part with respect to
the purchase or sale of any securities. All trademarks,
service marks and trade names appearing in this report
are the property of their respective owners, and are
likewise used for identification purposes only.
This report is a service available
only to active Paid Premium Members.
You may opt-out of receiving report notifications
at any time. Questions or comments may be submitted
by writing to Premium Membership Services 665 S.E. 10 Street, Suite 201 Deerfield Beach, FL 33441-5634 or by calling 1-800-965-8307
or 954-785-1121.
|
|
|