You are not logged in.
This means you
CAN ONLY VIEW reports that were published prior to Thursday, March 20, 2025.
You
MUST UPGRADE YOUR MEMBERSHIP if you want to see any current reports.
AFTER MARKET UPDATE - TUESDAY, MARCH 30TH, 2021
Previous After Market Report Next After Market Report >>>
|
|
|
|
DOW |
-104.41 |
33,066.96 |
-0.31% |
|
Volume |
882,944,704 |
-19% |
|
Volume |
4,650,484,000 |
-3% |
|
NASDAQ |
-24.12 |
13,035.52 |
-0.18% |
|
Advancers |
2,060 |
63% |
|
Advancers |
2,418 |
60% |
|
S&P 500 |
-12.54 |
3,958.55 |
-0.32% |
|
Decliners |
1,198 |
37% |
|
Decliners |
1,642 |
40% |
|
Russell 2000 |
+37.11 |
2,195.80 |
+1.72% |
|
52 Wk Highs |
119 |
|
|
52 Wk Highs |
73 |
|
|
S&P 600 |
+19.41 |
1,316.21 |
+1.50% |
|
52 Wk Lows |
37 |
|
|
52 Wk Lows |
95 |
|
|
 |
Major Indices Slipped and Leadership Thinned
Kenneth J. Gruneisen - Passed the CAN SLIM® Master's Exam
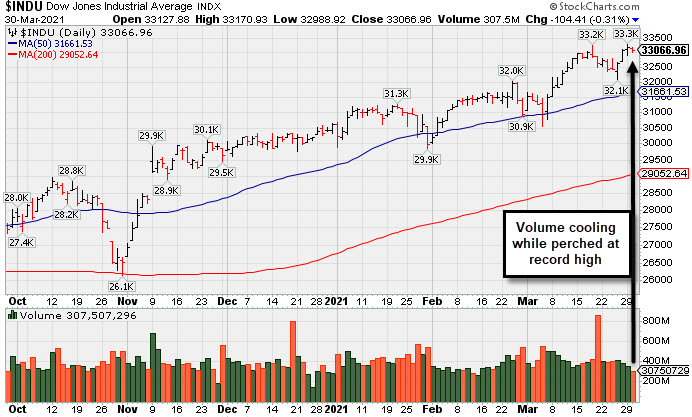
The Dow shed 104 points, drifting from Monday’s all-time closing high. The S&P 500 slipped 0.3%, while the tech-heavy Nasdaq Composite lost 0.1%, set to snap a four-month winning streak. The small-cap Russell 2000 recovered some of yesterday’s losses, jumping 1.5%. The volume totals were lighter than the prior session totals on the NYSE and on the Nasdaq exchange. Breadth was positive as advancers led decliners by a 5-3 margin on the NYSE and by a 3-2 margin on the Nasdaq exchange. Leadership thinned as there were 12 high-ranked companies from the Leaders List that hit new 52-week highs and were listed on the BreakOuts Page, versus the total of 42 on the prior session. New 52-week highs outnumbered new 52-week lows on the NYSE but new lows outnumbered new highs on the Nasdaq exchange. The major indices (M criteria) are in an uptrend under pressure. Investors are reminded to always make buying and selling decisions on case-by-case basis under the strict criteria and rules of the fact-based investment system.
PICTURED: The Dow Jones Industrial Average has seen volume totals cooling while perched at a record high. It stayed well above its 50-day moving average (DMA) line during the latest pullback.
U.S. stocks finished lower on Tuesday as investors monitored Treasury yields and anxiously await tomorrow’s details of President Biden’s $4 trillion infrastructure plan. The yield on the 10-year note ended the day unchanged at 1.71% but reached its highest level since January 2020 in earlier trading (1.77%).
Eight of 11 S&P 500 sectors finished lower, with Technology among the laggards. Shares of Apple and Microsoft each shed more than 1%. Elsewhere, Viacom CBS (VIAC +3.55%) and Discovery Communications (DISCA +5.36%) rebounded from their recent sell-off fueled by the Archegos Capital Management fallout. However, banks with ties to the selling continued to underperform, with Credit Suisse (CS -3.51%) and Nomura (NMR -2.29%) both falling. In other corporate news, BioNTech (BNTX +8.9%) jumped after boosting its COVID-19 manufacturing goal to 2.5 billion doses by year-end.
On the data front, the Conference Board's gauge of consumer confidence surged to a one-year high of 109.7 in March, blowing past expectations of 96.9 and the prior month's downwardly revised 90.4 reading. Another release from S&P CoreLogic Case Shiller revealed national home prices increased 11.2% year-over-year in January, the largest gain since February 2006 as historically low mortgage rates continued to spark a rally in the real estate market. In commodities, WTI crude fell 1.9% to $60.38/barrel amid a stronger U.S. dollar. |
 Kenneth J. Gruneisen started out as a licensed stockbroker in August 1987, a couple of months prior to the historic stock market crash that took the Dow Jones Industrial Average down -22.6% in a single day. He has published daily fact-based fundamental and technical analysis on high-ranked stocks online for two decades. Through FACTBASEDINVESTING.COM, Kenneth provides educational articles, news, market commentary, and other information regarding proven investment systems that work in good times and bad.
Comments contained in the body of this report are technical opinions only and are not necessarily those of Gruneisen Growth Corp. The material herein has been obtained from sources believed to be reliable and accurate, however, its accuracy and completeness cannot be guaranteed. Our firm, employees, and customers may effect transactions, including transactions contrary to any recommendation herein, or have positions in the securities mentioned herein or options with respect thereto. Any recommendation contained in this report may not be suitable for all investors and it is not to be deemed an offer or solicitation on our part with respect to the purchase or sale of any securities. |
|
 |
Financial Groups Rose; Tech Indexes and Gold & Silver Fell
Kenneth J. Gruneisen - Passed the CAN SLIM® Master's Exam
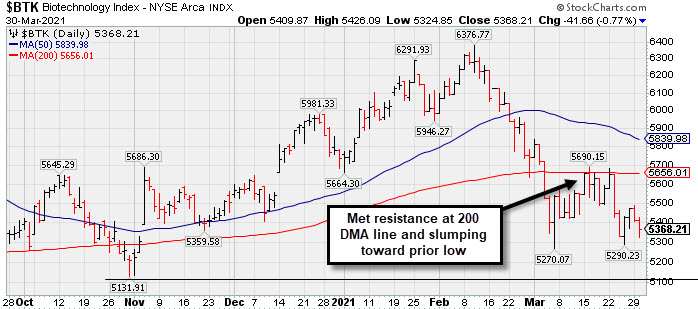
The Bank Index ($BKX +2.10%) and Broker/Dealer Index ($XBD +0.48%) both notched gains while the Retail Index ($RLX -0.03%) finished flat. The tech sector had a negative bias as the Networking Index ($NWX -1.19%) and Biotech Index ($BTK -0.77%) both outpaced the Semiconductor Index ($SOX -0.25%) to the downside. The Oil Services Index ($OSX +0.01%) was unchanged and the Integrated Oil Index ($XOI -0.39%) edged lower, meanwhile the Gold & Silver Index ($XAU -3.06%) was a standout decliner.PICTURED: The Biotech Index ($BTK -0.77%) has been slumping below its 200-day moving average (DMA) line, which acted as resistance, toward the prior low.
| Oil Services |
$OSX |
53.29 |
+0.01 |
+0.01% |
+20.20% |
| Integrated Oil |
$XOI |
1,017.17 |
-4.03 |
-0.39% |
+28.35% |
| Semiconductor |
$SOX |
3,047.03 |
-7.60 |
-0.25% |
+9.00% |
| Networking |
$NWX |
792.82 |
-9.55 |
-1.19% |
+10.56% |
| Broker/Dealer |
$XBD |
437.19 |
+2.10 |
+0.48% |
+15.78% |
| Retail |
$RLX |
3,628.54 |
-0.96 |
-0.03% |
+1.83% |
| Gold & Silver |
$XAU |
131.73 |
-4.15 |
-3.06% |
-8.64% |
| Bank |
$BKX |
121.36 |
+2.49 |
+2.10% |
+23.95% |
| Biotech |
$BTK |
5,368.21 |
-41.66 |
-0.77% |
-6.46% |
|
|
|
 |
Consolidating Above 50 DMA Line Perched Near High
Kenneth J. Gruneisen - Passed the CAN SLIM® Master's Exam
Educational Development (EDUC -$0.90 or -4.93% to $17.34) recently found support above its 50-day moving average (DMA) line ($16.19) but it has met stubborn resistance in the $19-20 area. Subsequent gains above the pivot point backed by at least +40% above average volume are needed to trigger a proper technical buy signal. This thinly traded Media - Books firm's annual earnings (A criteria) history has strong.
It found support at its 200-day moving average (DMA) line ($15.13) since noted with caution in the 10/22/20 mid-day report. It also reported earnings +55% on +63% sales revenues for the Nov '20 quarter versus the year-ago period, marking its 3rd strong quarterly comparison above the +25% minimum guideline (C criteria), helping it better match with the fact-based investment system's fundamental guidelines. This thinly traded Media - Books firm's annual earnings (A criteria) history has strong and its Earnings Per Share Rating is 98. Share price was impacted by a 2-1 split as of 8/23/18.
The number of top-rated funds owning its shares rose from 34 in Mar '20 to 48 in Dec '20 a reassuring sign concerning the I criteria. It has a small supply of only 6.1 million share in the float (S criteria) which can contribute to greater price volatility in the even of institutional buying or selling. The Media-Books industry group currently has a B (61) Group Relative Strength Rating. |
|
|
Color Codes Explained :
Y - Better candidates highlighted by our
staff of experts.
G - Previously featured
in past reports as yellow but may no longer be buyable under the
guidelines.
***Last / Change / Volume data in this table is the closing quote data***
Symbol/Exchange
Company Name
Industry Group |
PRICE |
CHANGE
(%Change) |
Day High |
Volume
(% DAV)
(% 50 day avg vol) |
52 Wk Hi
% From Hi |
Featured
Date |
Price
Featured |
Pivot Featured |
|
Max Buy |
 FBC
-
NYSE
FBC
-
NYSE
Flagstar Bancorp Inc
BANKING - Savings and Loans
|
$45.14
|
+0.25
0.56% |
$45.69
|
244,245
36.56% of 50 DAV
50 DAV is 668,000
|
$51.58
-12.49%
|
3/4/2021
|
$47.26
|
PP = $48.02
|
|
MB = $50.42
|
Most Recent Note - 3/29/2021 5:20:46 PM
G - Still sputtering below its 50 DMA line ($45.70) Only a prompt rebound would help its outlook improve. Near-term support to watch is prior lows.
>>> FEATURED STOCK ARTICLE : Slumping Into Prior Base Following Breakout - 3/22/2021 |
View all notes |
Set NEW NOTE alert |
Company Profile |
SEC
News |
Chart |
Request a new note
C
A
S
I |
CRL
-
NYSE
Charles River Labs Intl
DRUGS - Biotechnology
|
$287.96
|
+5.01
1.77% |
$288.94
|
305,454
98.22% of 50 DAV
50 DAV is 311,000
|
$303.79
-5.21%
|
12/17/2020
|
$247.06
|
PP = $257.98
|
|
MB = $270.88
|
Most Recent Note - 3/29/2021 5:19:13 PM
G - Today's loss had lighter volume. Consolidating above its 50 DMA line ($280) which acted as support throughout its ongoing ascent. Its Relative Strength Rating is 75, below the 80+ minimum guideline for buy candidates. Recently reported Dec '20 quarterly earnings +19% on +14% sales revenues versus the year ago period, below the +25% minimum earnings guideline (C criteria), raising fundamental concerns.
>>> FEATURED STOCK ARTICLE : Made Gradual Progress, Now Extended From Any Sound Base - 3/16/2021 |
View all notes |
Set NEW NOTE alert |
Company Profile |
SEC
News |
Chart |
Request a new note
C
A
S
I |
OPY
-
NYSE
Oppenheimer Holdings Inc
FINANCIAL SERVICES - Investment Brokerage - Regiona
|
$40.28
|
+0.91
2.31% |
$40.57
|
95,850
69.96% of 50 DAV
50 DAV is 137,000
|
$44.38
-9.24%
|
2/25/2021
|
$38.95
|
PP = $38.11
|
|
MB = $40.02
|
 Most Recent Note - 3/30/2021 12:42:27 PM
Y - Consolidating near its "max buy" level after getting extended from the previously noted base. Its 50 DMA line ($38) defines near-term support to watch.
>>> FEATURED STOCK ARTICLE : Perched at Record High After 6 Consecutive Gains - 3/12/2021 |
View all notes |
Set NEW NOTE alert |
Company Profile |
SEC
News |
Chart |
Request a new note
C
A
S
I |
EDUC
-
NASDAQ
Educational Development
WHOLESALE - Basic Materials Wholesale
|
$17.34
|
-0.90
-4.93% |
$18.10
|
17,061
44.90% of 50 DAV
50 DAV is 38,000
|
$20.00
-13.30%
|
3/10/2021
|
$17.89
|
PP = $20.10
|
|
MB = $21.11
|
Most Recent Note - 3/30/2021 5:30:47 PM
Y - Recently found support above its 50 DMA line ($16.18) but it has met stubborn resistance in the $19-20 area. Subsequent gains above the pivot point backed by at least +40% above average volume are needed to trigger a proper technical buy signal. This thinly traded Media - Books firm's annual earnings (A criteria) history has strong. See the latest FSU analysis for more details and a new annotated graph.
>>> FEATURED STOCK ARTICLE : Consolidating Above 50 DMA Line Perched Near High - 3/30/2021 |
View all notes |
Set NEW NOTE alert |
Company Profile |
SEC
News |
Chart |
Request a new note
C
A
S
I |
SMPL
-
NASDAQ
Simply Good Foods Co
Food-Confectionery
|
$30.33
|
+0.56
1.88% |
$30.66
|
565,733
80.73% of 50 DAV
50 DAV is 700,800
|
$35.25
-13.96%
|
12/28/2020
|
$30.40
|
PP = $31.44
|
|
MB = $33.01
|
Most Recent Note - 3/30/2021 12:43:38 PM
G - Consolidating just above its 50 DMA line ($29.87), however, its Relative Strength Rating is 61, below the 80+ minimum guideline for buy candidates. Faces resistance due to overhead supply up to the $35 level.
>>> FEATURED STOCK ARTICLE : Violation of 50-Day Moving Average Triggered Technical Sell Signal - 3/24/2021 |
View all notes |
Set NEW NOTE alert |
Company Profile |
SEC
News |
Chart |
Request a new note
C
A
S
I |
Symbol/Exchange
Company Name
Industry Group |
PRICE |
CHANGE
(%Change) |
Day High |
Volume
(% DAV)
(% 50 day avg vol) |
52 Wk Hi
% From Hi |
Featured
Date |
Price
Featured |
Pivot Featured |
|
Max Buy |
UI
-
NYSE
Ubiquiti Inc
Telecom-Infrastructure
|
$349.00
|
-27.78
-7.37% |
$379.58
|
217,874
184.64% of 50 DAV
50 DAV is 118,000
|
$401.81
-13.14%
|
3/26/2021
|
$383.00
|
PP = $362.99
|
|
MB = $381.14
|
Most Recent Note - 3/30/2021 5:35:48 PM
Y - Today's big loss on higher volume completely negated the prior breakout raising concerns after a "negative reversal" at its all-time high. Its 50 DMA line ($327) defines important near-term support.
>>> FEATURED STOCK ARTICLE : Volume +231% Above Average With Breakout Gain - 3/26/2021 |
View all notes |
Set NEW NOTE alert |
Company Profile |
SEC
News |
Chart |
Request a new note
C
A
S
I |
DT
-
NYSE
Dynatrace Inc
Computer Sftwr-Enterprse
|
$46.72
|
-0.03
-0.06% |
$47.20
|
1,910,976
72.00% of 50 DAV
50 DAV is 2,654,300
|
$56.94
-17.95%
|
2/4/2021
|
$51.39
|
PP = $48.95
|
|
MB = $51.40
|
Most Recent Note - 3/30/2021 12:02:05 PM
G - Sputtering well below its 50 DMA line ($49.79), sinking below prior highs in the $48 area with today's 6th consecutive loss raising more serious concerns. Its Relative Strength Rating is 58, well below the 80+ minimum guideline for buy candidates. Fundamentals remain strong after it reported Dec '20 earnings +70% on +28% sales revenues versus the year ago period.
>>> FEATURED STOCK ARTICLE : 50-Day Moving Average Line Tested Again - 3/19/2021 |
View all notes |
Set NEW NOTE alert |
Company Profile |
SEC
News |
Chart |
Request a new note
C
A
S
I |
MRBK
-
NASDAQ
Meridian Corp
Banks-Northeast
|
$26.12
|
+0.74
2.92% |
$27.20
|
37,226
106.36% of 50 DAV
50 DAV is 35,000
|
$27.96
-6.58%
|
2/22/2021
|
$25.58
|
PP = $26.10
|
|
MB = $27.41
|
Most Recent Note - 3/30/2021 12:22:08 PM
Y - Perched within close striking distance of its all-time high. Its prior low ($24.13 on 3/25/21) and its 50 DMA line ($23.95) define important near-term support to watch where violations may trigger technical sell signals. Its Relative Strength Rating is 77, still below the 80+ minimum guideline.
>>> FEATURED STOCK ARTICLE : Prior High Defines Initial Support to Watch - 3/15/2021 |
View all notes |
Set NEW NOTE alert |
Company Profile |
SEC
News |
Chart |
Request a new note
C
A
S
I |
|
|
|
THESE ARE NOT BUY RECOMMENDATIONS!
Comments contained in the body of this report are technical
opinions only. The material herein has been obtained
from sources believed to be reliable and accurate, however,
its accuracy and completeness cannot be guaranteed.
This site is not an investment advisor, hence it does
not endorse or recommend any securities or other investments.
Any recommendation contained in this report may not
be suitable for all investors and it is not to be deemed
an offer or solicitation on our part with respect to
the purchase or sale of any securities. All trademarks,
service marks and trade names appearing in this report
are the property of their respective owners, and are
likewise used for identification purposes only.
This report is a service available
only to active Paid Premium Members.
You may opt-out of receiving report notifications
at any time. Questions or comments may be submitted
by writing to Premium Membership Services 665 S.E. 10 Street, Suite 201 Deerfield Beach, FL 33441-5634 or by calling 1-800-965-8307
or 954-785-1121.
|
|
|