You are not logged in.
This means you
CAN ONLY VIEW reports that were published prior to Thursday, March 20, 2025.
You
MUST UPGRADE YOUR MEMBERSHIP if you want to see any current reports.
AFTER MARKET UPDATE - THURSDAY, APRIL 15TH, 2021
Previous After Market Report Next After Market Report >>>
|
|
|
|
DOW |
+305.10 |
34,035.99 |
+0.90% |
|
Volume |
849,034,920 |
-1% |
|
Volume |
4,349,159,300 |
+7% |
|
NASDAQ |
+177.97 |
14,035.81 |
+1.28% |
|
Advancers |
2,051 |
64% |
|
Advancers |
2,032 |
50% |
|
S&P 500 |
+45.76 |
4,170.42 |
+1.11% |
|
Decliners |
1,164 |
36% |
|
Decliners |
2,040 |
50% |
|
Russell 2000 |
+9.35 |
2,257.07 |
+0.42% |
|
52 Wk Highs |
318 |
|
|
52 Wk Highs |
200 |
|
|
S&P 600 |
+4.53 |
1,343.89 |
+0.34% |
|
52 Wk Lows |
25 |
|
|
52 Wk Lows |
60 |
|
|
 |
Major Indices Rose and Dow Topped 34,000
Kenneth J. Gruneisen - Passed the CAN SLIM® Master's Exam
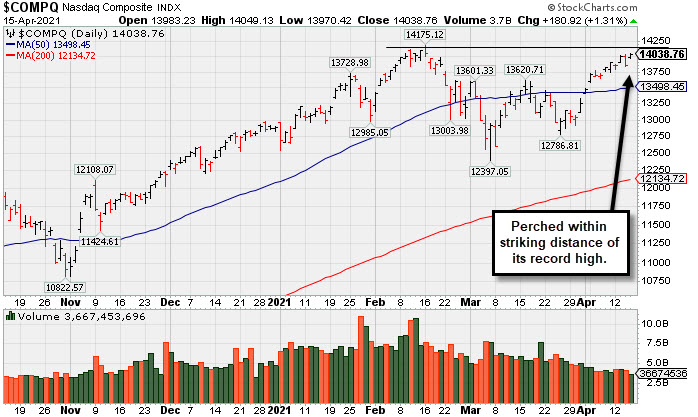
The Dow jumped 305 points, surpassing the 34,000 level for the first time, while the S&P 500 also closed at a fresh all-time high, up 1.1%. The Nasdaq Composite rallied 1.3% amid strength in Tech and growth-oriented shares, now within 0.5% of its February 12 record level. The volume totals were mixed, lighter than the prior session on the NYSE, and higher on the Nasdaq exchange. Advancers led decliners by almost a 2-1 margin on the NYSE while the mix was near even on the Nasdaq exchange. There were 39 high-ranked companies from the Leaders List that hit new 52-week highs and were listed on the BreakOuts Page, versus the total of 38 on the prior session. New 52-week highs totals expanded and solidly outnumbered new 52-week lows on the NYSE on the Nasdaq exchange. The major indices (M criteria) are in a confirmed uptrend. Investors are reminded to always make buying and selling decisions on case-by-case basis under the strict criteria and rules of the fact-based investment system.
PICTURED: The Nasdaq Composite Index is perched very near its record high.
Stocks finished firmly higher on Thursday as investors digested an influx of upbeat corporate earnings and economic reports. On the data front, retail sales surged 9.8% in March, above estimates of a 5.8% gain as consumer spending benefited from the latest round of stimulus checks. Separately, initial jobless claims eased more than expected, coming in at 576,000 in the week ending April 10 and dropping to a one-year low. Treasuries strengthened despite the positive reports, with the yield on the 10-year note down eight basis points to 1.55%, a four-week low. In commodities, WTI crude added 0.3% to $63.32/barrel, holding near its best level in a month.
Nine of 11 S&P 500 sectors closed in positive territory. Financials lagged despite another day of strong earnings reports from major financial institutions. Bank of America (BAC -2.86%) fell as tepid loan growth and higher expenses overshadowed robust first quarter results. BlackRock (BLK +2.09%) rose as the world's largest asset manager saw $172 billion in total net inflows during the first quarter, up from $127 billion the previous quarter. Health Care stocks outperformed, helped by UnitedHealth Group (UHG +3. 83%) as the managed care provider delivered a top and bottom line beat and raised its full-year outlook. |
 Kenneth J. Gruneisen started out as a licensed stockbroker in August 1987, a couple of months prior to the historic stock market crash that took the Dow Jones Industrial Average down -22.6% in a single day. He has published daily fact-based fundamental and technical analysis on high-ranked stocks online for two decades. Through FACTBASEDINVESTING.COM, Kenneth provides educational articles, news, market commentary, and other information regarding proven investment systems that work in good times and bad.
Comments contained in the body of this report are technical opinions only and are not necessarily those of Gruneisen Growth Corp. The material herein has been obtained from sources believed to be reliable and accurate, however, its accuracy and completeness cannot be guaranteed. Our firm, employees, and customers may effect transactions, including transactions contrary to any recommendation herein, or have positions in the securities mentioned herein or options with respect thereto. Any recommendation contained in this report may not be suitable for all investors and it is not to be deemed an offer or solicitation on our part with respect to the purchase or sale of any securities. |
|
 |
Gold & Silver, Tech, and Retail Indexes Rose
Kenneth J. Gruneisen - Passed the CAN SLIM® Master's Exam
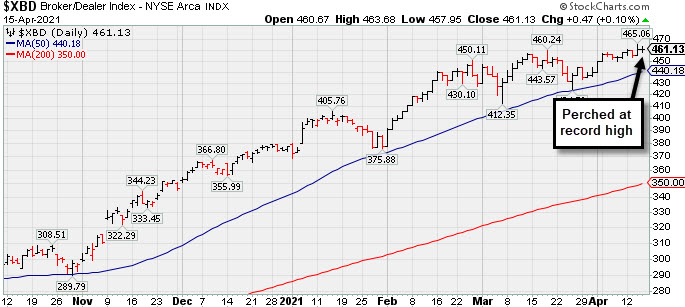
The Semiconductor Index ($SOX +1.81%) led the tech sector while the Biotech Index ($BTK +1.22%) and the Networking Index ($NWX +0.46%) also posted gains. The Retail Index ($RLX +1.17%) posted a solid gain while the Broker/Dealer Index ($XBD +0.10%) was little changed and the Bank Index ($BKX -1.02%) fell. Commodity-linked groups were mixed as the Gold & Silver Index ($XAU +4.24%) posted a standout gain but the Oil Services Index ($OSX -2.07%) and Integrated Oil Index ($XOI -1.06%) both lost ground. PICTURED: The Broker/Dealer Index ($XBD +0.10%) is perched at its record high.
| Oil Services |
$OSX |
52.56 |
-1.11 |
-2.07% |
+18.56% |
| Integrated Oil |
$XOI |
1,009.03 |
-10.77 |
-1.06% |
+27.33% |
| Semiconductor |
$SOX |
3,272.04 |
+58.16 |
+1.81% |
+17.05% |
| Networking |
$NWX |
810.59 |
+3.69 |
+0.46% |
+13.03% |
| Broker/Dealer |
$XBD |
461.13 |
+0.47 |
+0.10% |
+22.12% |
| Retail |
$RLX |
3,924.09 |
+45.27 |
+1.17% |
+10.13% |
| Gold & Silver |
$XAU |
148.15 |
+6.02 |
+4.24% |
+2.75% |
| Bank |
$BKX |
122.45 |
-1.26 |
-1.02% |
+25.06% |
| Biotech |
$BTK |
5,551.67 |
+67.11 |
+1.22% |
-3.26% |
|
|
|
 |
Featured Stocks
Kenneth J. Gruneisen - Passed the CAN SLIM® Master's Exam
|
|
|
Color Codes Explained :
Y - Better candidates highlighted by our
staff of experts.
G - Previously featured
in past reports as yellow but may no longer be buyable under the
guidelines.
***Last / Change / Volume data in this table is the closing quote data***
Symbol/Exchange
Company Name
Industry Group |
PRICE |
CHANGE
(%Change) |
Day High |
Volume
(% DAV)
(% 50 day avg vol) |
52 Wk Hi
% From Hi |
Featured
Date |
Price
Featured |
Pivot Featured |
|
Max Buy |
 FBC
-
NYSE
FBC
-
NYSE
Flagstar Bancorp Inc
BANKING - Savings and Loans
|
$44.21
|
-0.15
-0.34% |
$44.53
|
502,997
82.84% of 50 DAV
50 DAV is 607,200
|
$51.58
-14.29%
|
3/4/2021
|
$47.26
|
PP = $48.02
|
|
MB = $50.42
|
Most Recent Note - 4/13/2021 5:42:02 PM
G - Still sputtering just below its 50 DMA line ($45.63) which has acted as resistance in recent weeks. Near-term support to watch is prior lows. Relative Strength Rating is 75, below the 80+ minimum guideline. See the latest FSU analysis for more details and a new annotated graph.
>>> FEATURED STOCK ARTICLE : 50-Day Moving Average Line Acted as Resistance - 4/13/2021 |
View all notes |
Set NEW NOTE alert |
Company Profile |
SEC
News |
Chart |
Request a new note
C
A
S
I |
CRL
-
NYSE
Charles River Labs Intl
DRUGS - Biotechnology
|
$320.37
|
+11.20
3.62% |
$320.95
|
325,577
102.71% of 50 DAV
50 DAV is 317,000
|
$313.88
2.07%
|
12/17/2020
|
$247.06
|
PP = $257.98
|
|
MB = $270.88
|
 Most Recent Note - 4/15/2021 5:42:10 PM
G - Posted another solid gain today for a new all-time high. Its 50 DMA line ($287) acted as support throughout its ongoing ascent. Its Relative Strength Rating is 81, above the 80+ minimum guideline for buy candidates. Dec '20 quarterly earnings rose +19% on +14% sales revenues versus the year ago period, below the +25% minimum earnings guideline (C criteria), raising fundamental concerns.
>>> FEATURED STOCK ARTICLE : Perched at Record High After Rally From 50-Day Moving Average - 4/9/2021 |
View all notes |
Set NEW NOTE alert |
Company Profile |
SEC
News |
Chart |
Request a new note
C
A
S
I |
BRKS
-
NASDAQ
Brooks Automation
ELECTRONICS - Semiconductor Equipment and Mate
|
$99.80
|
+3.50
3.63% |
$101.14
|
792,730
111.97% of 50 DAV
50 DAV is 708,000
|
$101.63
-1.80%
|
4/5/2021
|
$99.31
|
PP = $91.88
|
|
MB = $96.47
|
Most Recent Note - 4/15/2021 5:40:29 PM
G - Color code is changed to green after quietly rising back above its "max buy" level. Prior highs in the $91 area define initial support to watch above its 50 DMA line ($84)
>>> FEATURED STOCK ARTICLE : High Ranked Semiconductor Equipment Firm Powered Higher - 4/7/2021 |
View all notes |
Set NEW NOTE alert |
Company Profile |
SEC
News |
Chart |
Request a new note
C
A
S
I |
ENTG
-
NASDAQ
Entegris Inc
ELECTRONICS - Semiconductor Equipment and Mate
|
$119.30
|
+1.30
1.10% |
$120.60
|
750,224
77.50% of 50 DAV
50 DAV is 968,000
|
$126.41
-5.62%
|
4/1/2021
|
$118.42
|
PP = $110.37
|
|
MB = $115.89
|
Most Recent Note - 4/13/2021 5:46:21 PM
G - Still hovering near its all-time high and stubbornly holding its ground following a noted spurt of volume-driven gains. Prior highs in the $114-110 area define near-term support to watch on pullbacks.
>>> FEATURED STOCK ARTICLE : Strong Breakout Action With +67% Above Average Volume - 4/1/2021 |
View all notes |
Set NEW NOTE alert |
Company Profile |
SEC
News |
Chart |
Request a new note
C
A
S
I |
OPY
-
NYSE
Oppenheimer Holdings Inc
FINANCIAL SERVICES - Investment Brokerage - Regiona
|
$44.48
|
+0.38
0.86% |
$44.84
|
70,753
57.06% of 50 DAV
50 DAV is 124,000
|
$44.95
-1.05%
|
2/25/2021
|
$38.95
|
PP = $38.11
|
|
MB = $40.02
|
Most Recent Note - 4/12/2021 5:42:42 PM
G - Posted a 2nd consecutive gain with light volume, approaching its prior high. Its 50 DMA line ($39.59) and prior low define near-term support to watch.
>>> FEATURED STOCK ARTICLE : Oppenheimer Consolidating Near Max Buy Level - 3/31/2021 |
View all notes |
Set NEW NOTE alert |
Company Profile |
SEC
News |
Chart |
Request a new note
C
A
S
I |
Symbol/Exchange
Company Name
Industry Group |
PRICE |
CHANGE
(%Change) |
Day High |
Volume
(% DAV)
(% 50 day avg vol) |
52 Wk Hi
% From Hi |
Featured
Date |
Price
Featured |
Pivot Featured |
|
Max Buy |
EDUC
-
NASDAQ
Educational Development
WHOLESALE - Basic Materials Wholesale
|
$17.11
|
-0.45
-2.56% |
$17.64
|
7,585
24.47% of 50 DAV
50 DAV is 31,000
|
$20.00
-14.45%
|
3/10/2021
|
$17.89
|
PP = $20.10
|
|
MB = $21.11
|
Most Recent Note - 4/15/2021 5:43:01 PM
Y - Volume totals are cooling while still consolidating above its 50 DMA line ($16.85) which defines important near-term support. Met stubborn resistance in the $19-20 area. Subsequent gains above the pivot point backed by at least +40% above average volume are needed to trigger a proper technical buy signal.
>>> FEATURED STOCK ARTICLE : Consolidating Above 50 DMA Line Perched Near High - 3/30/2021 |
View all notes |
Set NEW NOTE alert |
Company Profile |
SEC
News |
Chart |
Request a new note
C
A
S
I |
SMPL
-
NASDAQ
Simply Good Foods Co
Food-Confectionery
|
$33.09
|
+0.51
1.57% |
$33.26
|
319,743
45.14% of 50 DAV
50 DAV is 708,300
|
$35.25
-6.13%
|
12/28/2020
|
$30.40
|
PP = $31.44
|
|
MB = $33.01
|
Most Recent Note - 4/14/2021 5:15:55 PM
G - Showed resilience and remains perched near prior highs. Reported Feb '21 quarterly earnings +9% on +2% sales revenues versus the year ago period, below the +25% minimum earnings guideline (C criteria), raising fundamental concerns. Found prompt support near its 50 DMA line ($30.57) but its current Relative Strength Rating is 73, below the 80+ minimum guideline for buy candidates. See the latest FSU analysis for more details and a new annotated graph.
>>> FEATURED STOCK ARTICLE : Perched Near High But Fundamental Concerns Were Raised - 4/14/2021 |
View all notes |
Set NEW NOTE alert |
Company Profile |
SEC
News |
Chart |
Request a new note
C
A
S
I |
QRVO
-
NASDAQ
Qorvo Inc
ELECTRONICS - Semiconductor - Integrated Cir
|
$192.84
|
+2.99
1.57% |
$193.59
|
708,874
50.17% of 50 DAV
50 DAV is 1,413,000
|
$199.94
-3.55%
|
4/1/2021
|
$190.48
|
PP = $191.92
|
|
MB = $201.52
|
Most Recent Note - 4/12/2021 5:44:22 PM
Y - Posted a small gain today with lighter volume. Perched near its all-time high, it recently wedging up from any orderly 9-week base. Prior highs in the $191-185 area define initial support to watch on pullbacks. See the latest FSU analysis for more details and an annotated graph.
>>> FEATURED STOCK ARTICLE : Hit Another New High With Even Less Volume Conviction - 4/5/2021 |
View all notes |
Set NEW NOTE alert |
Company Profile |
SEC
News |
Chart |
Request a new note
C
A
S
I |
YETI
-
NYSE
Yeti Holdings Inc
Leisure-Products
|
$84.50
|
+0.93
1.11% |
$84.96
|
932,211
67.65% of 50 DAV
50 DAV is 1,378,000
|
$85.39
-1.04%
|
4/6/2021
|
$76.95
|
PP = $79.42
|
|
MB = $83.39
|
Most Recent Note - 4/12/2021 1:05:34 PM
Y - Hitting a new all-time high with heavier volume behind today's 5th consecutive gain. A new pivot point was cited based on its 2/10/21 high while working on a "double bottom" base. Gains above the pivot point triggered a new (or add-on) technical buy signal.
>>> FEATURED STOCK ARTICLE : YETI Perched Within Striking Distance of High - 4/7/2021 |
View all notes |
Set NEW NOTE alert |
Company Profile |
SEC
News |
Chart |
Request a new note
C
A
S
I |
DT
-
NYSE
Dynatrace Inc
Computer Sftwr-Enterprse
|
$54.25
|
+0.11
0.20% |
$55.04
|
1,026,936
41.74% of 50 DAV
50 DAV is 2,460,300
|
$56.94
-4.72%
|
2/4/2021
|
$51.39
|
PP = $48.95
|
|
MB = $51.40
|
Most Recent Note - 4/13/2021 5:45:24 PM
G - Posted a 4th consecutive gain today with lighter volume while rising further above its 50 DMA line ($51.12) toward prior highs and little resistance remains due to overhead supply. Recent lows in the $45 area define important near-term support to watch on pullbacks. Its Relative Strength Rating is 76 is still below the 80+ minimum guideline for buy candidates. Fundamentals remain strong after it reported Dec '20 earnings +70% on +28% sales revenues versus the year ago period.
>>> FEATURED STOCK ARTICLE : Gap Up Rebounding Further Above 50-Day Moving Average - 4/8/2021 |
View all notes |
Set NEW NOTE alert |
Company Profile |
SEC
News |
Chart |
Request a new note
C
A
S
I |
Symbol/Exchange
Company Name
Industry Group |
PRICE |
CHANGE
(%Change) |
Day High |
Volume
(% DAV)
(% 50 day avg vol) |
52 Wk Hi
% From Hi |
Featured
Date |
Price
Featured |
Pivot Featured |
|
Max Buy |
MRBK
-
NASDAQ
Meridian Corp
Banks-Northeast
|
$25.72
|
+0.17
0.67% |
$25.80
|
9,802
26.49% of 50 DAV
50 DAV is 37,000
|
$27.96
-8.01%
|
2/22/2021
|
$25.58
|
PP = $26.10
|
|
MB = $27.41
|
Most Recent Note - 4/12/2021 5:40:44 PM
Y - Encountered distributional pressure today. Volume totals had been below average in recent weeks while hovering in a tight range within close striking distance of its all-time high. Its 50 DMA line ($24.84) and prior low ($24.13 on 3/25/21) define important near-term support to watch where violations may trigger technical sell signals. Its Relative Strength Rating is 78, just below the 80+ minimum guideline. See the latest FSU analysis for more details and a new annotated graph.
>>> FEATURED STOCK ARTICLE : Encountering Distributional Pressure - 4/12/2021 |
View all notes |
Set NEW NOTE alert |
Company Profile |
SEC
News |
Chart |
Request a new note
C
A
S
I |
|
|
|
THESE ARE NOT BUY RECOMMENDATIONS!
Comments contained in the body of this report are technical
opinions only. The material herein has been obtained
from sources believed to be reliable and accurate, however,
its accuracy and completeness cannot be guaranteed.
This site is not an investment advisor, hence it does
not endorse or recommend any securities or other investments.
Any recommendation contained in this report may not
be suitable for all investors and it is not to be deemed
an offer or solicitation on our part with respect to
the purchase or sale of any securities. All trademarks,
service marks and trade names appearing in this report
are the property of their respective owners, and are
likewise used for identification purposes only.
This report is a service available
only to active Paid Premium Members.
You may opt-out of receiving report notifications
at any time. Questions or comments may be submitted
by writing to Premium Membership Services 665 S.E. 10 Street, Suite 201 Deerfield Beach, FL 33441-5634 or by calling 1-800-965-8307
or 954-785-1121.
|
|
|