You are not logged in.
This means you
CAN ONLY VIEW reports that were published prior to Thursday, March 20, 2025.
You
MUST UPGRADE YOUR MEMBERSHIP if you want to see any current reports.
AFTER MARKET UPDATE - TUESDAY, MARCH 16TH, 2021
Previous After Market Report Next After Market Report >>>
|
|
|
|
DOW |
-127.51 |
32,825.95 |
-0.39% |
|
Volume |
986,379,692 |
+1% |
|
Volume |
5,422,676,800 |
-8% |
|
NASDAQ |
+14.26 |
13,473.97 |
+0.11% |
|
Advancers |
1,118 |
35% |
|
Advancers |
1,214 |
30% |
|
S&P 500 |
-6.23 |
3,962.71 |
-0.16% |
|
Decliners |
2,106 |
65% |
|
Decliners |
2,796 |
70% |
|
Russell 2000 |
-40.65 |
2,319.52 |
-1.72% |
|
52 Wk Highs |
227 |
|
|
52 Wk Highs |
214 |
|
|
S&P 600 |
-23.14 |
1,373.56 |
-1.66% |
|
52 Wk Lows |
15 |
|
|
52 Wk Lows |
38 |
|
|
 |
Breadth Turns Negative and Leadership Thins as Indices Pull Back
Kenneth J. Gruneisen - Passed the CAN SLIM® Master's Exam
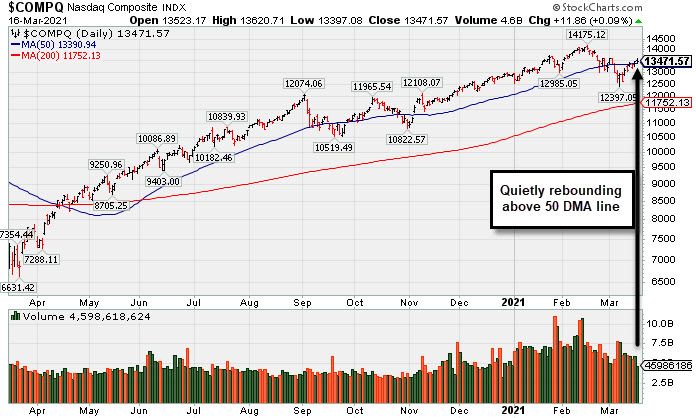
The Dow fell 127 points, snapping a seven-session winning streak that had been its longest since August. The S&P 500 turned 0.2% lower, erasing early session gains that had sent the broad index to a fresh all-time high. The Nasdaq Composite was up 0.1%, paring an earlier advance. The volume totals were mixed, higher than the prior session total on the NYSE and lighter on the Nasdaq exchange. Breadth was negative as decliners led advancers by almost a 2-1 margin on the NYSE and by more than a 2-1 margin on the Nasdaq exchange. There were 52 high-ranked companies from the Leaders List that hit new 52-week highs and were listed on the BreakOuts Page, versus the total of 79 on the prior session. New 52-week highs totals contracted yet easily outnumbered new 52-week lows totals on the NYSE and on the Nasdaq exchange. The major indices are in a confirmed uptrend (M criteria). Investors are reminded to always make buying and selling decisions on case-by-case basis under the strict criteria and rules of the fact-based investment system.
PICTURED: The Nasdaq Composite Index quietly rebounded above its 50-day moving average (DMA) line with recent gains lacking great volume conviction.
Stocks finished mixed on Tuesday as investors digested disappointing economic data and awaited tomorrow’s conclusion of the Federal Reserve’s policy meeting. Fed Chair Jerome Powell’s post-meeting press conference will be closely scrutinized for any guidance on rising interest rates and inflation expectations. Notably, the CBOE Volatility Index (VIX) dipped to its lowest point since February 2020.
On the data front, U.S. retail sales slid a larger-than-expected 3% in February, with consumer spending hindered as much of the country faced inclement winter weather. Separately, industrial production slumped more than anticipated, declining 2.2% last month. Additionally, the NAHB’s gauge of homebuilder sentiment unexpectedly deteriorated in March. Longer-dated Treasuries weakened, with the yield on the 10-year note up two basis points to 1.62%. In commodities, WTI crude declined for a third straight session.
Seven of 11 S&P 500 sectors closed in negative territory, with the Communication Services and Technology groups bucking the downtrend. Apple (AAPL +1.27%) rose amid a street-high Wall Street analyst price target increase. In other corporate news, AstraZeneca (AZN +2.62%) rose on reports its COVID-19 vaccine would be recommended to people aged 65 or older in Canada as health officials push back on much of Europe’s decision to suspend its use amid concerns of possible side effects. |
 Kenneth J. Gruneisen started out as a licensed stockbroker in August 1987, a couple of months prior to the historic stock market crash that took the Dow Jones Industrial Average down -22.6% in a single day. He has published daily fact-based fundamental and technical analysis on high-ranked stocks online for two decades. Through FACTBASEDINVESTING.COM, Kenneth provides educational articles, news, market commentary, and other information regarding proven investment systems that work in good times and bad.
Comments contained in the body of this report are technical opinions only and are not necessarily those of Gruneisen Growth Corp. The material herein has been obtained from sources believed to be reliable and accurate, however, its accuracy and completeness cannot be guaranteed. Our firm, employees, and customers may effect transactions, including transactions contrary to any recommendation herein, or have positions in the securities mentioned herein or options with respect thereto. Any recommendation contained in this report may not be suitable for all investors and it is not to be deemed an offer or solicitation on our part with respect to the purchase or sale of any securities. |
|
 |
Semiconductor Index Posted a Standout Gain
Kenneth J. Gruneisen - Passed the CAN SLIM® Master's Exam
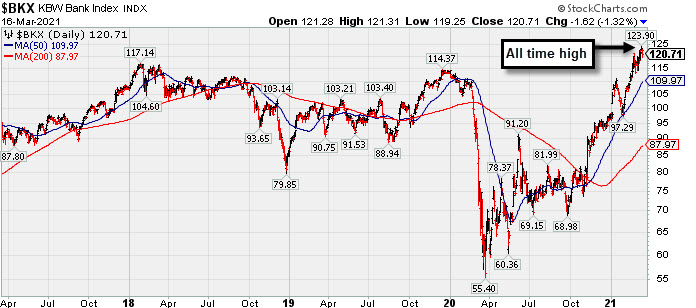
The Semiconductor Index ($SOX +1.25%) led the tech sector and the Networking Index ($NWX +0.21%) also edged higher, meanwhile the Biotech Index ($BTK -1.09%) fell. The Retail Index ($RLX +0.04%) held its ground while the Broker/Dealer Index ($XBD -1.51%) and Bank Index ($BKX -1.32%) both created a drag on the major indices. Weakness in energy-linked groups made the Oil Services Index ($OSX -3.95%) and Integrated Oil Index ($XOI -2.79%) standout decliners. The Gold & Silver Index ($XAU -1.20%) also lost ground.
PICTURED: The 4-year graph of the Bank Index ($BKX -1.32%) shows it hovering near its all-time high.
| Oil Services |
$OSX |
59.72 |
-2.46 |
-3.95% |
+34.72% |
| Integrated Oil |
$XOI |
1,056.95 |
-30.34 |
-2.79% |
+33.37% |
| Semiconductor |
$SOX |
3,070.07 |
+38.02 |
+1.25% |
+9.82% |
| Networking |
$NWX |
820.94 |
+1.72 |
+0.21% |
+14.48% |
| Broker/Dealer |
$XBD |
446.14 |
-6.83 |
-1.51% |
+18.15% |
| Retail |
$RLX |
3,575.22 |
+1.52 |
+0.04% |
+0.34% |
| Gold & Silver |
$XAU |
140.42 |
-1.70 |
-1.20% |
-2.62% |
| Bank |
$BKX |
120.71 |
-1.62 |
-1.32% |
+23.29% |
| Biotech |
$BTK |
5,596.56 |
-61.41 |
-1.09% |
-2.48% |
|
|
|
 |
Made Gradual Progress, Now Extended From Any Sound Base
Kenneth J. Gruneisen - Passed the CAN SLIM® Master's Exam
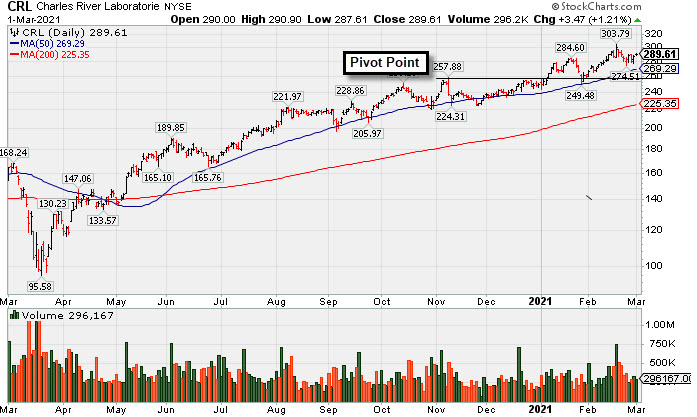
Charles River Labs Intl (CRL -$3.56 or -1.22% to $288.53) ended lower today with light volume. It is extended from any sound base and consolidating above its 50-day moving average (DMA) line ($276), which recently acted as support, as it has during prior consolidations. More damaging losses would raise concerns and trigger technical sell signals.
Its Relative Strength Rating is 75, below the 80+ minimum guideline for buy candidates. Recently reported Dec '20 quarterly earnings +19% on +14% sales revenues versus the year ago period, below the +25% minimum earnings guideline (C criteria), raising fundamental concerns.
It hails from the Medical - Research Equipment/Services industry group which currently has a mediocre C (41) Group Relative Strength Rating (L criteria). CRL traded up as much as +57.7% since it was highlighted in yellow with pivot point cited based on its 6/03/20 high plus 10 cents in the 7/15/20 mid-day report (read here). It was last shown in this FSU section on 3/01/21 with an annotated graph under the headline, "CRL Still Hovering Near Record High".
The number of top-rated funds owning its shares rose from 681 in Dec '19 to 840 in Dec '20, and its Up/Down Volume Ratio is 1.3 is an unbiased indication its shares have been under accumulation over the past 50 days. There is a small number of only 49.8 million shares (S criteria) outstanding, which can contribute to greater price volatility in the event of institutional buying or selling.
|
|
|
Color Codes Explained :
Y - Better candidates highlighted by our
staff of experts.
G - Previously featured
in past reports as yellow but may no longer be buyable under the
guidelines.
***Last / Change / Volume data in this table is the closing quote data***
Symbol/Exchange
Company Name
Industry Group |
PRICE |
CHANGE
(%Change) |
Day High |
Volume
(% DAV)
(% 50 day avg vol) |
52 Wk Hi
% From Hi |
Featured
Date |
Price
Featured |
Pivot Featured |
|
Max Buy |
 FBC
-
NYSE
FBC
-
NYSE
Flagstar Bancorp Inc
BANKING - Savings and Loans
|
$48.91
|
-1.07
-2.14% |
$49.82
|
366,169
55.31% of 50 DAV
50 DAV is 662,000
|
$51.58
-5.18%
|
3/4/2021
|
$47.26
|
PP = $48.02
|
|
MB = $50.42
|
Most Recent Note - 3/15/2021 5:34:06 PM
Y - Color code is changed to yellow after pulling back below its "max buy" level. Its 50 DMA line ($44.80) and recent low define important near-term support to watch on pullbacks.
>>> FEATURED STOCK ARTICLE : Negative Reversal When Poised For Technical Breakout - 3/4/2021 |
View all notes |
Set NEW NOTE alert |
Company Profile |
SEC
News |
Chart |
Request a new note
C
A
S
I |
CRL
-
NYSE
Charles River Labs Intl
DRUGS - Biotechnology
|
$288.53
|
-3.56
-1.22% |
$294.69
|
234,194
73.88% of 50 DAV
50 DAV is 317,000
|
$303.79
-5.02%
|
12/17/2020
|
$247.06
|
PP = $257.98
|
|
MB = $270.88
|
 Most Recent Note - 3/16/2021 5:18:08 PM
G - Extended from any sound base, consolidating well above its 50 DMA line ($276) which acted as support throughout its ongoing ascent. Its Relative Strength Rating is 75, below the 80+ minimum guideline for buy candidates. Recently reported Dec '20 quarterly earnings +19% on +14% sales revenues versus the year ago period, below the +25% minimum earnings guideline (C criteria), raising fundamental concerns. See the latest FSU analysis for more details and a new annotated graph.
>>> FEATURED STOCK ARTICLE : Made Gradual Progress, Now Extended From Any Sound Base - 3/16/2021 |
View all notes |
Set NEW NOTE alert |
Company Profile |
SEC
News |
Chart |
Request a new note
C
A
S
I |
OPY
-
NYSE
Oppenheimer Holdings Inc
FINANCIAL SERVICES - Investment Brokerage - Regiona
|
$42.50
|
-0.41
-0.96% |
$42.97
|
79,610
63.18% of 50 DAV
50 DAV is 126,000
|
$43.89
-3.17%
|
2/25/2021
|
$38.95
|
PP = $38.11
|
|
MB = $40.02
|
Most Recent Note - 3/12/2021 10:57:21 PM
G - Hit another new all-time high with today's 6th consecutive gain. Disciplined investors avoid chasing stocks extended more than +5% above their pivot point. See the latest FSU analysis for more details and a new annotated graph.
>>> FEATURED STOCK ARTICLE : Perched at Record High After 6 Consecutive Gains - 3/12/2021 |
View all notes |
Set NEW NOTE alert |
Company Profile |
SEC
News |
Chart |
Request a new note
C
A
S
I |
CLFD
-
NASDAQ
Clearfield Inc
TELECOMMUNICATIONS - Cables / Satalite Equipment
|
$33.46
|
-0.70
-2.05% |
$34.80
|
152,097
90.53% of 50 DAV
50 DAV is 168,000
|
$38.75
-13.65%
|
1/20/2021
|
$31.38
|
PP = $28.42
|
|
MB = $29.84
|
Most Recent Note - 3/12/2021 11:03:37 PM
G - Posted a 4th consecutive gain with higher volume today. Found prompt support near its 50 DMA line but it has not formed a sound base of sufficient length. Prior highs in the $28 area acted as support. Fundamentals remain strong.
>>> FEATURED STOCK ARTICLE : Quiet Gain Repaired 50-Day Moving Average Violation - 3/9/2021 |
View all notes |
Set NEW NOTE alert |
Company Profile |
SEC
News |
Chart |
Request a new note
C
A
S
I |
EDUC
-
NASDAQ
Educational Development
WHOLESALE - Basic Materials Wholesale
|
$17.14
|
-1.17
-6.39% |
$18.55
|
38,727
104.67% of 50 DAV
50 DAV is 37,000
|
$20.00
-14.30%
|
3/10/2021
|
$17.89
|
PP = $20.10
|
|
MB = $21.11
|
Most Recent Note - 3/16/2021 4:08:25 PM
Y - Pulled back from its 52-week high with today's 3rd consecutive loss on near average volume. Subsequent gains above the pivot point backed by at least +40% above average volume are needed to trigger a proper technical buy signal. Found support at its 200 DMA line since noted with caution in the 10/22/20 mid-day report. Reported earnings +55% on +63% sales revenues for the Nov '20 quarter versus the year-ago period, its 3rd strong quarterly comparison above the +25% minimum guideline (C criteria), helping it better match with the fact-based investment system's fundamental guidelines. This thinly traded Media - Books firm's annual earnings (A criteria) history has strong.
>>> FEATURED STOCK ARTICLE : Gain Leaves Media - Books Firm Perched Near Pivot Point - 3/10/2021 |
View all notes |
Set NEW NOTE alert |
Company Profile |
SEC
News |
Chart |
Request a new note
C
A
S
I |
Symbol/Exchange
Company Name
Industry Group |
PRICE |
CHANGE
(%Change) |
Day High |
Volume
(% DAV)
(% 50 day avg vol) |
52 Wk Hi
% From Hi |
Featured
Date |
Price
Featured |
Pivot Featured |
|
Max Buy |
SMPL
-
NASDAQ
Simply Good Foods Co
Food-Confectionery
|
$33.88
|
+0.17
0.50% |
$34.61
|
572,773
80.11% of 50 DAV
50 DAV is 715,000
|
$35.25
-3.89%
|
12/28/2020
|
$30.40
|
PP = $31.44
|
|
MB = $33.01
|
Most Recent Note - 3/15/2021 5:35:43 PM
Y - Posted again today for its 2nd best ever close. Gain last week with heavier volume triggered a technical buy signal. Its 50 DMA line ($29.48) recently acted as support. Its Relative Strength Rating is 76, below the 80+ minimum guideline for buy candidates. Its prior low ($26.78) defines the next important near term support to watch.
>>> FEATURED STOCK ARTICLE : Found Support at 50-Day Moving Average; Relative Strength Improved - 3/5/2021 |
View all notes |
Set NEW NOTE alert |
Company Profile |
SEC
News |
Chart |
Request a new note
C
A
S
I |
XPEL
-
NASDAQ
Xpel Inc
Auto/Truck-Tires andamp; Misc
|
$61.36
|
-1.07
-1.71% |
$64.62
|
268,043
89.05% of 50 DAV
50 DAV is 301,000
|
$65.74
-6.66%
|
3/11/2021
|
$59.70
|
PP = $60.87
|
|
MB = $63.91
|
Most Recent Note - 3/16/2021 5:21:15 PM
Y - Pulled back today for a 3rd consecutive small loss on lighter volume. Finished strong after highlighted in yellow with pivot point cited based on its 1/14/21 high plus 10 cents in the 3/11/21 mid-day report. The big gain and strong close above its pivot point backed by +250% above average volume triggered a new technical buy signal as it hit a new 52-week high. Prior highs in the $60 area define initial support to watch above its 50 DMA line ($53.77).
>>> FEATURED STOCK ARTICLE : Powerful Breakout Backed by Heavy Volume - 3/11/2021 |
View all notes |
Set NEW NOTE alert |
Company Profile |
SEC
News |
Chart |
Request a new note
C
A
S
I |
DT
-
NYSE
Dynatrace Inc
Computer Sftwr-Enterprse
|
$54.38
|
+0.11
0.20% |
$56.94
|
2,319,992
89.33% of 50 DAV
50 DAV is 2,597,000
|
$56.77
-4.21%
|
2/4/2021
|
$51.39
|
PP = $48.95
|
|
MB = $51.40
|
Most Recent Note - 3/15/2021 5:32:58 PM
G - Posted a solid gain today with below average volume. Found prompt support after testing prior highs in the $48 area and its 50 DMA line ($48.10). More damaging losses would raise serious concerns. Its Relative Strength Rating is 78, still below the 80+ minimum guideline for buy candidates. Fundamentals remain strong after it reported Dec '20 earnings +70% on +28% sales revenues versus the year ago period.
>>> FEATURED STOCK ARTICLE : Consolidating Above Prior Highs and 50-Day Moving Average - 3/3/2021 |
View all notes |
Set NEW NOTE alert |
Company Profile |
SEC
News |
Chart |
Request a new note
C
A
S
I |
MRBK
-
NASDAQ
Meridian Corp
Banks-Northeast
|
$26.26
|
-0.14
-0.53% |
$26.40
|
65,152
214.32% of 50 DAV
50 DAV is 30,400
|
$27.96
-6.08%
|
2/22/2021
|
$25.58
|
PP = $26.10
|
|
MB = $27.41
|
Most Recent Note - 3/16/2021 12:41:52 PM
Y - Pulling back for a 4th consecutive loss today after a noted "negative reversal" at its 52-week high. Prior high defines initial support to watch on pullbacks. See the latest FSU analysis for more details and an annotated graph.
>>> FEATURED STOCK ARTICLE : Prior High Defines Initial Support to Watch - 3/15/2021 |
View all notes |
Set NEW NOTE alert |
Company Profile |
SEC
News |
Chart |
Request a new note
C
A
S
I |
|
|
|
THESE ARE NOT BUY RECOMMENDATIONS!
Comments contained in the body of this report are technical
opinions only. The material herein has been obtained
from sources believed to be reliable and accurate, however,
its accuracy and completeness cannot be guaranteed.
This site is not an investment advisor, hence it does
not endorse or recommend any securities or other investments.
Any recommendation contained in this report may not
be suitable for all investors and it is not to be deemed
an offer or solicitation on our part with respect to
the purchase or sale of any securities. All trademarks,
service marks and trade names appearing in this report
are the property of their respective owners, and are
likewise used for identification purposes only.
This report is a service available
only to active Paid Premium Members.
You may opt-out of receiving report notifications
at any time. Questions or comments may be submitted
by writing to Premium Membership Services 665 S.E. 10 Street, Suite 201 Deerfield Beach, FL 33441-5634 or by calling 1-800-965-8307
or 954-785-1121.
|
|
|