You are not logged in.
This means you
CAN ONLY VIEW reports that were published prior to Thursday, March 20, 2025.
You
MUST UPGRADE YOUR MEMBERSHIP if you want to see any current reports.
AFTER MARKET UPDATE - MONDAY, MARCH 15TH, 2021
Previous After Market Report Next After Market Report >>>
|
|
|
|
DOW |
+174.82 |
32,953.46 |
+0.53% |
|
Volume |
973,811,823 |
+3% |
|
Volume |
5,881,604,200 |
+7% |
|
NASDAQ |
+135.28 |
13,455.15 |
+1.02% |
|
Advancers |
2,031 |
62% |
|
Advancers |
2,281 |
56% |
|
S&P 500 |
+25.60 |
3,968.94 |
+0.65% |
|
Decliners |
1,218 |
37% |
|
Decliners |
1,766 |
44% |
|
Russell 2000 |
+7.38 |
2,360.17 |
+0.31% |
|
52 Wk Highs |
462 |
|
|
52 Wk Highs |
395 |
|
|
S&P 600 |
-0.96 |
1,396.70 |
-0.07% |
|
52 Wk Lows |
15 |
|
|
52 Wk Lows |
41 |
|
|
 |
Major Indices Rose With Greater Volume Totals
Kenneth J. Gruneisen - Passed the CAN SLIM® Master's Exam
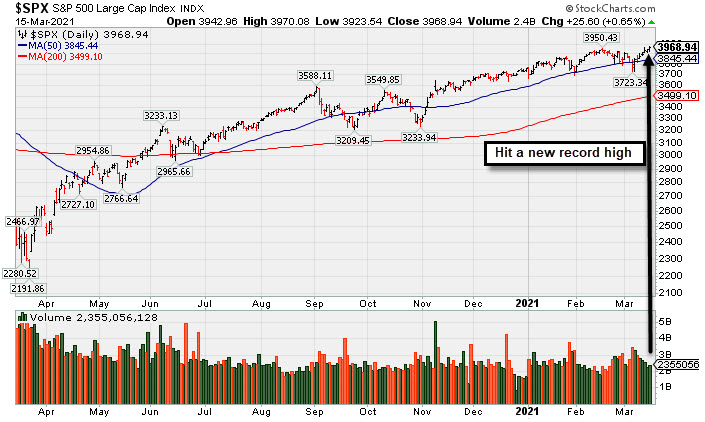
The Dow and S&P 500 both closed at fresh record highs, rising 174 points and 0.7%, respectively. The Nasdaq Composite jumped 1.1%. The volume totals on Monday were higher than the prior session totals on the NYSE and on the Nasdaq exchange. Advancers led decliners by a 5-3 margin on the NYSE and by an 11-9 margin on the Nasdaq exchange. There were 79 high-ranked companies from the Leaders List that hit new 52-week highs and were listed on the BreakOuts Page, versus the total of 121 on the prior session. New 52-week highs totals contracted yet easily outnumbered new 52-week lows totals on the NYSE and on the Nasdaq exchange. The major indices are in a confirmed uptrend (M criteria). Investors are reminded to always make buying and selling decisions on case-by-case basis under the strict criteria and rules of the fact-based investment system.
PICTURED: The S&P 500 Index hit a new record high with its 5th consecutive gain.
U.S. equities climbed higher on Monday, as investors marked time ahead of the Federal Open Market Committee (FOMC) meeting. At the conclusion of the two-day meeting on Wednesday, the U.S. central bank is widely expected to reiterate its current accommodative monetary policy. The Fed’s updated economic forecasts and policy statement will be in focus, as investors look for guidance on the health of the economy.
Market participants also weighed reports of planned tax hikes on the horizon from the Biden Administration. On the data front, a gauge of New York manufacturing activity rose to 17.4 in March, the highest level since November 2018. Treasuries advanced, with the yield on the 10-year note falling two basis points to 1.60%, stabilizing after the benchmark yield climbed for a sixth consecutive week. In commodities, WTI crude slipped 0.4% to $65.38/barrel, extending losses after capping its biggest one-week decline since December.
Nine of 11 S&P 500 sectors finished in positive territory, with Energy and Financials the lone laggards. The yield-sensitive Utilities and Real Estate groups paced the gains, rising more than 1% alongside Consumer Discretionary and Technology stocks. Airlines also outperformed, as U.S. carriers reported higher bookings and domestic air travel hit a one-year high. Meanwhile, NXP Semiconductors, Penn National Gaming, Generac, and Caesars Entertainment moved higher on news each company will be joining the S&P 500. Eli Lilly (LLY -9.10%) slid following disappointing results of a key Alzheimer's study. |
 Kenneth J. Gruneisen started out as a licensed stockbroker in August 1987, a couple of months prior to the historic stock market crash that took the Dow Jones Industrial Average down -22.6% in a single day. He has published daily fact-based fundamental and technical analysis on high-ranked stocks online for two decades. Through FACTBASEDINVESTING.COM, Kenneth provides educational articles, news, market commentary, and other information regarding proven investment systems that work in good times and bad.
Comments contained in the body of this report are technical opinions only and are not necessarily those of Gruneisen Growth Corp. The material herein has been obtained from sources believed to be reliable and accurate, however, its accuracy and completeness cannot be guaranteed. Our firm, employees, and customers may effect transactions, including transactions contrary to any recommendation herein, or have positions in the securities mentioned herein or options with respect thereto. Any recommendation contained in this report may not be suitable for all investors and it is not to be deemed an offer or solicitation on our part with respect to the purchase or sale of any securities. |
|
 |
Tech, Retail, and Gold & Silver Indexes Rose
Kenneth J. Gruneisen - Passed the CAN SLIM® Master's Exam
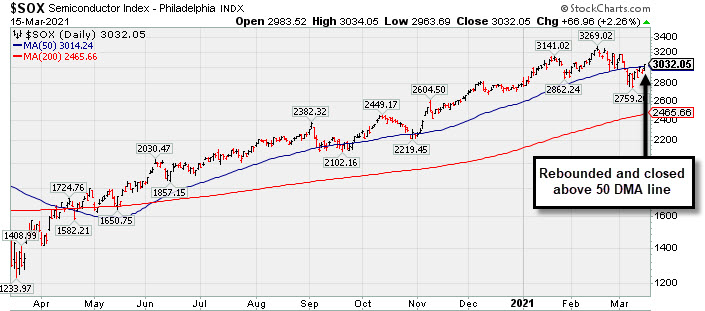
The Broker/Dealer Index ($XBD -0.67%) and Bank Index ($BKX -0.83%) both lost ground while the Retail Index ($RLX +0.56%) posted a modest gain. The tech sector had a positive bias as the Semiconductor Index ($SOX +2.27%), Biotech Index ($BTK +1.98%), and Networking Index ($NWX +1.60%) posted unanimous gains. Commodity-linked groups were mixed as the Gold & Silver Index ($XAU +1.71%) posted a solid gain while the Oil Services Index ($OSX -0.72%) and Integrated Oil Index ($XOI -0.66%) both edged lower.
PICTURED: The Semiconductor Index ($SOX +2.27%) rebounded and closed above its 50-day moving average (DMA) line.
| Oil Services |
$OSX |
62.18 |
-0.45 |
-0.72% |
+40.26% |
| Integrated Oil |
$XOI |
1,087.29 |
-7.20 |
-0.66% |
+37.20% |
| Semiconductor |
$SOX |
3,032.38 |
+67.29 |
+2.27% |
+8.47% |
| Networking |
$NWX |
819.23 |
+12.89 |
+1.60% |
+14.24% |
| Broker/Dealer |
$XBD |
452.96 |
-3.03 |
-0.67% |
+19.96% |
| Retail |
$RLX |
3,573.70 |
+20.05 |
+0.56% |
+0.29% |
| Gold & Silver |
$XAU |
142.12 |
+2.39 |
+1.71% |
-1.44% |
| Bank |
$BKX |
122.33 |
-1.02 |
-0.83% |
+24.94% |
| Biotech |
$BTK |
5,657.97 |
+110.12 |
+1.98% |
-1.41% |
|
|
|
 |
Prior High Defines Initial Support to Watch
Kenneth J. Gruneisen - Passed the CAN SLIM® Master's Exam
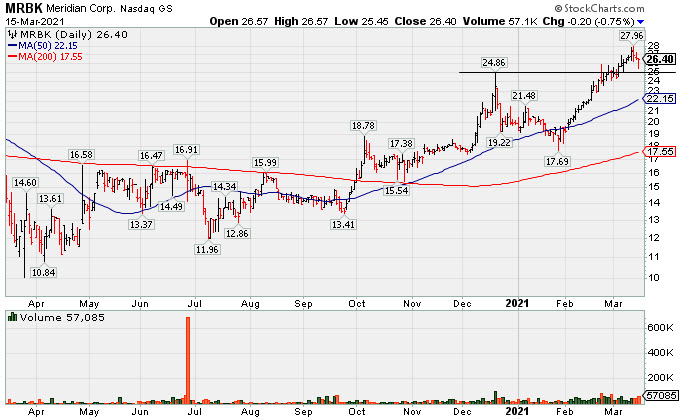
Meridian Corp (MRBK -$0.20 or -0.75% to $26.40) pulled back today but ended near the session high with a 3rd consecutive loss after a "negative reversal" at its 52-week high. It was previously noted - "The prior high ($26) defines initial support to watch on pullbacks."
MRBK was highlighted in yellow with pivot point cited based on its 12/18/21 high plus 10 cents in the 2/22/21 mid-day report (read here) and in this FSU section that evening with an annotated graph under the headline, "Negative Reversal When Poised to Convincingly Breakout". The thinly-traded company is in the Banks-Northeast industry group which currently has a Group Relative Strength Rating of 75 (A-). There are a fair number of other strong leaders (L criteria) in the group. The past 3 quarterly comparisons through Dec '20 had earnings increases well above the +25% minimum guideline (C criteria). Annual earnings growth (A criteria) has been good since it Nov '17 IPO at $17.
The number of top rated funds that own its shares rose from 30 in Mar '20 to 118 in Dec '20, a reassuring sign concerning the I criteria. The current Up/Down Volume Ratio of 1.8 is an unbiased indication its shares have been under accumulation over the past 50 days. The small supply of only 6.1 million shares outstanding (S criteria) can contribute to greater volatility in the event of institutional buying or selling. |
|
|
Color Codes Explained :
Y - Better candidates highlighted by our
staff of experts.
G - Previously featured
in past reports as yellow but may no longer be buyable under the
guidelines.
***Last / Change / Volume data in this table is the closing quote data***
Symbol/Exchange
Company Name
Industry Group |
PRICE |
CHANGE
(%Change) |
Day High |
Volume
(% DAV)
(% 50 day avg vol) |
52 Wk Hi
% From Hi |
Featured
Date |
Price
Featured |
Pivot Featured |
|
Max Buy |
 FBC
-
NYSE
FBC
-
NYSE
Flagstar Bancorp Inc
BANKING - Savings and Loans
|
$49.98
|
-1.14
-2.23% |
$51.47
|
608,617
92.49% of 50 DAV
50 DAV is 658,000
|
$51.58
-3.10%
|
3/4/2021
|
$47.26
|
PP = $48.02
|
|
MB = $50.42
|
 Most Recent Note - 3/15/2021 5:34:06 PM
Y - Color code is changed to yellow after pulling back below its "max buy" level. Its 50 DMA line ($44.80) and recent low define important near-term support to watch on pullbacks.
>>> FEATURED STOCK ARTICLE : Negative Reversal When Poised For Technical Breakout - 3/4/2021 |
View all notes |
Set NEW NOTE alert |
Company Profile |
SEC
News |
Chart |
Request a new note
C
A
S
I |
CRL
-
NYSE
Charles River Labs Intl
DRUGS - Biotechnology
|
$292.09
|
+5.30
1.85% |
$294.29
|
211,566
66.70% of 50 DAV
50 DAV is 317,200
|
$303.79
-3.85%
|
12/17/2020
|
$247.06
|
PP = $257.98
|
|
MB = $270.88
|
Most Recent Note - 3/11/2021 5:26:16 PM
G - Posted a gain today with light volume, consolidating above its 50 DMA line ($274) where it recently found prompt support again. Its Relative Strength Rating is 73, below the 80+ minimum guideline for buy candidates. Recently reported Dec '20 quarterly earnings +19% on +14% sales revenues versus the year ago period, below the +25% minimum earnings guideline (C criteria), raising concerns.
>>> FEATURED STOCK ARTICLE : CRL Still Hovering Near Record High - 3/1/2021 |
View all notes |
Set NEW NOTE alert |
Company Profile |
SEC
News |
Chart |
Request a new note
C
A
S
I |
OPY
-
NYSE
Oppenheimer Holdings Inc
FINANCIAL SERVICES - Investment Brokerage - Regiona
|
$42.91
|
-0.28
-0.65% |
$43.82
|
88,575
70.30% of 50 DAV
50 DAV is 126,000
|
$43.89
-2.23%
|
2/25/2021
|
$38.95
|
PP = $38.11
|
|
MB = $40.02
|
Most Recent Note - 3/12/2021 10:57:21 PM
G - Hit another new all-time high with today's 6th consecutive gain. Disciplined investors avoid chasing stocks extended more than +5% above their pivot point. See the latest FSU analysis for more details and a new annotated graph.
>>> FEATURED STOCK ARTICLE : Perched at Record High After 6 Consecutive Gains - 3/12/2021 |
View all notes |
Set NEW NOTE alert |
Company Profile |
SEC
News |
Chart |
Request a new note
C
A
S
I |
CLFD
-
NASDAQ
Clearfield Inc
TELECOMMUNICATIONS - Cables / Satalite Equipment
|
$34.16
|
-0.70
-2.01% |
$35.07
|
100,359
60.46% of 50 DAV
50 DAV is 166,000
|
$38.75
-11.85%
|
1/20/2021
|
$31.38
|
PP = $28.42
|
|
MB = $29.84
|
Most Recent Note - 3/12/2021 11:03:37 PM
G - Posted a 4th consecutive gain with higher volume today. Found prompt support near its 50 DMA line but it has not formed a sound base of sufficient length. Prior highs in the $28 area acted as support. Fundamentals remain strong.
>>> FEATURED STOCK ARTICLE : Quiet Gain Repaired 50-Day Moving Average Violation - 3/9/2021 |
View all notes |
Set NEW NOTE alert |
Company Profile |
SEC
News |
Chart |
Request a new note
C
A
S
I |
EDUC
-
NASDAQ
Educational Development
WHOLESALE - Basic Materials Wholesale
|
$18.31
|
-0.67
-3.53% |
$19.10
|
16,905
44.49% of 50 DAV
50 DAV is 38,000
|
$20.00
-8.45%
|
3/10/2021
|
$17.89
|
PP = $20.10
|
|
MB = $21.11
|
Most Recent Note - 3/15/2021 5:32:04 PM
Y - Pulled back from its 52-week high with today's 2nd consecutive loss on lighter volume. Subsequent gains above the pivot point backed by at least +40% above average volume are needed to trigger a proper technical buy signal. Found support at its 200 DMA line since noted with caution in the 10/22/20 mid-day report. Reported earnings +55% on +63% sales revenues for the Nov '20 quarter versus the year-ago period, its 3rd strong quarterly comparison above the +25% minimum guideline (C criteria), helping it better match with the fact-based investment system's fundamental guidelines. This thinly traded Media - Books firm's annual earnings (A criteria) history has strong.
>>> FEATURED STOCK ARTICLE : Gain Leaves Media - Books Firm Perched Near Pivot Point - 3/10/2021 |
View all notes |
Set NEW NOTE alert |
Company Profile |
SEC
News |
Chart |
Request a new note
C
A
S
I |
Symbol/Exchange
Company Name
Industry Group |
PRICE |
CHANGE
(%Change) |
Day High |
Volume
(% DAV)
(% 50 day avg vol) |
52 Wk Hi
% From Hi |
Featured
Date |
Price
Featured |
Pivot Featured |
|
Max Buy |
SMPL
-
NASDAQ
Simply Good Foods Co
Food-Confectionery
|
$33.71
|
+0.99
3.03% |
$34.07
|
850,358
117.94% of 50 DAV
50 DAV is 721,000
|
$35.25
-4.37%
|
12/28/2020
|
$30.40
|
PP = $31.44
|
|
MB = $33.01
|
Most Recent Note - 3/15/2021 5:35:43 PM
Y - Posted again today for its 2nd best ever close. Gain last week with heavier volume triggered a technical buy signal. Its 50 DMA line ($29.48) recently acted as support. Its Relative Strength Rating is 76, below the 80+ minimum guideline for buy candidates. Its prior low ($26.78) defines the next important near term support to watch.
>>> FEATURED STOCK ARTICLE : Found Support at 50-Day Moving Average; Relative Strength Improved - 3/5/2021 |
View all notes |
Set NEW NOTE alert |
Company Profile |
SEC
News |
Chart |
Request a new note
C
A
S
I |
XPEL
-
NASDAQ
Xpel Inc
Auto/Truck-Tires andamp; Misc
|
$62.43
|
-0.61
-0.97% |
$64.00
|
291,259
97.74% of 50 DAV
50 DAV is 298,000
|
$65.74
-5.03%
|
3/11/2021
|
$59.70
|
PP = $60.87
|
|
MB = $63.91
|
Most Recent Note - 3/11/2021 5:23:07 PM
Y - Finished strong after highlighted in yellow with pivot point cited based on its 1/14/21 high plus 10 cents in the earlier mid-day report. The big gain and strong close above its pivot point backed by +250% above average volume triggered a new technical buy signal as it hit a new 52-week high. Repaired a recently noted 50 DMA line violation and showed great resilience after dropped from the Featured Stocks list on 2/25/21. See the latest FSU analysis more details and a new annotated graph.
>>> FEATURED STOCK ARTICLE : Powerful Breakout Backed by Heavy Volume - 3/11/2021 |
View all notes |
Set NEW NOTE alert |
Company Profile |
SEC
News |
Chart |
Request a new note
C
A
S
I |
DT
-
NYSE
Dynatrace Inc
Computer Sftwr-Enterprse
|
$54.27
|
+1.51
2.86% |
$54.35
|
1,575,077
60.51% of 50 DAV
50 DAV is 2,603,000
|
$56.77
-4.40%
|
2/4/2021
|
$51.39
|
PP = $48.95
|
|
MB = $51.40
|
Most Recent Note - 3/15/2021 5:32:58 PM
G - Posted a solid gain today with below average volume. Found prompt support after testing prior highs in the $48 area and its 50 DMA line ($48.10). More damaging losses would raise serious concerns. Its Relative Strength Rating is 78, still below the 80+ minimum guideline for buy candidates. Fundamentals remain strong after it reported Dec '20 earnings +70% on +28% sales revenues versus the year ago period.
>>> FEATURED STOCK ARTICLE : Consolidating Above Prior Highs and 50-Day Moving Average - 3/3/2021 |
View all notes |
Set NEW NOTE alert |
Company Profile |
SEC
News |
Chart |
Request a new note
C
A
S
I |
MRBK
-
NASDAQ
Meridian Corp
Banks-Northeast
|
$26.40
|
-0.20
-0.75% |
$26.57
|
57,085
12.92% of 50 DAV
50 DAV is 442,000
|
$27.96
-5.58%
|
2/22/2021
|
$25.58
|
PP = $26.10
|
|
MB = $27.41
|
Most Recent Note - 3/15/2021 5:30:21 PM
Y - Ended near the session high but suffered a 3rd consecutive loss today after a "negative reversal" at its 52-week high. Prior high defines initial support to watch on pullbacks. See the latest FSU analysis for more details and a new annotated graph.
>>> FEATURED STOCK ARTICLE : Prior High Defines Initial Support to Watch - 3/15/2021 |
View all notes |
Set NEW NOTE alert |
Company Profile |
SEC
News |
Chart |
Request a new note
C
A
S
I |
|
|
|
THESE ARE NOT BUY RECOMMENDATIONS!
Comments contained in the body of this report are technical
opinions only. The material herein has been obtained
from sources believed to be reliable and accurate, however,
its accuracy and completeness cannot be guaranteed.
This site is not an investment advisor, hence it does
not endorse or recommend any securities or other investments.
Any recommendation contained in this report may not
be suitable for all investors and it is not to be deemed
an offer or solicitation on our part with respect to
the purchase or sale of any securities. All trademarks,
service marks and trade names appearing in this report
are the property of their respective owners, and are
likewise used for identification purposes only.
This report is a service available
only to active Paid Premium Members.
You may opt-out of receiving report notifications
at any time. Questions or comments may be submitted
by writing to Premium Membership Services 665 S.E. 10 Street, Suite 201 Deerfield Beach, FL 33441-5634 or by calling 1-800-965-8307
or 954-785-1121.
|
|
|