You are not logged in.
This means you
CAN ONLY VIEW reports that were published prior to Monday, April 14, 2025.
You
MUST UPGRADE YOUR MEMBERSHIP if you want to see any current reports.
AFTER MARKET UPDATE - FRIDAY, MARCH 19TH, 2021
Previous After Market Report Next After Market Report >>>
|
|
|
|
DOW |
-234.33 |
32,627.97 |
-0.71% |
|
Volume |
3,452,290,400 |
+202% |
|
Volume |
7,516,784,100 |
+33% |
|
NASDAQ |
+96.15 |
13,212.32 |
+0.73% |
|
Advancers |
1,768 |
55% |
|
Advancers |
2,462 |
62% |
|
S&P 500 |
-2.36 |
3,913.10 |
-0.06% |
|
Decliners |
1,419 |
45% |
|
Decliners |
1,490 |
38% |
|
Russell 2000 |
+19.96 |
2,287.55 |
+0.88% |
|
52 Wk Highs |
105 |
|
|
52 Wk Highs |
145 |
|
|
S&P 600 |
+4.35 |
1,355.09 |
+0.32% |
|
52 Wk Lows |
38 |
|
|
52 Wk Lows |
84 |
|
|
 |
Leadership Thinned While Major Indices Ended Mixed
Kenneth J. Gruneisen - Passed the CAN SLIM® Master's Exam
The Dow lost 234 points, dragging the blue chip index down 0.5% for the week amid weakness in bank shares. The S&P 500 dipped less than 0.1%, bringing its weekly decline to 0.8%. The Nasdaq Composite gained 0.8%, ending the week 0.8% lower. The volume totals were higher than the prior session totals on the NYSE and on the Nasdaq exchange, inflated by options expirations. Breadth was positive as advancers led decliners by a 9-7 margin on the NYSE and by a 5-3 margin on the Nasdaq exchange. There were 26 high-ranked companies from the Leaders List that hit new 52-week highs and were listed on the BreakOuts Page, versus the total of 85 on the prior session. New 52-week highs totals contracted but still outnumbered new 52-week lows totals which were also higher on both the NYSE and the Nasdaq exchange. The major indices are in a confirmed uptrend (M criteria). Investors are reminded to always make buying and selling decisions on case-by-case basis under the strict criteria and rules of the fact-based investment system.
PICTURED: The Nasdaq Composite Index has been encountering distributional pressure. It is sputtering below its 50-day moving average (DMA) line which acted as resistance. More damaging losses would raise greater concerns for the market outlook.
U.S. stocks finished mixed on Friday, with growth-oriented shares rebounding. Trading volume and volatility were elevated, as options and futures on indexes and equities simultaneously expired in a quarterly event known as triple witching.
The Federal Reserve remained in the spotlight, announcing it would allow a temporary bank leverage rule to expire at month-end. The pandemic-inspired relief allowed institutions to exclude U.S. Treasuries from the "supplementary leverage ratio" to encourage bank lending. Treasuries stabilized on the heels of Thursday’s rout, with the yield on the 10-year note steady at 1.72%. Still, Treasuries capped an eighth consecutive weekly decline. In commodities, WTI crude advanced 2.5% to $61.48/barrel, snapping a five-session losing streak.
Six of 11 S&P 500 sectors closed in positive territory with the Communication Services and Consumer Discretionary groups outperforming. Facebook (FB +4.12%) rose after its CEO said the company would be in a “stronger position” in the aftermath of a privacy policy update from Apple (AAPL -0.45%) . Financials trailed, with banks under pressure following the Fed announcement. In earnings, FedEx (FDX +6.10%) rose after the company delivered upbeat quarterly figures, fueled by "unprecedented" shipping volume during the holiday quarter. Nike (NKE -3.97%) fell as shipment delays and store closures weighed on its revenue. In other corporate news, Visa (V -6.24%) fell amid reports the Department of Justice is conducting an antitrust investigation. |
 Kenneth J. Gruneisen started out as a licensed stockbroker in August 1987, a couple of months prior to the historic stock market crash that took the Dow Jones Industrial Average down -22.6% in a single day. He has published daily fact-based fundamental and technical analysis on high-ranked stocks online for two decades. Through FACTBASEDINVESTING.COM, Kenneth provides educational articles, news, market commentary, and other information regarding proven investment systems that work in good times and bad.
Comments contained in the body of this report are technical opinions only and are not necessarily those of Gruneisen Growth Corp. The material herein has been obtained from sources believed to be reliable and accurate, however, its accuracy and completeness cannot be guaranteed. Our firm, employees, and customers may effect transactions, including transactions contrary to any recommendation herein, or have positions in the securities mentioned herein or options with respect thereto. Any recommendation contained in this report may not be suitable for all investors and it is not to be deemed an offer or solicitation on our part with respect to the purchase or sale of any securities. |
|
 |
Retail and Tech Indexes Led Group Gainers
Kenneth J. Gruneisen - Passed the CAN SLIM® Master's Exam
The Biotech Index ($BTK +1.49%) and Semiconductor Index ($SOX +1.28%) led the tech sector higher while the Networking Index ($NWX +0.43%) posted a smaller gain. The Retail Index ($RLX +1.56%) also had a positive influence on the major indices. While the Broker/Dealer Index ($XBD +0.61%) edged higher, the Bank Index ($BKX -1.64%) lost ground. Commodity-linked groups were mixed as the Oil Services Index ($OSX -0.50%) edged lower while the Integrated Oil Index ($XOI +0.73%) posted a modest gain and the Gold & Silver Index ($XAU +0.21%) also inched higher.
PICTURED: The Broker/Dealer Index ($XBD +0.61%) is hovering at its all-time high.
| Oil Services |
$OSX |
56.39 |
-0.28 |
-0.50% |
+27.20% |
| Integrated Oil |
$XOI |
1,017.49 |
+7.40 |
+0.73% |
+28.39% |
| Semiconductor |
$SOX |
3,014.38 |
+38.16 |
+1.28% |
+7.83% |
| Networking |
$NWX |
805.97 |
+3.48 |
+0.43% |
+12.39% |
| Broker/Dealer |
$XBD |
451.77 |
+2.75 |
+0.61% |
+19.64% |
| Retail |
$RLX |
3,584.08 |
+55.17 |
+1.56% |
+0.58% |
| Gold & Silver |
$XAU |
141.57 |
+0.30 |
+0.21% |
-1.82% |
| Bank |
$BKX |
121.29 |
-2.03 |
-1.64% |
+23.88% |
| Biotech |
$BTK |
5,579.59 |
+81.99 |
+1.49% |
-2.78% |
|
|
|
 |
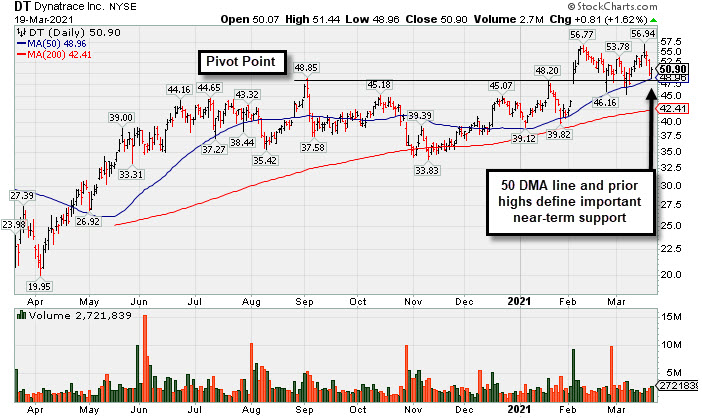
50-Day Moving Average Line Tested Again
Kenneth J. Gruneisen - Passed the CAN SLIM® Master's Exam
Dynatrace Inc (DT +$0.81 or +1.62% to $50.90) pulled back below its "max buy" level and found support above Its 50-day moving average (DMA) line ($48.96) which it recently tested. Prior highs in the $48 area also help define import near-term support. More damaging losses would raise serious concerns. Its Relative Strength Rating has slumped to 67, well below the 80+ minimum guideline for buy candidates.
Fundamentals remain strong after it reported Dec '20 earnings +70% on +28% sales revenues versus the year ago period. It has a 98 Earnings Per Share Rating. DT was highlighted in yellow with pivot point cited based on its 9/02/20 high in the 2/04/21 mid-day report (read here). The high-ranked Computer Sftwr-Enterprse firm was last shown in this FSU section on 3/03/21 with an annotated graph under the headline, "Consolidating Above Prior Highs and 50-Day Moving Average". It completed its $16.00 IPO on 8/01/19 and Secondary Offerings on 12/06/19, 2/21/20, and 6/03/20.
The number of top-rated funds owning its shares rose from 226 in Sep '19 to 745 in Dec '20, a reassuring sign concerning the I criteria. Its current Up/Down Volume ratio of 0.9 is an unbiased indication its shares have encountered slight distributional pressure over the past 50 days. It has a B Timeliness rating and a B Sponsorship rating.
|
|
|
Color Codes Explained :
Y - Better candidates highlighted by our
staff of experts.
G - Previously featured
in past reports as yellow but may no longer be buyable under the
guidelines.
***Last / Change / Volume data in this table is the closing quote data***
Symbol/Exchange
Company Name
Industry Group |
PRICE |
CHANGE
(%Change) |
Day High |
Volume
(% DAV)
(% 50 day avg vol) |
52 Wk Hi
% From Hi |
Featured
Date |
Price
Featured |
Pivot Featured |
|
Max Buy |
 FBC
-
NYSE
FBC
-
NYSE
Flagstar Bancorp Inc
BANKING - Savings and Loans
|
$47.58
|
-1.17
-2.40% |
$48.85
|
1,840,323
278.41% of 50 DAV
50 DAV is 661,000
|
$51.58
-7.75%
|
3/4/2021
|
$47.26
|
PP = $48.02
|
|
MB = $50.42
|
 Most Recent Note - 3/19/2021 5:16:49 PM
Y - Suffered a loss today with heavier volume, slumping below its pivot point and falling back into the prior base raising concerns. Its 50 DMA line ($45.45) and recent low define important near-term support to watch on pullbacks.
>>> FEATURED STOCK ARTICLE : Negative Reversal When Poised For Technical Breakout - 3/4/2021 |
View all notes |
Set NEW NOTE alert |
Company Profile |
SEC
News |
Chart |
Request a new note
C
A
S
I |
CRL
-
NYSE
Charles River Labs Intl
DRUGS - Biotechnology
|
$286.68
|
-1.60
-0.56% |
$292.00
|
457,432
145.22% of 50 DAV
50 DAV is 315,000
|
$303.79
-5.63%
|
12/17/2020
|
$247.06
|
PP = $257.98
|
|
MB = $270.88
|
Most Recent Note - 3/19/2021 5:18:11 PM
G - Extended from any sound base, still consolidating well above its 50 DMA line ($278.48) which acted as support throughout its ongoing ascent. Its Relative Strength Rating is 75, below the 80+ minimum guideline for buy candidates. Recently reported Dec '20 quarterly earnings +19% on +14% sales revenues versus the year ago period, below the +25% minimum earnings guideline (C criteria), raising fundamental concerns.
>>> FEATURED STOCK ARTICLE : Made Gradual Progress, Now Extended From Any Sound Base - 3/16/2021 |
View all notes |
Set NEW NOTE alert |
Company Profile |
SEC
News |
Chart |
Request a new note
C
A
S
I |
OPY
-
NYSE
Oppenheimer Holdings Inc
FINANCIAL SERVICES - Investment Brokerage - Regiona
|
$42.23
|
-1.06
-2.45% |
$44.24
|
269,521
212.22% of 50 DAV
50 DAV is 127,000
|
$44.38
-4.84%
|
2/25/2021
|
$38.95
|
PP = $38.11
|
|
MB = $40.02
|
Most Recent Note - 3/18/2021 5:37:08 PM
G - Hit another new all-time high with today's volume-driven gain. Disciplined investors avoid chasing stocks extended more than +5% above their pivot point.
>>> FEATURED STOCK ARTICLE : Perched at Record High After 6 Consecutive Gains - 3/12/2021 |
View all notes |
Set NEW NOTE alert |
Company Profile |
SEC
News |
Chart |
Request a new note
C
A
S
I |
CLFD
-
NASDAQ
Clearfield Inc
TELECOMMUNICATIONS - Cables / Satalite Equipment
|
$31.97
|
-0.04
-0.12% |
$32.27
|
159,269
92.60% of 50 DAV
50 DAV is 172,000
|
$38.75
-17.50%
|
1/20/2021
|
$31.38
|
PP = $28.42
|
|
MB = $29.84
|
Most Recent Note - 3/18/2021 5:31:04 PM
G - Pulled back today on lighter volume but closed below its 50 DMA line ($32.29) raising concerns. It has not formed a sound base of sufficient length. Prior highs in the $28 area previously acted as support. Fundamentals remain strong.
>>> FEATURED STOCK ARTICLE : Quiet Gain Repaired 50-Day Moving Average Violation - 3/9/2021 |
View all notes |
Set NEW NOTE alert |
Company Profile |
SEC
News |
Chart |
Request a new note
C
A
S
I |
EDUC
-
NASDAQ
Educational Development
WHOLESALE - Basic Materials Wholesale
|
$18.38
|
+0.65
3.67% |
$18.99
|
30,083
79.17% of 50 DAV
50 DAV is 38,000
|
$20.00
-8.10%
|
3/10/2021
|
$17.89
|
PP = $20.10
|
|
MB = $21.11
|
Most Recent Note - 3/19/2021 5:22:58 PM
Y - Rebounded toward its 52-week high with today's gain backed by light volume. Subsequent gains above the pivot point backed by at least +40% above average volume are needed to trigger a proper technical buy signal. This thinly traded Media - Books firm's annual earnings (A criteria) history has strong.
>>> FEATURED STOCK ARTICLE : Gain Leaves Media - Books Firm Perched Near Pivot Point - 3/10/2021 |
View all notes |
Set NEW NOTE alert |
Company Profile |
SEC
News |
Chart |
Request a new note
C
A
S
I |
Symbol/Exchange
Company Name
Industry Group |
PRICE |
CHANGE
(%Change) |
Day High |
Volume
(% DAV)
(% 50 day avg vol) |
52 Wk Hi
% From Hi |
Featured
Date |
Price
Featured |
Pivot Featured |
|
Max Buy |
SMPL
-
NASDAQ
Simply Good Foods Co
Food-Confectionery
|
$32.26
|
-0.64
-1.95% |
$32.48
|
2,205,541
326.75% of 50 DAV
50 DAV is 675,000
|
$35.25
-8.48%
|
12/28/2020
|
$30.40
|
PP = $31.44
|
|
MB = $33.01
|
Most Recent Note - 3/19/2021 1:10:00 PM
Y - Gapped down today after a weak finish on the prior session. Prior highs in the $32 area define initial support to watch above its 50 DMA line ($29.72). Its Relative Strength Rating is 77, below the 80+ minimum guideline for buy candidates.
>>> FEATURED STOCK ARTICLE : Found Support at 50-Day Moving Average; Relative Strength Improved - 3/5/2021 |
View all notes |
Set NEW NOTE alert |
Company Profile |
SEC
News |
Chart |
Request a new note
C
A
S
I |
XPEL
-
NASDAQ
Xpel Inc
Auto/Truck-Tires andamp; Misc
|
$56.07
|
+0.12
0.21% |
$56.62
|
324,808
106.15% of 50 DAV
50 DAV is 306,000
|
$65.74
-14.71%
|
3/11/2021
|
$59.70
|
PP = $60.87
|
|
MB = $63.91
|
Most Recent Note - 3/18/2021 5:29:30 PM
Y - Today's 4th loss in the span of 5 sessions completely negated the recent breakout as it rolled back into the prior base raising concerns. The next important support to watch is its 50 DMA line ($54.08).
>>> FEATURED STOCK ARTICLE : Powerful Breakout Backed by Heavy Volume - 3/11/2021 |
View all notes |
Set NEW NOTE alert |
Company Profile |
SEC
News |
Chart |
Request a new note
C
A
S
I |
DT
-
NYSE
Dynatrace Inc
Computer Sftwr-Enterprse
|
$50.90
|
+0.81
1.62% |
$51.44
|
2,721,839
103.14% of 50 DAV
50 DAV is 2,638,900
|
$56.94
-10.61%
|
2/4/2021
|
$51.39
|
PP = $48.95
|
|
MB = $51.40
|
Most Recent Note - 3/19/2021 5:21:08 PM
Y - Tested support again at its 50 DMA line ($48.96) today and managed a "positive reversal". Prior highs in the $48 area help define import near-term support. More damaging losses would raise serious concerns. Its Relative Strength Rating has slumped to 63, well below the 80+ minimum guideline for buy candidates. Fundamentals remain strong after it reported Dec '20 earnings +70% on +28% sales revenues versus the year ago period. See the latest FSU analysis for more details and a new annotated graph.
>>> FEATURED STOCK ARTICLE : 50-Day Moving Average Line Tested Again - 3/19/2021 |
View all notes |
Set NEW NOTE alert |
Company Profile |
SEC
News |
Chart |
Request a new note
C
A
S
I |
MRBK
-
NASDAQ
Meridian Corp
Banks-Northeast
|
$27.27
|
+0.69
2.60% |
$27.27
|
117,362
365.61% of 50 DAV
50 DAV is 32,100
|
$27.96
-2.47%
|
2/22/2021
|
$25.58
|
PP = $26.10
|
|
MB = $27.41
|
Most Recent Note - 3/18/2021 12:42:24 PM
Y - Pulling back for a 6th consecutive small loss today after a noted "negative reversal" at its 52-week high. Prior high defines initial support to watch above its 50 DMA line ($23.19) on pullbacks.
>>> FEATURED STOCK ARTICLE : Prior High Defines Initial Support to Watch - 3/15/2021 |
View all notes |
Set NEW NOTE alert |
Company Profile |
SEC
News |
Chart |
Request a new note
C
A
S
I |
|
|
|
THESE ARE NOT BUY RECOMMENDATIONS!
Comments contained in the body of this report are technical
opinions only. The material herein has been obtained
from sources believed to be reliable and accurate, however,
its accuracy and completeness cannot be guaranteed.
This site is not an investment advisor, hence it does
not endorse or recommend any securities or other investments.
Any recommendation contained in this report may not
be suitable for all investors and it is not to be deemed
an offer or solicitation on our part with respect to
the purchase or sale of any securities. All trademarks,
service marks and trade names appearing in this report
are the property of their respective owners, and are
likewise used for identification purposes only.
This report is a service available
only to active Paid Premium Members.
You may opt-out of receiving report notifications
at any time. Questions or comments may be submitted
by writing to Premium Membership Services 665 S.E. 10 Street, Suite 201 Deerfield Beach, FL 33441-5634 or by calling 1-800-965-8307
or 954-785-1121.
|
|
|