You are not logged in.
This means you
CAN ONLY VIEW reports that were published prior to Thursday, March 20, 2025.
You
MUST UPGRADE YOUR MEMBERSHIP if you want to see any current reports.
AFTER MARKET UPDATE - FRIDAY, MARCH 12TH, 2021
Previous After Market Report Next After Market Report >>>
|
|
|
|
DOW |
+293.05 |
32,778.64 |
+0.90% |
|
Volume |
947,079,492 |
-12% |
|
Volume |
5,498,293,500 |
-7% |
|
NASDAQ |
-78.81 |
13,319.86 |
-0.59% |
|
Advancers |
1,826 |
57% |
|
Advancers |
2,210 |
56% |
|
S&P 500 |
+4.00 |
3,943.34 |
+0.10% |
|
Decliners |
1,394 |
43% |
|
Decliners |
1,741 |
44% |
|
Russell 2000 |
+14.25 |
2,352.79 |
+0.61% |
|
52 Wk Highs |
485 |
|
|
52 Wk Highs |
496 |
|
|
S&P 600 |
+12.01 |
1,397.66 |
+0.87% |
|
52 Wk Lows |
13 |
|
|
52 Wk Lows |
24 |
|
|
 |
Major Indices Were Mixed on Friday, Yet All Higher for the Week
Kenneth J. Gruneisen - Passed the CAN SLIM® Master's Exam
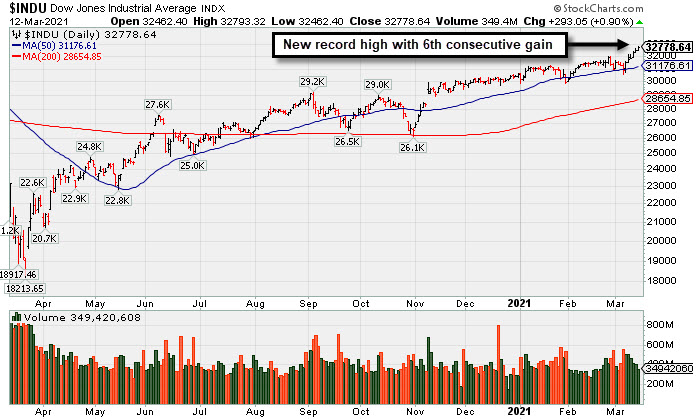
The Dow climbed 293 points to close at a fresh all-time high, lifting the blue chip index to its best week since November, up 4.1%. The S&P 500 eked out a gain of 0.1%, bringing its weekly advance to 2.6% and ending at a new record level. Tech and growth-oriented shares were pressured by another rise in interest rates, with the Nasdaq Composite shedding 0.6%. Still, the tech-heavy benchmark snapped a three-week losing streak, rising 3.1%. The small-cap Russell 2000 index also finished at another all-time high, soaring 7.3% on the week. The volume totals on Friday were lighter than the prior session totals on the NYSE and on the Nasdaq exchange. Advancers led decliners by a 9-7 margin on the NYSE and by an 11-9 margin on the Nasdaq exchange. There were 121 high-ranked companies from the Leaders List that hit new 52-week highs and were listed on the BreakOuts Page, matching the total of 121 on the prior session. New 52-week highs totals easily outnumbered new 52-week lows totals on the NYSE and on the Nasdaq exchange. Technical strength shown by the Blue Chip index and the Small Cap index ended a brief "correction" and resumed the prior market uptrend (M criteria). Investors are reminded to always make buying and selling decisions on case-by-case basis under the strict criteria and rules of the fact-based investment system.
PICTURED: The Dow Jones Industrial Average hit a new record high with its 6th consecutive gain.
U.S. stocks finished mixed on Friday, with the S&P 500 and Nasdaq still posting their best week since early February. Wall Street cheered a finalized $1.9 trillion fiscal stimulus package, while President Biden stated that every U.S. adult would be eligible for the COVID-19 vaccine by May.
Treasuries resumed their rout amid elevated expectations for a swift economic recovery and renewed inflation concerns. The yield on the 10-year note jumped 10 basis points to 1.62%, its highest closing level since January 2020. On the data front, producer prices increased 2.8% year-over-year in February, the fastest pace since October 2018. Separately, a preliminary report from the University of Michigan showed consumer sentiment improving more than expected this month, climbing to the highest level in a year. In commodities, WTI crude slipped 0.6% to $65.62/barrel, finishing lower for the first time in three weeks.
Nine of 11 S&P 500 sectors closed in positive territory. In earnings, Ulta Beauty slid 8.5% after cutting its 2021 comparable-store sales outlook. |
 Kenneth J. Gruneisen started out as a licensed stockbroker in August 1987, a couple of months prior to the historic stock market crash that took the Dow Jones Industrial Average down -22.6% in a single day. He has published daily fact-based fundamental and technical analysis on high-ranked stocks online for two decades. Through FACTBASEDINVESTING.COM, Kenneth provides educational articles, news, market commentary, and other information regarding proven investment systems that work in good times and bad.
Comments contained in the body of this report are technical opinions only and are not necessarily those of Gruneisen Growth Corp. The material herein has been obtained from sources believed to be reliable and accurate, however, its accuracy and completeness cannot be guaranteed. Our firm, employees, and customers may effect transactions, including transactions contrary to any recommendation herein, or have positions in the securities mentioned herein or options with respect thereto. Any recommendation contained in this report may not be suitable for all investors and it is not to be deemed an offer or solicitation on our part with respect to the purchase or sale of any securities. |
|
 |
Financial, Gold & Silver and Networking Indexes Rose
Kenneth J. Gruneisen - Passed the CAN SLIM® Master's Exam
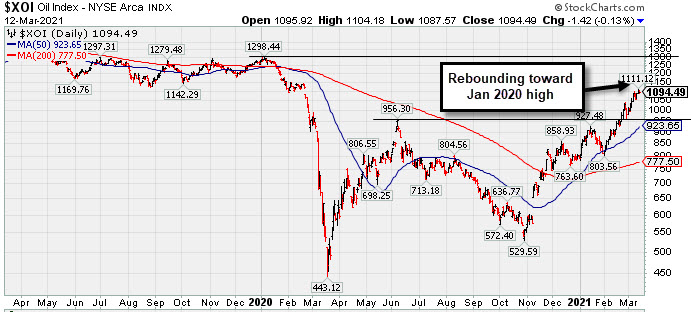
The Broker/Dealer Index ($XBD +0.95%) and Bank Index ($BKX +1.74%) both had a positive influence on the major averages while the Retail Index ($RLX +0.05%) was virtually unchanged. The tech sector was mixed as the Semiconductor Index ($SOX -1.07%) lost ground and the Biotech Index ($BTK -0.10%) finished flat while the Networking Index ($NWX +0.47%) eked out a modest gain. The Gold & Silver Index ($XAU +0.42%) edged higher while the Oil Services Index ($OSX -0.01%) and Integrated Oil Index ($XOI -0.13%) finished little changed on Friday.
PICTURED: The 2-year graph of the Integrated Oil Index ($XOI -0.13%) shows it has recently been rebounding toward its January 2020 high.
| Oil Services |
$OSX |
62.63 |
-0.00 |
-0.01% |
+41.29% |
| Integrated Oil |
$XOI |
1,094.49 |
-1.42 |
-0.13% |
+38.11% |
| Semiconductor |
$SOX |
2,965.09 |
-32.05 |
-1.07% |
+6.07% |
| Networking |
$NWX |
806.34 |
+3.80 |
+0.47% |
+12.44% |
| Broker/Dealer |
$XBD |
456.00 |
+4.28 |
+0.95% |
+20.76% |
| Retail |
$RLX |
3,553.65 |
+1.85 |
+0.05% |
-0.27% |
| Gold & Silver |
$XAU |
139.73 |
+0.59 |
+0.42% |
-3.09% |
| Bank |
$BKX |
123.35 |
+2.11 |
+1.74% |
+25.98% |
| Biotech |
$BTK |
5,547.85 |
-5.43 |
-0.10% |
-3.33% |
|
|
|
 |
Perched at Record High After 6 Consecutive Gains
Kenneth J. Gruneisen - Passed the CAN SLIM® Master's Exam
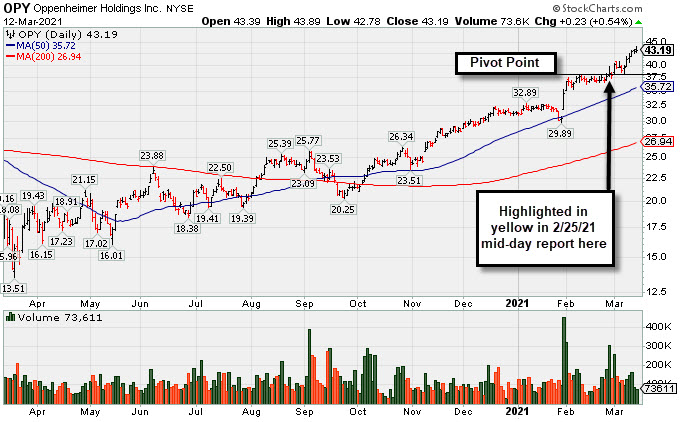
Oppenheimer Holdings Inc (OPY +$0.23 or +0.54% to $43.19) hit another new all-time high with today's 6th consecutive gain. Disciplined investors avoid chasing stocks extended more than +5% above their pivot point.
OPY stubbornly held its ground and made progress since noted in the 2/05/21 mid-day report - "Reported Dec '20 quarterly earnings +235% on +43% sales revenues versus the year ago period. Showed strong earnings increases over the year ago period in the past 3 quarterly comparisons. Annual earnings (A criteria) growth has been strong after a downturn and losses in FY '15 & '16." It has the highest possible Earnings Per Share Rating of 99.
The company hails from the FINANCIAL SERVICES - Investment Brokerage - Regional industry group which is now ranked 36th on the 197 Industry Groups list(L criteria). There is a small supply of only 9.2 million shares in the publicly traded float (S criteria) which can contribute to greater price volatility in the event of institutional buying or selling. The number of top-rated funds owning its shares reported fell from 214 in Jun '20 to 200 in Dec '20, however, its current Up/Down Volume Ratio of 1.5 is an unbiased indication its shares have been under slight accumulation over the past 50 days (I criteria).
|
|
|
Color Codes Explained :
Y - Better candidates highlighted by our
staff of experts.
G - Previously featured
in past reports as yellow but may no longer be buyable under the
guidelines.
***Last / Change / Volume data in this table is the closing quote data***
Symbol/Exchange
Company Name
Industry Group |
PRICE |
CHANGE
(%Change) |
Day High |
Volume
(% DAV)
(% 50 day avg vol) |
52 Wk Hi
% From Hi |
Featured
Date |
Price
Featured |
Pivot Featured |
|
Max Buy |
 FBC
-
NYSE
FBC
-
NYSE
Flagstar Bancorp Inc
BANKING - Savings and Loans
|
$51.12
|
+0.64
1.27% |
$51.58
|
596,251
91.03% of 50 DAV
50 DAV is 655,000
|
$50.52
1.19%
|
3/4/2021
|
$47.26
|
PP = $48.02
|
|
MB = $50.42
|
Most Recent Note - 3/11/2021 5:32:47 PM
G - Color code is changed to green after triggering a technical buy signal with a volume-driven gain and hitting a new 52-week high, closing above its "max buy" level with today's 4th consecutive gain. Its 50 DMA line ($44.38) and recent low define important near-term support to watch on pullbacks.
>>> FEATURED STOCK ARTICLE : Negative Reversal When Poised For Technical Breakout - 3/4/2021 |
View all notes |
Set NEW NOTE alert |
Company Profile |
SEC
News |
Chart |
Request a new note
C
A
S
I |
CRL
-
NYSE
Charles River Labs Intl
DRUGS - Biotechnology
|
$286.79
|
+1.79
0.63% |
$286.93
|
156,960
49.47% of 50 DAV
50 DAV is 317,300
|
$303.79
-5.60%
|
12/17/2020
|
$247.06
|
PP = $257.98
|
|
MB = $270.88
|
Most Recent Note - 3/11/2021 5:26:16 PM
G - Posted a gain today with light volume, consolidating above its 50 DMA line ($274) where it recently found prompt support again. Its Relative Strength Rating is 73, below the 80+ minimum guideline for buy candidates. Recently reported Dec '20 quarterly earnings +19% on +14% sales revenues versus the year ago period, below the +25% minimum earnings guideline (C criteria), raising concerns.
>>> FEATURED STOCK ARTICLE : CRL Still Hovering Near Record High - 3/1/2021 |
View all notes |
Set NEW NOTE alert |
Company Profile |
SEC
News |
Chart |
Request a new note
C
A
S
I |
OPY
-
NYSE
Oppenheimer Holdings Inc
FINANCIAL SERVICES - Investment Brokerage - Regiona
|
$43.19
|
+0.23
0.54% |
$43.89
|
73,611
58.42% of 50 DAV
50 DAV is 126,000
|
$43.40
-0.48%
|
2/25/2021
|
$38.95
|
PP = $38.11
|
|
MB = $40.02
|
 Most Recent Note - 3/12/2021 10:57:21 PM
G - Hit another new all-time high with today's 6th consecutive gain. Disciplined investors avoid chasing stocks extended more than +5% above their pivot point. See the latest FSU analysis for more details and a new annotated graph.
>>> FEATURED STOCK ARTICLE : Perched at Record High After 6 Consecutive Gains - 3/12/2021 |
View all notes |
Set NEW NOTE alert |
Company Profile |
SEC
News |
Chart |
Request a new note
C
A
S
I |
CLFD
-
NASDAQ
Clearfield Inc
TELECOMMUNICATIONS - Cables / Satalite Equipment
|
$34.86
|
+1.22
3.63% |
$35.08
|
161,208
97.70% of 50 DAV
50 DAV is 165,000
|
$38.75
-10.04%
|
1/20/2021
|
$31.38
|
PP = $28.42
|
|
MB = $29.84
|
Most Recent Note - 3/12/2021 11:03:37 PM
G - Posted a 4th consecutive gain with higher volume today. Found prompt support near its 50 DMA line but it has not formed a sound base of sufficient length. Prior highs in the $28 area acted as support. Fundamentals remain strong.
>>> FEATURED STOCK ARTICLE : Quiet Gain Repaired 50-Day Moving Average Violation - 3/9/2021 |
View all notes |
Set NEW NOTE alert |
Company Profile |
SEC
News |
Chart |
Request a new note
C
A
S
I |
EDUC
-
NASDAQ
Educational Development
WHOLESALE - Basic Materials Wholesale
|
$18.98
|
-0.14
-0.73% |
$19.35
|
29,241
76.95% of 50 DAV
50 DAV is 38,000
|
$20.00
-5.10%
|
3/10/2021
|
$17.89
|
PP = $20.10
|
|
MB = $21.11
|
Most Recent Note - 3/11/2021 5:28:53 PM
Y - Challenged its best-ever close and its 52-week high with today's 4th consecutive gain. Subsequent gains above the pivot point backed by at least +40% above average volume are needed to trigger a proper technical buy signal. Found support at its 200 DMA line ($14.48) since noted with caution in the 10/22/20 mid-day report. Reported earnings +55% on +63% sales revenues for the Nov '20 quarter versus the year-ago period, its 3rd strong quarterly comparison above the +25% minimum guideline (C criteria), helping it better match with the fact-based investment system's fundamental guidelines. This thinly traded Media - Books firm's annual earnings (A criteria) history has strong. See the latest FSU analysis for more details and an annotated graph.
>>> FEATURED STOCK ARTICLE : Gain Leaves Media - Books Firm Perched Near Pivot Point - 3/10/2021 |
View all notes |
Set NEW NOTE alert |
Company Profile |
SEC
News |
Chart |
Request a new note
C
A
S
I |
Symbol/Exchange
Company Name
Industry Group |
PRICE |
CHANGE
(%Change) |
Day High |
Volume
(% DAV)
(% 50 day avg vol) |
52 Wk Hi
% From Hi |
Featured
Date |
Price
Featured |
Pivot Featured |
|
Max Buy |
SMPL
-
NASDAQ
Simply Good Foods Co
Food-Confectionery
|
$32.72
|
-0.71
-2.12% |
$34.48
|
1,033,560
142.17% of 50 DAV
50 DAV is 727,000
|
$35.25
-7.18%
|
12/28/2020
|
$30.40
|
PP = $31.44
|
|
MB = $33.01
|
Most Recent Note - 3/12/2021 10:59:33 PM
Y - Pulled back for a 2nd consecutive session with above average volume after spiking to a new 52-week high with heavier volume triggering a technical buy signal. Its 50 DMA line ($29.41) recently acted as support. Its Relative Strength Rating is 76, below the 80+ minimum guideline for buy candidates. Its prior low ($26.78) defines the next important near term support to watch.
>>> FEATURED STOCK ARTICLE : Found Support at 50-Day Moving Average; Relative Strength Improved - 3/5/2021 |
View all notes |
Set NEW NOTE alert |
Company Profile |
SEC
News |
Chart |
Request a new note
C
A
S
I |
XPEL
-
NASDAQ
Xpel Inc
Auto/Truck-Tires andamp; Misc
|
$63.04
|
-0.47
-0.74% |
$65.57
|
400,830
136.34% of 50 DAV
50 DAV is 294,000
|
$65.74
-4.11%
|
3/11/2021
|
$59.70
|
PP = $60.87
|
|
MB = $63.91
|
Most Recent Note - 3/11/2021 5:23:07 PM
Y - Finished strong after highlighted in yellow with pivot point cited based on its 1/14/21 high plus 10 cents in the earlier mid-day report. The big gain and strong close above its pivot point backed by +250% above average volume triggered a new technical buy signal as it hit a new 52-week high. Repaired a recently noted 50 DMA line violation and showed great resilience after dropped from the Featured Stocks list on 2/25/21. See the latest FSU analysis more details and a new annotated graph.
>>> FEATURED STOCK ARTICLE : Powerful Breakout Backed by Heavy Volume - 3/11/2021 |
View all notes |
Set NEW NOTE alert |
Company Profile |
SEC
News |
Chart |
Request a new note
C
A
S
I |
DT
-
NYSE
Dynatrace Inc
Computer Sftwr-Enterprse
|
$52.76
|
-1.35
-2.49% |
$53.47
|
1,612,331
62.01% of 50 DAV
50 DAV is 2,600,000
|
$56.77
-7.06%
|
2/4/2021
|
$51.39
|
PP = $48.95
|
|
MB = $51.40
|
Most Recent Note - 3/11/2021 5:27:09 PM
G - Posted a 3rd consecutive big gain today with below average volume. Found prompt support after testing prior highs in the $48 area and its 50 DMA line ($47.67). More damaging losses would raise serious concerns. Its Relative Strength Rating is 77, still below the 80+ minimum guideline for buy candidates. Fundamentals remain strong after it reported Dec '20 earnings +70% on +28% sales revenues versus the year ago period.
>>> FEATURED STOCK ARTICLE : Consolidating Above Prior Highs and 50-Day Moving Average - 3/3/2021 |
View all notes |
Set NEW NOTE alert |
Company Profile |
SEC
News |
Chart |
Request a new note
C
A
S
I |
MRBK
-
NASDAQ
Meridian Corp
Banks-Northeast
|
$26.60
|
-0.38
-1.41% |
$27.35
|
40,702
139.87% of 50 DAV
50 DAV is 29,100
|
$27.96
-4.86%
|
2/22/2021
|
$25.58
|
PP = $26.10
|
|
MB = $27.41
|
Most Recent Note - 3/12/2021 11:01:59 PM
Y - Pulled back today after a "negative reversal" on the prior session after hitting a new 52-week high. Prior high ($26) defines initial support to watch on pullbacks.
>>> FEATURED STOCK ARTICLE : Negative Reversal When Poised to Convincingly Breakout - 2/22/2021 |
View all notes |
Set NEW NOTE alert |
Company Profile |
SEC
News |
Chart |
Request a new note
C
A
S
I |
|
|
|
THESE ARE NOT BUY RECOMMENDATIONS!
Comments contained in the body of this report are technical
opinions only. The material herein has been obtained
from sources believed to be reliable and accurate, however,
its accuracy and completeness cannot be guaranteed.
This site is not an investment advisor, hence it does
not endorse or recommend any securities or other investments.
Any recommendation contained in this report may not
be suitable for all investors and it is not to be deemed
an offer or solicitation on our part with respect to
the purchase or sale of any securities. All trademarks,
service marks and trade names appearing in this report
are the property of their respective owners, and are
likewise used for identification purposes only.
This report is a service available
only to active Paid Premium Members.
You may opt-out of receiving report notifications
at any time. Questions or comments may be submitted
by writing to Premium Membership Services 665 S.E. 10 Street, Suite 201 Deerfield Beach, FL 33441-5634 or by calling 1-800-965-8307
or 954-785-1121.
|
|
|