You are not logged in.
This means you
CAN ONLY VIEW reports that were published prior to Thursday, March 20, 2025.
You
MUST UPGRADE YOUR MEMBERSHIP if you want to see any current reports.
AFTER MARKET UPDATE - THURSDAY, MARCH 11TH, 2021
Previous After Market Report Next After Market Report >>>
|
|
|
|
DOW |
+188.57 |
32,485.59 |
+0.58% |
|
Volume |
1,071,688,737 |
-11% |
|
Volume |
5,908,082,200 |
-1% |
|
NASDAQ |
+327.60 |
13,396.43 |
+2.51% |
|
Advancers |
2,363 |
73% |
|
Advancers |
3,051 |
78% |
|
S&P 500 |
+40.53 |
3,939.34 |
+1.04% |
|
Decliners |
852 |
26% |
|
Decliners |
882 |
22% |
|
Russell 2000 |
+52.86 |
2,338.54 |
+2.31% |
|
52 Wk Highs |
511 |
|
|
52 Wk Highs |
440 |
|
|
S&P 600 |
+18.66 |
1,385.65 |
+1.37% |
|
52 Wk Lows |
7 |
|
|
52 Wk Lows |
17 |
|
|
 |
Breadth Positive and More Leadership Behind Major Indices Gains
Kenneth J. Gruneisen - Passed the CAN SLIM® Master's Exam
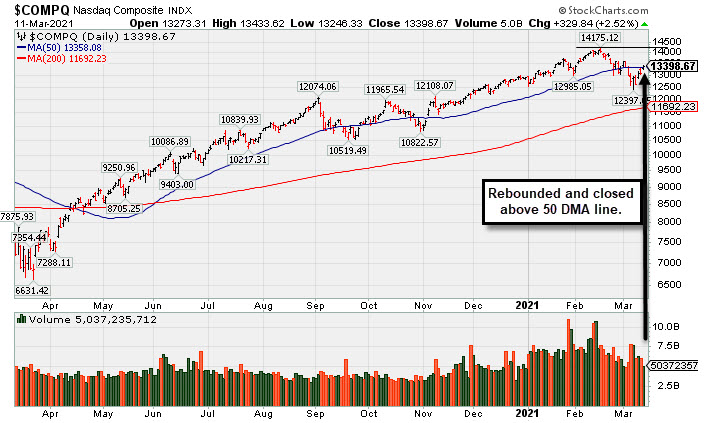
Both the Dow and S&P 500 closed at new record levels, with the blue-chip stock index rising 188 points and the large-cap benchmark gaining 1%. The tech-heavy Nasdaq Composite jumped 2.5%, turning positive for the month and heading for a 3.7% weekly advance. Small-cap stocks also rallied, with the Russell 2000 notching a new all-time high. The volume was lighter than the prior session totals on the NYSE and on the Nasdaq exchange. Advancers led decliners by almost a 3-1 margin on the NYSE and by more than a 3-1 margin on the Nasdaq exchange. There were 121 high-ranked companies from the Leaders List that hit new 52-week highs and were listed on the BreakOuts Page, versus the total of 111 on the prior session. New 52-week highs totals expanded and easily outnumbered shrinking new 52-week lows totals on the NYSE and on the Nasdaq exchange. Technical strength shown by the Blue Chip index and the Small Cap index ended a brief "correction" and resumed the prior market uptrend (M criteria). Investors are reminded to always make buying and selling decisions on case-by-case basis under the strict criteria and rules of the fact-based investment system.
PICTURED: The Nasdaq Composite Index rebounded and closed above its 50-day moving average (DMA) line. It closed -5.5% off its record high.
U.S. equities finished broadly higher on Thursday as investors monitored a rebound in tech and growth-oriented shares. Updates on the U.S. labor market were in focus, with initial jobless claims coming in at 712,000 in the latest week, below expectations for a 725,000 increase and the lowest since early November. Separately, the Jobs Opening and Labor Turnover Survey (JOLTS) showed the number of U.S. job openings rose slightly to 6.9 million in January from December's upwardly revised 6.7 million figure. Treasuries were mixed, with the yield curve modestly steepening. Concerns of weak demand for U.S. government debt were allayed after today’s $24 billion auction in 30-year bonds sold in-line with expectations. The yield on the 10-year note was unchanged at 1.52%, while the 30-year bond yield climbed two basis points to 2.26%.
Eight of 11 S&P 500 sectors finished in positive territory. The Information Technology and Communication Services sectors paced the gains, with the oft-cited FAANG group climbing more than 2%. Chipmakers also provided a tailwind following news that U.S. and Chinese semiconductor trade groups would work together to ease recent trade tensions between the two countries. In earnings, Oracle Corp (ORCL -6.49%) after providing disappointing forward guidance. AMC Entertainment (AMC +4.37%) rose following a smaller-than-anticipated quarterly loss. |
 Kenneth J. Gruneisen started out as a licensed stockbroker in August 1987, a couple of months prior to the historic stock market crash that took the Dow Jones Industrial Average down -22.6% in a single day. He has published daily fact-based fundamental and technical analysis on high-ranked stocks online for two decades. Through FACTBASEDINVESTING.COM, Kenneth provides educational articles, news, market commentary, and other information regarding proven investment systems that work in good times and bad.
Comments contained in the body of this report are technical opinions only and are not necessarily those of Gruneisen Growth Corp. The material herein has been obtained from sources believed to be reliable and accurate, however, its accuracy and completeness cannot be guaranteed. Our firm, employees, and customers may effect transactions, including transactions contrary to any recommendation herein, or have positions in the securities mentioned herein or options with respect thereto. Any recommendation contained in this report may not be suitable for all investors and it is not to be deemed an offer or solicitation on our part with respect to the purchase or sale of any securities. |
|
 |
Tech, Retail, and Gold & Silver Indexes Led Group Gainers
Kenneth J. Gruneisen - Passed the CAN SLIM® Master's Exam
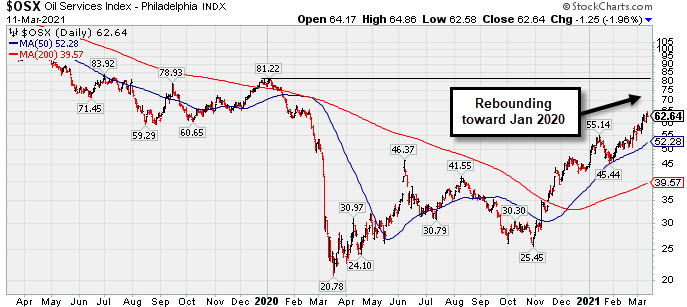
The Semiconductor Index ($SOX +4.10%) and Networking Index ($NWX +3.02%) led the tech sector higher while the Biotech Index ($BTK +2.35%) also rose. The Retail Index ($RLX +1.38%) had a positive influence on the major averages and the Broker/Dealer Index ($XBD +0.59%) posted a small gain while the Bank Index ($BKX -0.10%) edged lower. The Oil Services Index ($OSX -1.95%) lost ground while the Integrated Oil Index ($XOI +0.91%) posted a modest gain. The Gold & Silver Index ($XAU +2.59%) posted a solid gain but remains below its 50 and 200 DMA lines.
PICTURED: The 2-year graph of the Oil Services Index ($OSX -1.95%) shows it has recently been rebounding toward its January 2020 high.
| Oil Services |
$OSX |
62.64 |
-1.25 |
-1.95% |
+41.31% |
| Integrated Oil |
$XOI |
1,095.92 |
+9.85 |
+0.91% |
+38.29% |
| Semiconductor |
$SOX |
2,997.30 |
+117.98 |
+4.10% |
+7.22% |
| Networking |
$NWX |
802.54 |
+23.50 |
+3.02% |
+11.91% |
| Broker/Dealer |
$XBD |
451.72 |
+2.67 |
+0.59% |
+19.63% |
| Retail |
$RLX |
3,551.80 |
+48.20 |
+1.38% |
-0.32% |
| Gold & Silver |
$XAU |
139.16 |
+3.51 |
+2.59% |
-3.49% |
| Bank |
$BKX |
121.24 |
-0.12 |
-0.10% |
+23.83% |
| Biotech |
$BTK |
5,553.28 |
+127.68 |
+2.35% |
-3.24% |
|
|
|
 |
Powerful Breakout Backed by Heavy Volume
Kenneth J. Gruneisen - Passed the CAN SLIM® Master's Exam
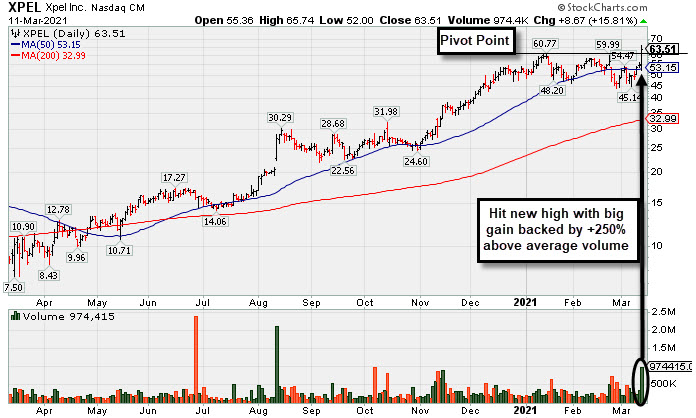
Xpel Inc (XPEL +$8.67 or +15.81% to $63.51) finished strong after highlighted in yellow with pivot point cited based on its 1/14/21 high plus 10 cents in the earlier mid-day report (read here). The gain and strong close above its pivot point backed by +250% above average volume triggered a new technical buy signal.
XPEL hit a new 52-week high (N criteria) with today's big volume-driven gain. It repaired a recently noted 50 DMA line violation and showed great resilience after dropped from the Featured Stocks list on 2/25/21. XPEL was highlighted in yellow with pivot point cited based on its 1/14/21 high plus 10 cents in the prior mid-day report (read here) while noted - "A gain and strong close above its pivot point backed by at least +40% above average volume may trigger a technical buy signal. Keep in mind it is a riskier late-stage base, however, no resistance remains due to overhead supply as its challenging its all-time high after finding prompt support at its 50 DMA line ($52.86) during prior consolidations."
This Auto/Truck - Replacement Parts firm reported Dec '20 quarterly earnings +29% on +0% sales revenues versus the year ago period, marking the 3rd quarterly comparison above the +25% minimum earnings guideline (C criteria). Annual earnings history has been strong after a downturn in FY '17.
The number of top-rated funds owning its shares rose from 45 in Mar '20 to 171 in Dec '20, a reassuring sign concerning the I criteria. Its current Up/Down Volume Ratio of 1.3 is an unbiased indication its shares have been under accumulation over the past 50 days. Its small supply of only 27.6 million shares outstanding (S criteria) can contribute to greater volatility in the event of institutional buying or selling. |
|
|
Color Codes Explained :
Y - Better candidates highlighted by our
staff of experts.
G - Previously featured
in past reports as yellow but may no longer be buyable under the
guidelines.
***Last / Change / Volume data in this table is the closing quote data***
Symbol/Exchange
Company Name
Industry Group |
PRICE |
CHANGE
(%Change) |
Day High |
Volume
(% DAV)
(% 50 day avg vol) |
52 Wk Hi
% From Hi |
Featured
Date |
Price
Featured |
Pivot Featured |
|
Max Buy |
 FBC
-
NYSE
FBC
-
NYSE
Flagstar Bancorp Inc
BANKING - Savings and Loans
|
$50.48
|
+1.98
4.08% |
$50.52
|
797,390
122.86% of 50 DAV
50 DAV is 649,000
|
$49.15
2.71%
|
3/4/2021
|
$47.26
|
PP = $48.02
|
|
MB = $50.42
|
 Most Recent Note - 3/11/2021 5:32:47 PM
G - Color code is changed to green after triggering a technical buy signal with a volume-driven gain and hitting a new 52-week high, closing above its "max buy" level with today's 4th consecutive gain. Its 50 DMA line ($44.38) and recent low define important near-term support to watch on pullbacks.
>>> FEATURED STOCK ARTICLE : Negative Reversal When Poised For Technical Breakout - 3/4/2021 |
View all notes |
Set NEW NOTE alert |
Company Profile |
SEC
News |
Chart |
Request a new note
C
A
S
I |
CRL
-
NYSE
Charles River Labs Intl
DRUGS - Biotechnology
|
$285.00
|
+8.41
3.04% |
$287.00
|
216,659
68.15% of 50 DAV
50 DAV is 317,900
|
$303.79
-6.19%
|
12/17/2020
|
$247.06
|
PP = $257.98
|
|
MB = $270.88
|
Most Recent Note - 3/11/2021 5:26:16 PM
G - Posted a gain today with light volume, consolidating above its 50 DMA line ($274) where it recently found prompt support again. Its Relative Strength Rating is 73, below the 80+ minimum guideline for buy candidates. Recently reported Dec '20 quarterly earnings +19% on +14% sales revenues versus the year ago period, below the +25% minimum earnings guideline (C criteria), raising concerns.
>>> FEATURED STOCK ARTICLE : CRL Still Hovering Near Record High - 3/1/2021 |
View all notes |
Set NEW NOTE alert |
Company Profile |
SEC
News |
Chart |
Request a new note
C
A
S
I |
OPY
-
NYSE
Oppenheimer Holdings Inc
FINANCIAL SERVICES - Investment Brokerage - Regiona
|
$42.96
|
+0.05
0.12% |
$43.40
|
87,984
69.28% of 50 DAV
50 DAV is 127,000
|
$43.13
-0.39%
|
2/25/2021
|
$38.95
|
PP = $38.11
|
|
MB = $40.02
|
Most Recent Note - 3/10/2021 5:59:16 PM
G - Closed strong today as it hit another new all-time high with a 4th consecutive gain backed by above average volume. Disciplined investors avoid chasing stocks extended more than +5% above their pivot point.
>>> FEATURED STOCK ARTICLE : Rose From "3-weeks Tight" Base But Ended Near Session Low - 2/25/2021 |
View all notes |
Set NEW NOTE alert |
Company Profile |
SEC
News |
Chart |
Request a new note
C
A
S
I |
CLFD
-
NASDAQ
Clearfield Inc
TELECOMMUNICATIONS - Cables / Satalite Equipment
|
$33.64
|
+1.92
6.05% |
$33.66
|
111,285
68.27% of 50 DAV
50 DAV is 163,000
|
$38.75
-13.19%
|
1/20/2021
|
$31.38
|
PP = $28.42
|
|
MB = $29.84
|
Most Recent Note - 3/11/2021 5:25:00 PM
G - Posted a 3rd consecutive big gain with light volume today. Found prompt support near its 50 DMA line but it has not formed a sound base of sufficient length. Prior highs in the $28 area acted as support. Fundamentals remain strong.
>>> FEATURED STOCK ARTICLE : Quiet Gain Repaired 50-Day Moving Average Violation - 3/9/2021 |
View all notes |
Set NEW NOTE alert |
Company Profile |
SEC
News |
Chart |
Request a new note
C
A
S
I |
EDUC
-
NASDAQ
Educational Development
WHOLESALE - Basic Materials Wholesale
|
$19.12
|
+0.73
3.97% |
$19.50
|
43,293
113.93% of 50 DAV
50 DAV is 38,000
|
$20.00
-4.40%
|
3/10/2021
|
$17.89
|
PP = $20.10
|
|
MB = $21.11
|
Most Recent Note - 3/11/2021 5:28:53 PM
Y - Challenged its best-ever close and its 52-week high with today's 4th consecutive gain. Subsequent gains above the pivot point backed by at least +40% above average volume are needed to trigger a proper technical buy signal. Found support at its 200 DMA line ($14.48) since noted with caution in the 10/22/20 mid-day report. Reported earnings +55% on +63% sales revenues for the Nov '20 quarter versus the year-ago period, its 3rd strong quarterly comparison above the +25% minimum guideline (C criteria), helping it better match with the fact-based investment system's fundamental guidelines. This thinly traded Media - Books firm's annual earnings (A criteria) history has strong. See the latest FSU analysis for more details and an annotated graph.
>>> FEATURED STOCK ARTICLE : Gain Leaves Media - Books Firm Perched Near Pivot Point - 3/10/2021 |
View all notes |
Set NEW NOTE alert |
Company Profile |
SEC
News |
Chart |
Request a new note
C
A
S
I |
Symbol/Exchange
Company Name
Industry Group |
PRICE |
CHANGE
(%Change) |
Day High |
Volume
(% DAV)
(% 50 day avg vol) |
52 Wk Hi
% From Hi |
Featured
Date |
Price
Featured |
Pivot Featured |
|
Max Buy |
SMPL
-
NASDAQ
Simply Good Foods Co
Food-Confectionery
|
$33.43
|
-0.32
-0.95% |
$35.25
|
1,391,437
133.41% of 50 DAV
50 DAV is 1,043,000
|
$34.59
-3.35%
|
12/28/2020
|
$30.40
|
PP = $31.44
|
|
MB = $33.01
|
Most Recent Note - 3/10/2021 12:40:12 PM
Y - Spiking near and above its "max buy" level to a new 52-week high with heavier volume behind today's 5th consecutive gain triggering a technical buy signal. Its 50 DMA line ($29.28) recently acted as support. Its Relative Strength Rating is 80, right at the minimum guideline for buy candidates. Its prior low ($26.78) defines the next important near term support to watch.
>>> FEATURED STOCK ARTICLE : Found Support at 50-Day Moving Average; Relative Strength Improved - 3/5/2021 |
View all notes |
Set NEW NOTE alert |
Company Profile |
SEC
News |
Chart |
Request a new note
C
A
S
I |
XPEL
-
NASDAQ
Xpel Inc
Auto/Truck-Tires andamp; Misc
|
$63.51
|
+8.67
15.81% |
$65.74
|
974,415
350.51% of 50 DAV
50 DAV is 278,000
|
$60.77
4.51%
|
3/11/2021
|
$59.70
|
PP = $60.87
|
|
MB = $63.91
|
Most Recent Note - 3/11/2021 5:23:07 PM
Y - Finished strong after highlighted in yellow with pivot point cited based on its 1/14/21 high plus 10 cents in the earlier mid-day report. The big gain and strong close above its pivot point backed by +250% above average volume triggered a new technical buy signal as it hit a new 52-week high. Repaired a recently noted 50 DMA line violation and showed great resilience after dropped from the Featured Stocks list on 2/25/21. See the latest FSU analysis more details and a new annotated graph.
>>> FEATURED STOCK ARTICLE : Powerful Breakout Backed by Heavy Volume - 3/11/2021 |
View all notes |
Set NEW NOTE alert |
Company Profile |
SEC
News |
Chart |
Request a new note
C
A
S
I |
DT
-
NYSE
Dynatrace Inc
Computer Sftwr-Enterprse
|
$54.11
|
+3.01
5.89% |
$54.41
|
2,001,346
77.21% of 50 DAV
50 DAV is 2,592,000
|
$56.77
-4.69%
|
2/4/2021
|
$51.39
|
PP = $48.95
|
|
MB = $51.40
|
Most Recent Note - 3/11/2021 5:27:09 PM
G - Posted a 3rd consecutive big gain today with below average volume. Found prompt support after testing prior highs in the $48 area and its 50 DMA line ($47.67). More damaging losses would raise serious concerns. Its Relative Strength Rating is 77, still below the 80+ minimum guideline for buy candidates. Fundamentals remain strong after it reported Dec '20 earnings +70% on +28% sales revenues versus the year ago period.
>>> FEATURED STOCK ARTICLE : Consolidating Above Prior Highs and 50-Day Moving Average - 3/3/2021 |
View all notes |
Set NEW NOTE alert |
Company Profile |
SEC
News |
Chart |
Request a new note
C
A
S
I |
MRBK
-
NASDAQ
Meridian Corp
Banks-Northeast
|
$26.98
|
-0.41
-1.50% |
$27.96
|
42,569
152.03% of 50 DAV
50 DAV is 28,000
|
$27.90
-3.30%
|
2/22/2021
|
$25.58
|
PP = $26.10
|
|
MB = $27.41
|
Most Recent Note - 3/10/2021 5:58:21 PM
Y - Ended near its "max buy" level as it posted a 6th consecutive gain today with +48% above average volume, rising further above the pivot point and hitting a new 52-week high, clinching a technical buy signal. Prior high $26 defines initial support to watch on pullbacks.
>>> FEATURED STOCK ARTICLE : Negative Reversal When Poised to Convincingly Breakout - 2/22/2021 |
View all notes |
Set NEW NOTE alert |
Company Profile |
SEC
News |
Chart |
Request a new note
C
A
S
I |
|
|
|
THESE ARE NOT BUY RECOMMENDATIONS!
Comments contained in the body of this report are technical
opinions only. The material herein has been obtained
from sources believed to be reliable and accurate, however,
its accuracy and completeness cannot be guaranteed.
This site is not an investment advisor, hence it does
not endorse or recommend any securities or other investments.
Any recommendation contained in this report may not
be suitable for all investors and it is not to be deemed
an offer or solicitation on our part with respect to
the purchase or sale of any securities. All trademarks,
service marks and trade names appearing in this report
are the property of their respective owners, and are
likewise used for identification purposes only.
This report is a service available
only to active Paid Premium Members.
You may opt-out of receiving report notifications
at any time. Questions or comments may be submitted
by writing to Premium Membership Services 665 S.E. 10 Street, Suite 201 Deerfield Beach, FL 33441-5634 or by calling 1-800-965-8307
or 954-785-1121.
|
|
|