You are not logged in.
This means you
CAN ONLY VIEW reports that were published prior to Thursday, March 20, 2025.
You
MUST UPGRADE YOUR MEMBERSHIP if you want to see any current reports.
AFTER MARKET UPDATE - FRIDAY, MARCH 5TH, 2021
Previous After Market Report Next After Market Report >>>
|
|
|
|
DOW |
+572.16 |
31,496.30 |
+1.85% |
|
Volume |
1,390,108,412 |
-4% |
|
Volume |
7,652,877,800 |
-1% |
|
NASDAQ |
+198.86 |
12,922.33 |
+1.56% |
|
Advancers |
2,479 |
78% |
|
Advancers |
2,691 |
69% |
|
S&P 500 |
+73.47 |
3,841.94 |
+1.95% |
|
Decliners |
692 |
22% |
|
Decliners |
1,187 |
31% |
|
Russell 2000 |
+45.29 |
2,192.21 |
+2.11% |
|
52 Wk Highs |
215 |
|
|
52 Wk Highs |
256 |
|
|
S&P 600 |
+29.85 |
1,302.12 |
+2.35% |
|
52 Wk Lows |
93 |
|
|
52 Wk Lows |
198 |
|
|
Weak action has raised a red flag concerning the M criteria. Damaging losses have been noted as the mood of the market has abruptly shifted. Raise cash by selling stocks on a case-by-case basis as the market dictates. Disciplined investors will watch for a new rally and follow-through day before considering any new buying efforts.
|
 |
Breadth Positive as Major Indices Rose With Lighter Volume
Kenneth J. Gruneisen - Passed the CAN SLIM® Master's Exam
The Dow climbed 572 points, bouncing back from a 150-point decline to cap a 1.8% weekly advance. The S&P 500 also erased early session losses to rise 2%, lifting the broad index 0.8% higher for the week. The Nasdaq Composite was whipsawed in choppy trading, eventually ending the session up 1.6%, paring its third consecutive weekly drop to 2.1%. The volume was lighter than the prior session totals on the NYSE and on the Nasdaq exchange. Advancers led decliners by more than a 3-1 margin on the NYSE and by more than 2-1 on the Nasdaq exchange. There were 63 high-ranked companies from the Leaders List that hit new 52-week highs and were listed on the BreakOuts Page, versus the total of 40 on the prior session. New 52-week highs outnumbered new 52-week lows totals on the NYSE and on the Nasdaq exchange. The major indices are in a correction (M criteria). Investors are reminded to raise cash and avoid new buying efforts until a new confirmed rally marked by a solid follow-through day.
PICTURED: The Nasdaq Composite Index posted a gain with lighter volume on Friday. It violated its 50-day moving average (DMA) line with damaging losses on higher volume.
U.S. stocks ended a volatile week on a positive note Friday. Investors monitored another jump in Treasury yields and digested a robust monthly jobs report. On the data front, the Labor Department's monthly non-farm payrolls report showed the U.S. economy added 379,000 jobs in February, well above expectations of a 200,000 gain and January's upwardly revised 166,000 figure. Meanwhile, the unemployment rate unexpectedly fell to 6.2% from the prior 6.3% reading. Following the release, the yield on the 10-year note surged above 1.60% before paring the spike. Still, Treasuries finished lower for the fifth straight week, with the yield on the 10-year note having surged 16 basis points to 1.56% since last Friday's (February 26) close.
All 11 S&P 500 sectors ended in positive territory. Energy shares once again outperformed, rallying over 10% for the week amid a jump in oil prices. WTI crude's more than 7% weekly gain lifted the U.S. benchmark above $66/barrel, helped by a surprise decision from OPEC+ to extend production cuts into April. Consumer Discretionary shares lagged, with Tesla (TSLA -3.78%) down for a fourth consecutive week. In earnings, chipmaker Broadcom (AVGO +1.48%) rose following a top and bottom line beat. In other corporate news, Oracle (ORCL +6.58%) rose to new all-time highs after an analyst upgrade. |
 Kenneth J. Gruneisen started out as a licensed stockbroker in August 1987, a couple of months prior to the historic stock market crash that took the Dow Jones Industrial Average down -22.6% in a single day. He has published daily fact-based fundamental and technical analysis on high-ranked stocks online for two decades. Through FACTBASEDINVESTING.COM, Kenneth provides educational articles, news, market commentary, and other information regarding proven investment systems that work in good times and bad.
Comments contained in the body of this report are technical opinions only and are not necessarily those of Gruneisen Growth Corp. The material herein has been obtained from sources believed to be reliable and accurate, however, its accuracy and completeness cannot be guaranteed. Our firm, employees, and customers may effect transactions, including transactions contrary to any recommendation herein, or have positions in the securities mentioned herein or options with respect thereto. Any recommendation contained in this report may not be suitable for all investors and it is not to be deemed an offer or solicitation on our part with respect to the purchase or sale of any securities. |
|
 |
Commodity-Linked Groups Led Tech, Financial, and Retail Indexes
Kenneth J. Gruneisen - Passed the CAN SLIM® Master's Exam
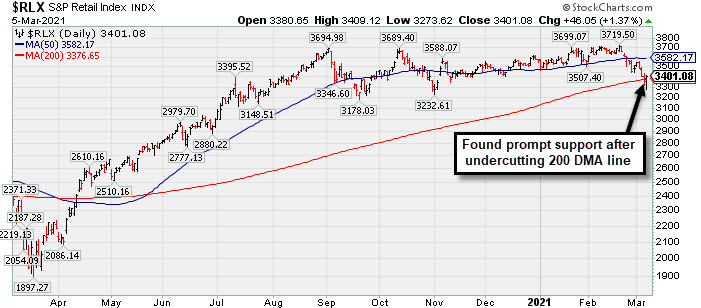
The Bank Index ($BKX +1.69%) and Broker/Dealer Index ($XBD +0.87%) had a positive influence on the major indices along with the Retail Index ($RLX +1.37%). The Semiconductor Index ($SOX +3.17%) and Biotech Index ($BTK +2.53%) led the tech rebound while the Networking Index ($NWX +0.77%) posted a smaller gain. Commodity-linked groups rose as the Oil Services Index ($OSX +6.64%) and Integrated Oil Index ($XOI +3.98%) posted standout gains, outpacing the Gold & Silver Index ($XAU +2.22%).
PICTURED: The Retail Index ($RLX +1.37%) graph shows that it found prompt support after undercutting its 200-day moving average line.
| Oil Services |
$OSX |
61.85 |
+3.85 |
+6.64% |
+39.52% |
| Integrated Oil |
$XOI |
1,086.22 |
+41.55 |
+3.98% |
+37.07% |
| Semiconductor |
$SOX |
2,921.44 |
+89.80 |
+3.17% |
+4.51% |
| Networking |
$NWX |
748.64 |
+5.74 |
+0.77% |
+4.39% |
| Broker/Dealer |
$XBD |
430.95 |
+3.71 |
+0.87% |
+14.13% |
| Retail |
$RLX |
3,401.08 |
+46.05 |
+1.37% |
-4.55% |
| Gold & Silver |
$XAU |
133.58 |
+2.91 |
+2.22% |
-7.36% |
| Bank |
$BKX |
118.31 |
+1.97 |
+1.69% |
+20.84% |
| Biotech |
$BTK |
5,536.55 |
+136.50 |
+2.53% |
-3.53% |
|
|
|
 |
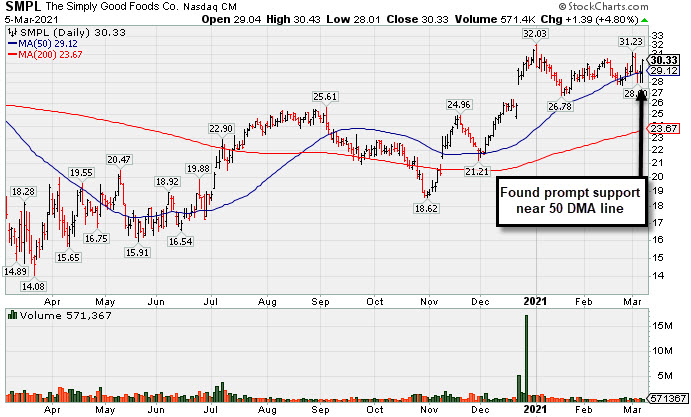
Found Support at 50-Day Moving Average; Relative Strength Improved
Kenneth J. Gruneisen - Passed the CAN SLIM® Master's Exam
Simply Good Foods Co (SMPL +$1.39 or +4.80% to $30.33) posted a big gain today with below average volume. It has been retesting its 50-day moving average (DMA) line ($29.1) which recently acted as support. Its Relative Strength Rating is 81, above the 80+ minimum guideline. Its prior low ($26.78) defines the next important near term support to watch.
SMPL was last shown in this FSU section on 2/17/21 with an annotated graph included under the headline, "Pulling Back Quietly After Rebounding Near All-Time High". It was first highlighted in yellow with pivot point cited based on its 9/09/19 high plus 10 cents in the 12/28/20 mid-day report (read here).
Fundamentals remain strong. It report Nov '20 quarterly earnings +32% on +52% sales revenues versus the year ago period, its 4th consecutive quarterly comparison above the +25% minimum earnings guideline (C criteria). Its annual earnings history (A criteria) has been strong.
SMPL completed a new Pubic Offering on 10/09/19. The company has a Timeliness Rating of B and Sponsorship Rating of C. The number of top-rated funds owning its shares fell from 442 in Dec '19 to 345 in Dec '20, however, its current Up/Down Volume Ratio of 2.6 is an unbiased indication its shares have been under accumulation over the past 50 days.
Some leadership has been provided by other companies in the Food/Beverage Sector, however, the Food-Confectionery industry group has a Group Relative Strength Rating of 3 (E) which is a concern regarding the L criteria. There are only 5 companies listed in the group.
|
|
|
Color Codes Explained :
Y - Better candidates highlighted by our
staff of experts.
G - Previously featured
in past reports as yellow but may no longer be buyable under the
guidelines.
***Last / Change / Volume data in this table is the closing quote data***
Symbol/Exchange
Company Name
Industry Group |
PRICE |
CHANGE
(%Change) |
Day High |
Volume
(% DAV)
(% 50 day avg vol) |
52 Wk Hi
% From Hi |
Featured
Date |
Price
Featured |
Pivot Featured |
|
Max Buy |
 FBC
-
NYSE
FBC
-
NYSE
Flagstar Bancorp Inc
BANKING - Savings and Loans
|
$43.77
|
-0.30
-0.68% |
$45.47
|
941,668
152.23% of 50 DAV
50 DAV is 618,600
|
$49.15
-10.95%
|
3/4/2021
|
$47.26
|
PP = $48.02
|
|
MB = $50.42
|
Most Recent Note - 3/4/2021 6:18:34 PM
Y - There was a "negative reversal" today at its 52-week high after featured in yellow with pivot point cited based on its 1/26/21 high plus 10 cents in the earlier mid-day report. Subsequent gains and a strong close above the pivot point backed by at least +40% above average volume are needed to trigger a proper technical buy signal. See the latest FSU analysis for more details and a new annotated graph.
>>> FEATURED STOCK ARTICLE : Negative Reversal When Poised For Technical Breakout - 3/4/2021 |
View all notes |
Set NEW NOTE alert |
Company Profile |
SEC
News |
Chart |
Request a new note
C
A
S
I |
CRL
-
NYSE
Charles River Labs Intl
DRUGS - Biotechnology
|
$273.82
|
+5.66
2.11% |
$274.81
|
352,813
111.30% of 50 DAV
50 DAV is 317,000
|
$303.79
-9.87%
|
12/17/2020
|
$247.06
|
PP = $257.98
|
|
MB = $270.88
|
Most Recent Note - 3/4/2021 6:21:04 PM
G - Violated its 50 DMA line with a loss today with below average volume. Sputtering since it reported Dec '20 quarterly earnings +19% on +14% sales revenues versus the year ago period, below the +25% minimum earnings guideline (C criteria).
>>> FEATURED STOCK ARTICLE : CRL Still Hovering Near Record High - 3/1/2021 |
View all notes |
Set NEW NOTE alert |
Company Profile |
SEC
News |
Chart |
Request a new note
C
A
S
I |
OPY
-
NYSE
Oppenheimer Holdings Inc
FINANCIAL SERVICES - Investment Brokerage - Regiona
|
$39.55
|
+0.70
1.80% |
$39.99
|
97,092
78.94% of 50 DAV
50 DAV is 123,000
|
$40.84
-3.16%
|
2/25/2021
|
$38.95
|
PP = $38.11
|
|
MB = $40.02
|
Most Recent Note - 3/2/2021 12:48:55 PM
G - Hit another new all-time high today following a noted spurt of volume-driven gains since featured in the 2/25/21 mid-day report. Disciplined investors avoid chasing stocks extended more than +5% above their pivot point.
>>> FEATURED STOCK ARTICLE : Rose From "3-weeks Tight" Base But Ended Near Session Low - 2/25/2021 |
View all notes |
Set NEW NOTE alert |
Company Profile |
SEC
News |
Chart |
Request a new note
C
A
S
I |
CLFD
-
NASDAQ
Clearfield Inc
TELECOMMUNICATIONS - Cables / Satalite Equipment
|
$30.15
|
-0.68
-2.21% |
$31.27
|
189,943
120.22% of 50 DAV
50 DAV is 158,000
|
$38.75
-22.19%
|
1/20/2021
|
$31.38
|
PP = $28.42
|
|
MB = $29.84
|
Most Recent Note - 3/4/2021 5:14:30 PM
G - Testing support at its 50 DMA line ($30.76) with today's damaging volume-driven loss. Prior highs in the $28 area define the next near-term support to watch. Fundamentals remain strong.
>>> FEATURED STOCK ARTICLE : Consolidating Well Above 50-Day Moving Average Line - 2/24/2021 |
View all notes |
Set NEW NOTE alert |
Company Profile |
SEC
News |
Chart |
Request a new note
C
A
S
I |
SMPL
-
NASDAQ
Simply Good Foods Co
Food-Confectionery
|
$30.33
|
+1.39
4.80% |
$30.43
|
571,367
50.25% of 50 DAV
50 DAV is 1,137,000
|
$32.03
-5.31%
|
12/28/2020
|
$30.40
|
PP = $31.44
|
|
MB = $33.01
|
 Most Recent Note - 3/5/2021 5:13:20 PM
Y - Posted a big gain today with below average volume. Its 50 DMA line ($29.12) recently acted as support. Its Relative Strength Rating improved to 81, above the 80+ minimum guideline. Its prior low ($26.78) defines the next important near term support to watch. See the latest FSU analysis for more details and a new annotated graph.
>>> FEATURED STOCK ARTICLE : Found Support at 50-Day Moving Average; Relative Strength Improved - 3/5/2021 |
View all notes |
Set NEW NOTE alert |
Company Profile |
SEC
News |
Chart |
Request a new note
C
A
S
I |
Symbol/Exchange
Company Name
Industry Group |
PRICE |
CHANGE
(%Change) |
Day High |
Volume
(% DAV)
(% 50 day avg vol) |
52 Wk Hi
% From Hi |
Featured
Date |
Price
Featured |
Pivot Featured |
|
Max Buy |
DT
-
NYSE
Dynatrace Inc
Computer Sftwr-Enterprse
|
$49.93
|
+1.81
3.76% |
$50.30
|
3,687,535
147.21% of 50 DAV
50 DAV is 2,504,900
|
$56.77
-12.05%
|
2/4/2021
|
$51.39
|
PP = $48.95
|
|
MB = $51.40
|
Most Recent Note - 3/4/2021 5:50:17 PM
G - Pulled back with above average volume today, testing prior highs in the $48 area and its 50 DMA line ($46.94). More damaging losses would raise serious concerns. Fundamentals remain strong after it reported Dec '20 earnings +70% on +28% sales revenues versus the year ago period.
>>> FEATURED STOCK ARTICLE : Consolidating Above Prior Highs and 50-Day Moving Average - 3/3/2021 |
View all notes |
Set NEW NOTE alert |
Company Profile |
SEC
News |
Chart |
Request a new note
C
A
S
I |
MRBK
-
NASDAQ
Meridian Corp
Banks-Northeast
|
$26.12
|
+0.12
0.46% |
$26.41
|
28,018
96.61% of 50 DAV
50 DAV is 29,000
|
$26.94
-3.04%
|
2/22/2021
|
$25.58
|
PP = $26.10
|
|
MB = $27.41
|
Most Recent Note - 3/4/2021 1:01:11 PM
Y - Posting a solid gain today with above average volume, rising above the pivot point and challenging its 52-week high. Pivot point cited was based on its 12/18/21 high plus 10 cents. Repeatedly noted - "Subsequent gains and a strong close above its pivot point backed by at least +40% above average volume may help clinch a convincing technical buy signal. Fundamentals are strong.
>>> FEATURED STOCK ARTICLE : Negative Reversal When Poised to Convincingly Breakout - 2/22/2021 |
View all notes |
Set NEW NOTE alert |
Company Profile |
SEC
News |
Chart |
Request a new note
C
A
S
I |
|
|
|
THESE ARE NOT BUY RECOMMENDATIONS!
Comments contained in the body of this report are technical
opinions only. The material herein has been obtained
from sources believed to be reliable and accurate, however,
its accuracy and completeness cannot be guaranteed.
This site is not an investment advisor, hence it does
not endorse or recommend any securities or other investments.
Any recommendation contained in this report may not
be suitable for all investors and it is not to be deemed
an offer or solicitation on our part with respect to
the purchase or sale of any securities. All trademarks,
service marks and trade names appearing in this report
are the property of their respective owners, and are
likewise used for identification purposes only.
This report is a service available
only to active Paid Premium Members.
You may opt-out of receiving report notifications
at any time. Questions or comments may be submitted
by writing to Premium Membership Services 665 S.E. 10 Street, Suite 201 Deerfield Beach, FL 33441-5634 or by calling 1-800-965-8307
or 954-785-1121.
|
|
|