You are not logged in.
This means you
CAN ONLY VIEW reports that were published prior to Thursday, March 20, 2025.
You
MUST UPGRADE YOUR MEMBERSHIP if you want to see any current reports.
AFTER MARKET UPDATE - THURSDAY, MARCH 25TH, 2021
Previous After Market Report Next After Market Report >>>
|
|
|
|
DOW |
+199.42 |
32,619.48 |
+0.62% |
|
Volume |
1,062,773,814 |
+5% |
|
Volume |
5,593,786,700 |
-9% |
|
NASDAQ |
+15.59 |
12,977.48 |
+0.12% |
|
Advancers |
2,081 |
65% |
|
Advancers |
2,564 |
63% |
|
S&P 500 |
+20.38 |
3,909.52 |
+0.52% |
|
Decliners |
1,131 |
35% |
|
Decliners |
1,493 |
37% |
|
Russell 2000 |
+48.86 |
2,183.12 |
+2.29% |
|
52 Wk Highs |
63 |
|
|
52 Wk Highs |
44 |
|
|
S&P 600 |
+33.16 |
1,299.99 |
+2.62% |
|
52 Wk Lows |
207 |
|
|
52 Wk Lows |
376 |
|
|
 |
Breadth Positive as Major Indices Show Resilience
Kenneth J. Gruneisen - Passed the CAN SLIM® Master's Exam
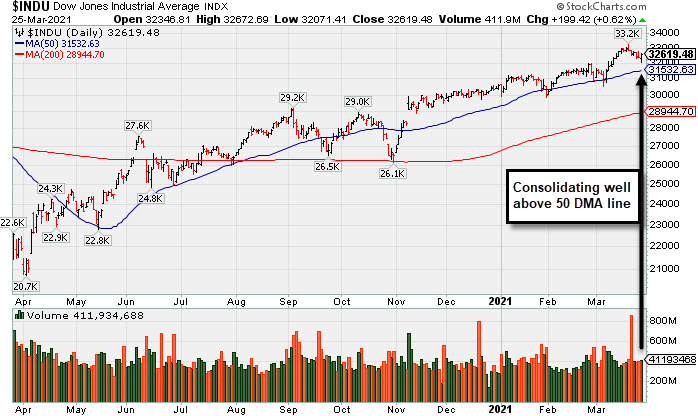
The Dow climbed 199 points, a sharp turnaround from an earlier decline of more than 300 points. The S&P 500 turned 0.5% higher, while the Nasdaq Composite eked out a gain of 0.1%. The small-cap Russell 2000 jumped 2.7% after briefly dipping into correction territory (defined as a 10% decline from a recent peak). The volume totals were mixed, higher than the prior session total on the NYSE and lighter on the Nasdaq exchange. Breadth was positive as advancers led decliners by almost a 2-1 margin on the NYSE and by a 5-3 margin on the Nasdaq exchange. Leadership remained thin as there were 6 high-ranked companies from the Leaders List that hit new 52-week highs and were listed on the BreakOuts Page, versus the total of 8 on the prior session. New 52-week lows totals grew and outnumbered shrinking new 52-week highs totals on both the NYSE and the Nasdaq exchange. The major indices (M criteria) are in an uptrend under pressure while leadership has been thinning. Investors are reminded to always make buying and selling decisions on case-by-case basis under the strict criteria and rules of the fact-based investment system.
PICTURED: The Dow Jones Industrial Average is consolidating above its 50-day moving average (DMA) line which defines important near-term chart support to watch.
U.S. stocks advanced in choppy trading Thursday, with quarter-end rebalancing contributing to increased volatility. President Biden announced an updated goal of deploying 200 million coronavirus vaccine doses during his first 100 days in office.
Longer-dated Treasuries weakened following a slightly softer-than-anticipated seven-year auction. The yield on the 10-year note rose two basis points to 1.63%. In central bank news, Fed Chair Jerome Powell noted that asset purchases would gradually be rolled back at some point, though any tapering would occur “very, very gradually over time.” On the data front, weekly initial jobless claims came in at 684,000, the lowest since the pandemic began. In commodities, WTI crude fell 4.5% to $58.44/barrel despite the removal of a container ship blocking traffic in the Suez Canal expected to take weeks.
Nine of 11 S&P 500 sectors finished in positive territory. Communication Services and Technology lagged as big tech CEOs appeared before Congress to discuss online misinformation. In corporate news, Boeing (BA +3.32%) after announcing plans to resume delivery of its 787 Dreamliner jets this week. Nike (NKE -3.39%) as the athletic apparel maker faced boycott pressure in China. Rite Aid Corp (RAD -20.44%) fell on news the drugstore chain is likely to post a loss for its most recent fiscal year. |
 Kenneth J. Gruneisen started out as a licensed stockbroker in August 1987, a couple of months prior to the historic stock market crash that took the Dow Jones Industrial Average down -22.6% in a single day. He has published daily fact-based fundamental and technical analysis on high-ranked stocks online for two decades. Through FACTBASEDINVESTING.COM, Kenneth provides educational articles, news, market commentary, and other information regarding proven investment systems that work in good times and bad.
Comments contained in the body of this report are technical opinions only and are not necessarily those of Gruneisen Growth Corp. The material herein has been obtained from sources believed to be reliable and accurate, however, its accuracy and completeness cannot be guaranteed. Our firm, employees, and customers may effect transactions, including transactions contrary to any recommendation herein, or have positions in the securities mentioned herein or options with respect thereto. Any recommendation contained in this report may not be suitable for all investors and it is not to be deemed an offer or solicitation on our part with respect to the purchase or sale of any securities. |
|
 |
Financial, Tech, and Oil Services Indexes Rose
Kenneth J. Gruneisen - Passed the CAN SLIM® Master's Exam
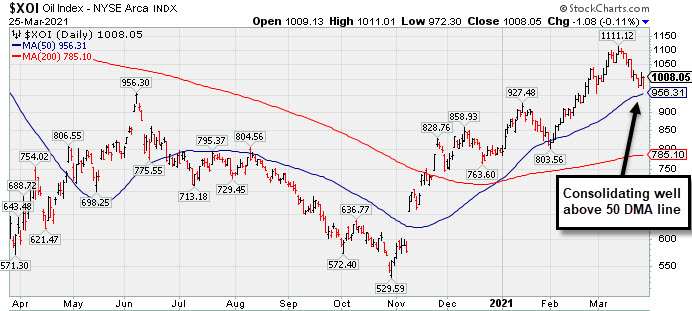
Financials had a positive influence on the major averages as the Bank Index ($BKX +2.82%) and Broker/Dealer Index ($XBD +1.28%) both posted solid gains. The Networking Index ($NWX +2.27%) and Biotech Index ($BTK +1.79%) both posted solid gains and the Semiconductor Index ($SOX +0.20%) also inched higher. The Retail Index ($RLX -0.04%) finished flat. The Oil Services Index ($OSX +1.33%) rose, meanwhile the Integrated Oil Index ($XOI -0.11%) edged lower and the Gold & Silver Index ($XAU -0.64%) also lost ground.
PICTURED: The Integrated Oil Index ($XOI -0.11%) is consolidating above its 50-day moving average (DMA) line.
| Oil Services |
$OSX |
53.66 |
+0.71 |
+1.33% |
+21.05% |
| Integrated Oil |
$XOI |
1,008.05 |
-1.08 |
-0.11% |
+27.20% |
| Semiconductor |
$SOX |
2,959.93 |
+5.96 |
+0.20% |
+5.88% |
| Networking |
$NWX |
789.30 |
+17.56 |
+2.27% |
+10.06% |
| Broker/Dealer |
$XBD |
437.28 |
+5.52 |
+1.28% |
+15.81% |
| Retail |
$RLX |
3,581.96 |
-1.37 |
-0.04% |
+0.52% |
| Gold & Silver |
$XAU |
132.84 |
-0.86 |
-0.64% |
-7.87% |
| Bank |
$BKX |
119.35 |
+3.28 |
+2.82% |
+21.90% |
| Biotech |
$BTK |
5,425.00 |
+95.50 |
+1.79% |
-5.47% |
|
|
|
 |
Featured Stocks
Kenneth J. Gruneisen - Passed the CAN SLIM® Master's Exam
|
|
|
Color Codes Explained :
Y - Better candidates highlighted by our
staff of experts.
G - Previously featured
in past reports as yellow but may no longer be buyable under the
guidelines.
***Last / Change / Volume data in this table is the closing quote data***
Symbol/Exchange
Company Name
Industry Group |
PRICE |
CHANGE
(%Change) |
Day High |
Volume
(% DAV)
(% 50 day avg vol) |
52 Wk Hi
% From Hi |
Featured
Date |
Price
Featured |
Pivot Featured |
|
Max Buy |
 FBC
-
NYSE
FBC
-
NYSE
Flagstar Bancorp Inc
BANKING - Savings and Loans
|
$44.62
|
+0.53
1.20% |
$44.94
|
541,153
81.01% of 50 DAV
50 DAV is 668,000
|
$51.58
-13.49%
|
3/4/2021
|
$47.26
|
PP = $48.02
|
|
MB = $50.42
|
Most Recent Note - 3/23/2021 4:21:06 PM
G - Suffered a 4th consecutive loss today with lighter volume and violated its 50 DMA line ($45.59) raising greater concerns. Color code is changed to green. Only a prompt rebound would help its outlook improve. Near-term support to watch is prior lows. See the latest FSU analysis for more details and an annotated graph.
>>> FEATURED STOCK ARTICLE : Slumping Into Prior Base Following Breakout - 3/22/2021 |
View all notes |
Set NEW NOTE alert |
Company Profile |
SEC
News |
Chart |
Request a new note
C
A
S
I |
CRL
-
NYSE
Charles River Labs Intl
DRUGS - Biotechnology
|
$281.95
|
+5.74
2.08% |
$283.79
|
262,364
83.56% of 50 DAV
50 DAV is 314,000
|
$303.79
-7.19%
|
12/17/2020
|
$247.06
|
PP = $257.98
|
|
MB = $270.88
|
Most Recent Note - 3/23/2021 5:31:37 PM
G - Today's loss had lighter volume as it slumped near its 50 DMA line ($279) which acted as support throughout its ongoing ascent. Its Relative Strength Rating is 76, below the 80+ minimum guideline for buy candidates. Recently reported Dec '20 quarterly earnings +19% on +14% sales revenues versus the year ago period, below the +25% minimum earnings guideline (C criteria), raising fundamental concerns.
>>> FEATURED STOCK ARTICLE : Made Gradual Progress, Now Extended From Any Sound Base - 3/16/2021 |
View all notes |
Set NEW NOTE alert |
Company Profile |
SEC
News |
Chart |
Request a new note
C
A
S
I |
OPY
-
NYSE
Oppenheimer Holdings Inc
FINANCIAL SERVICES - Investment Brokerage - Regiona
|
$39.93
|
+0.34
0.86% |
$40.04
|
152,003
114.29% of 50 DAV
50 DAV is 133,000
|
$44.38
-10.03%
|
2/25/2021
|
$38.95
|
PP = $38.11
|
|
MB = $40.02
|
 Most Recent Note - 3/25/2021 11:38:35 AM
Y - Pulling back for a 5th consecutive loss, consolidating after getting extended from the previously noted base. Its 50 DMA line ($37.53) defines near-term support to watch.
>>> FEATURED STOCK ARTICLE : Perched at Record High After 6 Consecutive Gains - 3/12/2021 |
View all notes |
Set NEW NOTE alert |
Company Profile |
SEC
News |
Chart |
Request a new note
C
A
S
I |
CLFD
-
NASDAQ
Clearfield Inc
TELECOMMUNICATIONS - Cables / Satalite Equipment
|
$29.90
|
+0.21
0.71% |
$30.14
|
164,459
90.36% of 50 DAV
50 DAV is 182,000
|
$38.75
-22.84%
|
1/20/2021
|
$31.38
|
PP = $28.42
|
|
MB = $29.84
|
Most Recent Note - 3/23/2021 4:12:07 PM
G - Sank further below its 50 DMA line ($32.62) with today's 4th consecutive damaging loss. Prior highs in the $28 area previously acted as support. Fundamentals remain strong.
>>> FEATURED STOCK ARTICLE : Quiet Gain Repaired 50-Day Moving Average Violation - 3/9/2021 |
View all notes |
Set NEW NOTE alert |
Company Profile |
SEC
News |
Chart |
Request a new note
C
A
S
I |
EDUC
-
NASDAQ
Educational Development
WHOLESALE - Basic Materials Wholesale
|
$16.77
|
-0.12
-0.71% |
$17.50
|
25,650
67.50% of 50 DAV
50 DAV is 38,000
|
$20.00
-16.15%
|
3/10/2021
|
$17.89
|
PP = $20.10
|
|
MB = $21.11
|
Most Recent Note - 3/23/2021 5:29:49 PM
Y - Retreating after challenging its 52-week high. Subsequent gains above the pivot point backed by at least +40% above average volume are needed to trigger a proper technical buy signal. This thinly traded Media - Books firm's annual earnings (A criteria) history has strong.
>>> FEATURED STOCK ARTICLE : Gain Leaves Media - Books Firm Perched Near Pivot Point - 3/10/2021 |
View all notes |
Set NEW NOTE alert |
Company Profile |
SEC
News |
Chart |
Request a new note
C
A
S
I |
Symbol/Exchange
Company Name
Industry Group |
PRICE |
CHANGE
(%Change) |
Day High |
Volume
(% DAV)
(% 50 day avg vol) |
52 Wk Hi
% From Hi |
Featured
Date |
Price
Featured |
Pivot Featured |
|
Max Buy |
SMPL
-
NASDAQ
Simply Good Foods Co
Food-Confectionery
|
$29.44
|
+0.76
2.65% |
$29.68
|
843,494
120.31% of 50 DAV
50 DAV is 701,100
|
$35.25
-16.48%
|
12/28/2020
|
$30.40
|
PP = $31.44
|
|
MB = $33.01
|
Most Recent Note - 3/25/2021 5:38:05 PM
G - Today's gain helped it rebound near its 50 DMA line ($29.76) which may act as resistance after damaging losses. Only a prompt rebound and close above the 50 DMA line would help its outlook improve. Its Relative Strength Rating is 63, below the 80+ minimum guideline for buy candidates. See the latest FSU analysis for more details and an annotated graph.
>>> FEATURED STOCK ARTICLE : Violation of 50-Day Moving Average Triggered Technical Sell Signal - 3/24/2021 |
View all notes |
Set NEW NOTE alert |
Company Profile |
SEC
News |
Chart |
Request a new note
C
A
S
I |
XPEL
-
NASDAQ
Xpel Inc
Auto/Truck-Tires andamp; Misc
|
$53.99
|
+2.63
5.12% |
$54.66
|
163,191
54.58% of 50 DAV
50 DAV is 299,000
|
$65.74
-17.87%
|
3/11/2021
|
$59.70
|
PP = $60.87
|
|
MB = $63.91
|
Most Recent Note - 3/25/2021 5:35:43 PM
G - Today's gain with light volume helped it to rebound and close just above its 50 DMA line ($53.92) helping its outlook improve. Still, it faces resistance due to overhead supply up to the $65 level.
>>> FEATURED STOCK ARTICLE : Powerful Breakout Backed by Heavy Volume - 3/11/2021 |
View all notes |
Set NEW NOTE alert |
Company Profile |
SEC
News |
Chart |
Request a new note
C
A
S
I |
DT
-
NYSE
Dynatrace Inc
Computer Sftwr-Enterprse
|
$47.98
|
-0.06
-0.12% |
$48.19
|
2,780,449
104.93% of 50 DAV
50 DAV is 2,649,700
|
$56.94
-15.74%
|
2/4/2021
|
$51.39
|
PP = $48.95
|
|
MB = $51.40
|
Most Recent Note - 3/24/2021 6:07:05 PM
G - Color code is changed to green after today's big loss violated its 50 DMA line ($49.46) raising concerns. Prior highs in the $48 area help define import near-term support. More damaging losses would raise serious concerns. Its Relative Strength Rating has slumped to 54, well below the 80+ minimum guideline for buy candidates. Fundamentals remain strong after it reported Dec '20 earnings +70% on +28% sales revenues versus the year ago period.
>>> FEATURED STOCK ARTICLE : 50-Day Moving Average Line Tested Again - 3/19/2021 |
View all notes |
Set NEW NOTE alert |
Company Profile |
SEC
News |
Chart |
Request a new note
C
A
S
I |
MRBK
-
NASDAQ
Meridian Corp
Banks-Northeast
|
$25.50
|
+0.27
1.07% |
$25.61
|
23,894
68.27% of 50 DAV
50 DAV is 35,000
|
$27.96
-8.80%
|
2/22/2021
|
$25.58
|
PP = $26.10
|
|
MB = $27.41
|
Most Recent Note - 3/24/2021 6:02:32 PM
Y - Reversed an early gain and closed near the session low with today's 3rd consecutive loss. Prior high defines initial support to watch above its 50 DMA line ($23.57) on pullbacks.
>>> FEATURED STOCK ARTICLE : Prior High Defines Initial Support to Watch - 3/15/2021 |
View all notes |
Set NEW NOTE alert |
Company Profile |
SEC
News |
Chart |
Request a new note
C
A
S
I |
|
|
|
THESE ARE NOT BUY RECOMMENDATIONS!
Comments contained in the body of this report are technical
opinions only. The material herein has been obtained
from sources believed to be reliable and accurate, however,
its accuracy and completeness cannot be guaranteed.
This site is not an investment advisor, hence it does
not endorse or recommend any securities or other investments.
Any recommendation contained in this report may not
be suitable for all investors and it is not to be deemed
an offer or solicitation on our part with respect to
the purchase or sale of any securities. All trademarks,
service marks and trade names appearing in this report
are the property of their respective owners, and are
likewise used for identification purposes only.
This report is a service available
only to active Paid Premium Members.
You may opt-out of receiving report notifications
at any time. Questions or comments may be submitted
by writing to Premium Membership Services 665 S.E. 10 Street, Suite 201 Deerfield Beach, FL 33441-5634 or by calling 1-800-965-8307
or 954-785-1121.
|
|
|