You are not logged in.
This means you
CAN ONLY VIEW reports that were published prior to Thursday, March 20, 2025.
You
MUST UPGRADE YOUR MEMBERSHIP if you want to see any current reports.
AFTER MARKET UPDATE - THURSDAY, MARCH 18TH, 2021
Previous After Market Report Next After Market Report >>>
|
|
|
|
DOW |
-153.07 |
32,862.30 |
-0.46% |
|
Volume |
1,144,825,842 |
+9% |
|
Volume |
5,655,457,800 |
+4% |
|
NASDAQ |
-405.45 |
13,119.75 |
-3.00% |
|
Advancers |
697 |
21% |
|
Advancers |
977 |
25% |
|
S&P 500 |
-58.66 |
3,915.46 |
-1.48% |
|
Decliners |
2,574 |
79% |
|
Decliners |
3,002 |
75% |
|
Russell 2000 |
-68.81 |
2,267.59 |
-2.94% |
|
52 Wk Highs |
338 |
|
|
52 Wk Highs |
274 |
|
|
S&P 600 |
-30.72 |
1,350.74 |
-2.22% |
|
52 Wk Lows |
34 |
|
|
52 Wk Lows |
74 |
|
|
 |
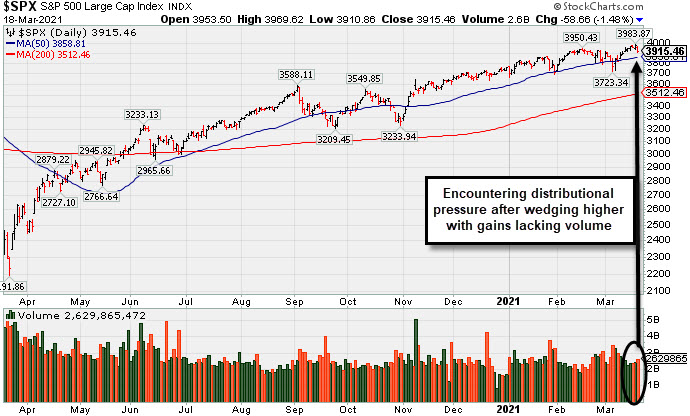
Major Indices' Slump Worsened in Late Afternoon
Kenneth J. Gruneisen - Passed the CAN SLIM® Master's Exam
The Dow reversed earlier gains after touching a fresh intraday record level, ending 153 points lower. The S&P 500 shed 1.5% a day after closing at an all-time high. The tech-heavy Nasdaq Composite slumped 3%. The volume totals were higher than the prior session totals on the NYSE and on the Nasdaq exchange, indicative of institutional selling termed "distribution". Breadth was negative as decliners led advancers by more than a 4-1 margin on the NYSE and more than a 3-1 margin on the Nasdaq exchange. There were 85 high-ranked companies from the Leaders List that hit new 52-week highs and were listed on the BreakOuts Page, versus the total of 43 on the prior session. New 52-week highs totals expanded and easily outnumbered new 52-week lows totals which were also higher on the NYSE and on the Nasdaq exchange. The major indices are in a confirmed uptrend (M criteria) but encountering pressure again. Investors are reminded to always make buying and selling decisions on case-by-case basis under the strict criteria and rules of the fact-based investment system.
PICTURED: The S&P 500 Index has been encountering distributional pressure after wedging to new record highs with gains lacking great volume conviction. It found prompt support near its 50-day moving average (DMA) line during recent consolidations.
Stocks declined on Thursday as investors assessed another spike in Treasury yields, as the yield on the 10-year note jumped eight basis points to 1.72%, near a 14-month high. Meanwhile, the 30-year bond yield briefly surged above 2.50% for the first time since August 2019 in early trading.
The sell-off in Treasuries came despite a dovish message from Fed Chair Jerome Powell on Wednesday, with the bond market increasing expectations that the central bank will permit inflation to overshoot its 2% target as the economy recovers from the pandemic. In FOREX trading, a gauge of the U.S. dollar rebounded, contributing to another drop in oil prices. WTI crude plunged 8.5% to $59.14/barrel, sliding to the lowest level since early February on its fifth consecutive decline.
Ten of 11 S&P 500 sectors ended in negative territory, with Energy and Technology groups leading laggards. Growth-oriented stocks trailed their value counterparts, with the oft-cited FAANG group losing 3%. Financials bucked the downtrend, adding 0.6% amid rising Treasury yields.
Economic data was mixed, with initial jobless claims rising to 770,000 in the week ending March 13, above forecasts of a 700,000 increase and the highest in a month. Separately, the gauge of Philadelphia Fed’s business outlook soared to a 48-year high in March, while the leading index rose 0.2% in February, slowing more than anticipated from January’s 0.5% uptick. |
 Kenneth J. Gruneisen started out as a licensed stockbroker in August 1987, a couple of months prior to the historic stock market crash that took the Dow Jones Industrial Average down -22.6% in a single day. He has published daily fact-based fundamental and technical analysis on high-ranked stocks online for two decades. Through FACTBASEDINVESTING.COM, Kenneth provides educational articles, news, market commentary, and other information regarding proven investment systems that work in good times and bad.
Comments contained in the body of this report are technical opinions only and are not necessarily those of Gruneisen Growth Corp. The material herein has been obtained from sources believed to be reliable and accurate, however, its accuracy and completeness cannot be guaranteed. Our firm, employees, and customers may effect transactions, including transactions contrary to any recommendation herein, or have positions in the securities mentioned herein or options with respect thereto. Any recommendation contained in this report may not be suitable for all investors and it is not to be deemed an offer or solicitation on our part with respect to the purchase or sale of any securities. |
|
 |
Financial Indexes Fared Best While Energy, Tech, and Retail Fell
Kenneth J. Gruneisen - Passed the CAN SLIM® Master's Exam
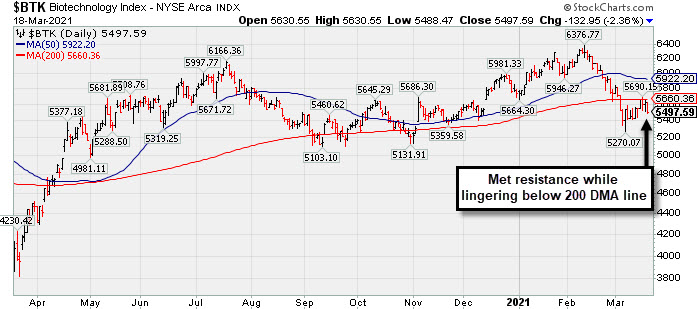
The Oil Services Index ($OSX -5.86%) and Integrated Oil Index ($XOI -5.29%) were standout decliners. The tech sector saw unanimous losses from the Semiconductor Index ($SOX -4.22%), Networking Index ($NWX -2.83%), and Biotech Index ($BTK -2.36%). The Bank Index ($BKX +1.24%) was a standout gainer while the Broker/Dealer Index ($XBD -0.39%) edged lower. Widespread weakness pressured most other areas including the Retail Index ($RLX -2.07%) and the Gold & Silver Index ($XAU -2.04%).
PICTURED: The Biotech Index ($BTK -2.36%) recently met resistance while lingering below its 200-day moving average (DMA) line.
| Oil Services |
$OSX |
56.65 |
-3.52 |
-5.86% |
+27.78% |
| Integrated Oil |
$XOI |
1,010.09 |
-56.45 |
-5.29% |
+27.46% |
| Semiconductor |
$SOX |
2,976.91 |
-131.01 |
-4.22% |
+6.49% |
| Networking |
$NWX |
802.50 |
-23.35 |
-2.83% |
+11.91% |
| Broker/Dealer |
$XBD |
449.02 |
-1.76 |
-0.39% |
+18.91% |
| Retail |
$RLX |
3,528.91 |
-74.74 |
-2.07% |
-0.96% |
| Gold & Silver |
$XAU |
141.25 |
-2.95 |
-2.04% |
-2.04% |
| Bank |
$BKX |
123.32 |
+1.51 |
+1.24% |
+25.95% |
| Biotech |
$BTK |
5,497.59 |
-132.95 |
-2.36% |
-4.21% |
|
|
|
 |
Featured Stocks
Kenneth J. Gruneisen - Passed the CAN SLIM® Master's Exam
|
|
|
Color Codes Explained :
Y - Better candidates highlighted by our
staff of experts.
G - Previously featured
in past reports as yellow but may no longer be buyable under the
guidelines.
***Last / Change / Volume data in this table is the closing quote data***
Symbol/Exchange
Company Name
Industry Group |
PRICE |
CHANGE
(%Change) |
Day High |
Volume
(% DAV)
(% 50 day avg vol) |
52 Wk Hi
% From Hi |
Featured
Date |
Price
Featured |
Pivot Featured |
|
Max Buy |
 FBC
-
NYSE
FBC
-
NYSE
Flagstar Bancorp Inc
BANKING - Savings and Loans
|
$48.75
|
-0.80
-1.61% |
$50.87
|
610,484
92.78% of 50 DAV
50 DAV is 658,000
|
$51.58
-5.49%
|
3/4/2021
|
$47.26
|
PP = $48.02
|
|
MB = $50.42
|
Most Recent Note - 3/15/2021 5:34:06 PM
Y - Color code is changed to yellow after pulling back below its "max buy" level. Its 50 DMA line ($44.80) and recent low define important near-term support to watch on pullbacks.
>>> FEATURED STOCK ARTICLE : Negative Reversal When Poised For Technical Breakout - 3/4/2021 |
View all notes |
Set NEW NOTE alert |
Company Profile |
SEC
News |
Chart |
Request a new note
C
A
S
I |
CRL
-
NYSE
Charles River Labs Intl
DRUGS - Biotechnology
|
$288.28
|
-4.42
-1.51% |
$293.03
|
207,375
65.83% of 50 DAV
50 DAV is 315,000
|
$303.79
-5.11%
|
12/17/2020
|
$247.06
|
PP = $257.98
|
|
MB = $270.88
|
Most Recent Note - 3/16/2021 5:18:08 PM
G - Extended from any sound base, consolidating well above its 50 DMA line ($276) which acted as support throughout its ongoing ascent. Its Relative Strength Rating is 75, below the 80+ minimum guideline for buy candidates. Recently reported Dec '20 quarterly earnings +19% on +14% sales revenues versus the year ago period, below the +25% minimum earnings guideline (C criteria), raising fundamental concerns. See the latest FSU analysis for more details and a new annotated graph.
>>> FEATURED STOCK ARTICLE : Made Gradual Progress, Now Extended From Any Sound Base - 3/16/2021 |
View all notes |
Set NEW NOTE alert |
Company Profile |
SEC
News |
Chart |
Request a new note
C
A
S
I |
OPY
-
NYSE
Oppenheimer Holdings Inc
FINANCIAL SERVICES - Investment Brokerage - Regiona
|
$43.29
|
+1.05
2.49% |
$44.38
|
153,240
121.62% of 50 DAV
50 DAV is 126,000
|
$43.89
-1.37%
|
2/25/2021
|
$38.95
|
PP = $38.11
|
|
MB = $40.02
|
 Most Recent Note - 3/18/2021 5:37:08 PM
G - Hit another new all-time high with today's volume-driven gain. Disciplined investors avoid chasing stocks extended more than +5% above their pivot point.
>>> FEATURED STOCK ARTICLE : Perched at Record High After 6 Consecutive Gains - 3/12/2021 |
View all notes |
Set NEW NOTE alert |
Company Profile |
SEC
News |
Chart |
Request a new note
C
A
S
I |
CLFD
-
NASDAQ
Clearfield Inc
TELECOMMUNICATIONS - Cables / Satalite Equipment
|
$32.01
|
-1.51
-4.50% |
$33.76
|
81,779
47.82% of 50 DAV
50 DAV is 171,000
|
$38.75
-17.39%
|
1/20/2021
|
$31.38
|
PP = $28.42
|
|
MB = $29.84
|
Most Recent Note - 3/18/2021 5:31:04 PM
G - Pulled back today on lighter volume but closed below its 50 DMA line ($32.29) raising concerns. It has not formed a sound base of sufficient length. Prior highs in the $28 area previously acted as support. Fundamentals remain strong.
>>> FEATURED STOCK ARTICLE : Quiet Gain Repaired 50-Day Moving Average Violation - 3/9/2021 |
View all notes |
Set NEW NOTE alert |
Company Profile |
SEC
News |
Chart |
Request a new note
C
A
S
I |
EDUC
-
NASDAQ
Educational Development
WHOLESALE - Basic Materials Wholesale
|
$17.73
|
-0.18
-1.01% |
$18.90
|
23,246
61.17% of 50 DAV
50 DAV is 38,000
|
$20.00
-11.35%
|
3/10/2021
|
$17.89
|
PP = $20.10
|
|
MB = $21.11
|
Most Recent Note - 3/17/2021 5:39:29 PM
Y - Rebounded toward its 52-week high with today's big gain backed by below average volume. Subsequent gains above the pivot point backed by at least +40% above average volume are needed to trigger a proper technical buy signal. Found support at its 200 DMA line since noted with caution in the 10/22/20 mid-day report. Reported earnings +55% on +63% sales revenues for the Nov '20 quarter versus the year-ago period, its 3rd strong quarterly comparison above the +25% minimum guideline (C criteria), helping it better match with the fact-based investment system's fundamental guidelines. This thinly traded Media - Books firm's annual earnings (A criteria) history has strong.
>>> FEATURED STOCK ARTICLE : Gain Leaves Media - Books Firm Perched Near Pivot Point - 3/10/2021 |
View all notes |
Set NEW NOTE alert |
Company Profile |
SEC
News |
Chart |
Request a new note
C
A
S
I |
Symbol/Exchange
Company Name
Industry Group |
PRICE |
CHANGE
(%Change) |
Day High |
Volume
(% DAV)
(% 50 day avg vol) |
52 Wk Hi
% From Hi |
Featured
Date |
Price
Featured |
Pivot Featured |
|
Max Buy |
SMPL
-
NASDAQ
Simply Good Foods Co
Food-Confectionery
|
$32.90
|
-1.81
-5.21% |
$34.38
|
813,598
119.30% of 50 DAV
50 DAV is 682,000
|
$35.25
-6.67%
|
12/28/2020
|
$30.40
|
PP = $31.44
|
|
MB = $33.01
|
Most Recent Note - 3/18/2021 5:40:26 PM
Y - Pulled back for a big loss today with higher volume after posting 3 consecutive gains on lighter volume. Prior highs in the $32 area define initial support to watch above its 50 DMA line ($29.68). Its Relative Strength Rating is 77, below the 80+ minimum guideline for buy candidates.
>>> FEATURED STOCK ARTICLE : Found Support at 50-Day Moving Average; Relative Strength Improved - 3/5/2021 |
View all notes |
Set NEW NOTE alert |
Company Profile |
SEC
News |
Chart |
Request a new note
C
A
S
I |
XPEL
-
NASDAQ
Xpel Inc
Auto/Truck-Tires andamp; Misc
|
$55.95
|
-5.83
-9.44% |
$61.72
|
273,423
89.94% of 50 DAV
50 DAV is 304,000
|
$65.74
-14.89%
|
3/11/2021
|
$59.70
|
PP = $60.87
|
|
MB = $63.91
|
Most Recent Note - 3/18/2021 5:29:30 PM
Y - Today's 4th loss in the span of 5 sessions completely negated the recent breakout as it rolled back into the prior base raising concerns. The next important support to watch is its 50 DMA line ($54.08).
>>> FEATURED STOCK ARTICLE : Powerful Breakout Backed by Heavy Volume - 3/11/2021 |
View all notes |
Set NEW NOTE alert |
Company Profile |
SEC
News |
Chart |
Request a new note
C
A
S
I |
DT
-
NYSE
Dynatrace Inc
Computer Sftwr-Enterprse
|
$50.09
|
-4.16
-7.67% |
$53.26
|
2,275,580
86.85% of 50 DAV
50 DAV is 2,620,000
|
$56.94
-12.03%
|
2/4/2021
|
$51.39
|
PP = $48.95
|
|
MB = $51.40
|
Most Recent Note - 3/18/2021 5:35:50 PM
Y - Pulled back below its "max buy" level today with higher (near average) volume and its color code is changed to yellow. Its 50 DMA line ($48.74) coincides with prior highs in the $48 area defining import near-term support. More damaging losses would raise serious concerns. Its Relative Strength Rating has slumped to 67, well below the 80+ minimum guideline for buy candidates. Fundamentals remain strong after it reported Dec '20 earnings +70% on +28% sales revenues versus the year ago period.
>>> FEATURED STOCK ARTICLE : Consolidating Above Prior Highs and 50-Day Moving Average - 3/3/2021 |
View all notes |
Set NEW NOTE alert |
Company Profile |
SEC
News |
Chart |
Request a new note
C
A
S
I |
MRBK
-
NASDAQ
Meridian Corp
Banks-Northeast
|
$26.58
|
+0.65
2.51% |
$26.59
|
55,023
175.79% of 50 DAV
50 DAV is 31,300
|
$27.96
-4.94%
|
2/22/2021
|
$25.58
|
PP = $26.10
|
|
MB = $27.41
|
Most Recent Note - 3/18/2021 12:42:24 PM
Y - Pulling back for a 6th consecutive small loss today after a noted "negative reversal" at its 52-week high. Prior high defines initial support to watch above its 50 DMA line ($23.19) on pullbacks.
>>> FEATURED STOCK ARTICLE : Prior High Defines Initial Support to Watch - 3/15/2021 |
View all notes |
Set NEW NOTE alert |
Company Profile |
SEC
News |
Chart |
Request a new note
C
A
S
I |
|
|
|
THESE ARE NOT BUY RECOMMENDATIONS!
Comments contained in the body of this report are technical
opinions only. The material herein has been obtained
from sources believed to be reliable and accurate, however,
its accuracy and completeness cannot be guaranteed.
This site is not an investment advisor, hence it does
not endorse or recommend any securities or other investments.
Any recommendation contained in this report may not
be suitable for all investors and it is not to be deemed
an offer or solicitation on our part with respect to
the purchase or sale of any securities. All trademarks,
service marks and trade names appearing in this report
are the property of their respective owners, and are
likewise used for identification purposes only.
This report is a service available
only to active Paid Premium Members.
You may opt-out of receiving report notifications
at any time. Questions or comments may be submitted
by writing to Premium Membership Services 665 S.E. 10 Street, Suite 201 Deerfield Beach, FL 33441-5634 or by calling 1-800-965-8307
or 954-785-1121.
|
|
|