You are not logged in.
This means you
CAN ONLY VIEW reports that were published prior to Thursday, March 20, 2025.
You
MUST UPGRADE YOUR MEMBERSHIP if you want to see any current reports.
AFTER MARKET UPDATE - WEDNESDAY, MARCH 3RD, 2021
Previous After Market Report Next After Market Report >>>
|
|
|
|
DOW |
-121.43 |
31,270.09 |
-0.39% |
|
Volume |
1,198,209,483 |
-0% |
|
Volume |
5,458,787,300 |
+12% |
|
NASDAQ |
-362.74 |
12,996.05 |
-2.72% |
|
Advancers |
1,528 |
48% |
|
Advancers |
1,336 |
35% |
|
S&P 500 |
-50.57 |
3,819.72 |
-1.31% |
|
Decliners |
1,683 |
52% |
|
Decliners |
2,467 |
65% |
|
Russell 2000 |
-23.72 |
2,207.79 |
-1.06% |
|
52 Wk Highs |
276 |
|
|
52 Wk Highs |
322 |
|
|
S&P 600 |
+2.79 |
1,297.47 |
+0.22% |
|
52 Wk Lows |
70 |
|
|
52 Wk Lows |
168 |
|
|
 |
Tech Heavy Nasdaq Composite Leads Major Indices' Retreat
Kenneth J. Gruneisen - Passed the CAN SLIM® Master's Exam
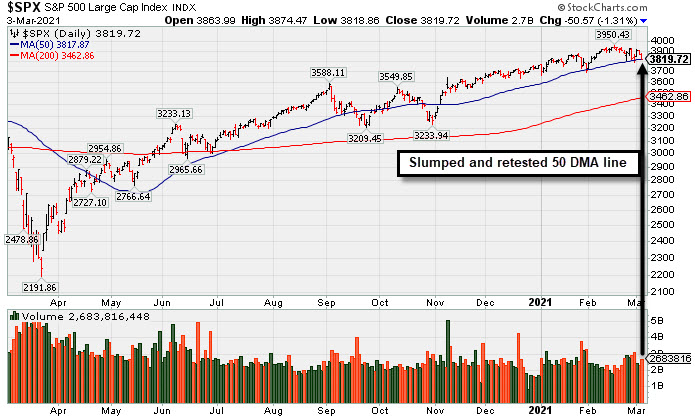
The Dow lost 121 points, while the S&P 500 dipped 1.3%. The Nasdaq Composite shed 2.7% as tech and other high growth-oriented shares resumed their sell-off, with the benchmark capping its worst two-day performance since September. The volume was near the prior session total on the NYSE while volume was higher on the Nasdaq exchange. Decliners led advancers by about a narrow margin on the NYSE but decliners nearly outnumbered advancers by 2-1 on the Nasdaq exchange. There were 84 high-ranked companies from the Leaders List that hit new 52-week highs and were listed on the BreakOuts Page, versus the total of 49 on the prior session. New 52-week highs totals expanded and solidly outnumbered growing new 52-week lows totals on both exchanges. The major indices' uptrend (M criteria) has recently come under pressure. It remains very important for healthy leadership to continue, for any rally can only be sustained if it is supported by many stocks hitting new highs. Investors are reminded to always make buying and selling decisions based based on the strict criteria and rules of the fact-based investment system. PICTURED: The S&P 500 Index slumped and retested its 50-day moving average (DMA) line. That short-term average and recent lows define important near-term support to watch.
U.S. stocks finished lower on Wednesday, with investors once again monitoring rising Treasury yields and reassessing equity valuations. Treasuries declined, with the yield on the 10-year note up six basis points to 1.46%. Positive updates on fiscal stimulus and the COVID-19 vaccine rollout failed to lift the overall mood. Details of the latest coronavirus relief bill continued to be negotiated by lawmakers in the Senate, while President Biden stated that the nation should have enough COVID-19 vaccines for every American adult by the end of May.
Also pressuring risk sentiment were largely disappointing economic updates. A report from ADP showed private payrolls rose by 117,000 in February, missing estimates of a 200,000 increase. Separately, the Institute for Supply Management’s (ISM) gauge of U.S. services sector activity remained in expansionary territory, but unexpectedly fell to its lowest level in nine months in February.
Eight of 11 S&P 500 sectors closed in negative territory, with the Technology and Consumer Discretionary groups slumping 2.5% and 2.4%, respectively. Energy shares bucked the downtrend amid an increase in oil prices. WTI crude advanced 2.5% to $61.25/barrel after a report suggested OPEC and its allies may extend output curbs into April. In corporate news, Lyft (LYFT +8.24%) rose after the ride-hailing company reported its strongest week of ridesharing volume since the pandemic-related lockdowns began last year. |
 Kenneth J. Gruneisen started out as a licensed stockbroker in August 1987, a couple of months prior to the historic stock market crash that took the Dow Jones Industrial Average down -22.6% in a single day. He has published daily fact-based fundamental and technical analysis on high-ranked stocks online for two decades. Through FACTBASEDINVESTING.COM, Kenneth provides educational articles, news, market commentary, and other information regarding proven investment systems that work in good times and bad.
Comments contained in the body of this report are technical opinions only and are not necessarily those of Gruneisen Growth Corp. The material herein has been obtained from sources believed to be reliable and accurate, however, its accuracy and completeness cannot be guaranteed. Our firm, employees, and customers may effect transactions, including transactions contrary to any recommendation herein, or have positions in the securities mentioned herein or options with respect thereto. Any recommendation contained in this report may not be suitable for all investors and it is not to be deemed an offer or solicitation on our part with respect to the purchase or sale of any securities. |
|
 |
Bank and Energy Groups Rose; Tech, Retail, Gold & Silver Indexes Fell
Kenneth J. Gruneisen - Passed the CAN SLIM® Master's Exam
The Bank Index ($BKX +1.01%) posted a gain while the Broker/Dealer Index ($XBD -0.40%) edged lower and the Retail Index ($RLX -2.35%) and tech weakness created a drag on the major indices. The Biotech Index ($BTK -3.40%) and Semiconductor Index ($SOX -3.12%) led the tech retreat while the Networking Index ($NWX -1.68%) suffered a smaller loss. Commodity-linked groups were mixed as the Integrated Oil Index ($XOI +2.16%) outpaced the Oil Services Index ($OSX +0.43%) to the upside, meanwhile, the Gold & Silver Index ($XAU -2.26%) lost ground.PICTURED: The Bank Index ($BKX +1.01%) 4-year graph shows that it has recently been consolidating after reaching a record high.
| Oil Services |
$OSX |
57.09 |
+0.24 |
+0.43% |
+28.78% |
| Integrated Oil |
$XOI |
1,016.92 |
+21.46 |
+2.16% |
+28.32% |
| Semiconductor |
$SOX |
2,975.06 |
-95.87 |
-3.12% |
+6.42% |
| Networking |
$NWX |
767.97 |
-13.08 |
-1.68% |
+7.09% |
| Broker/Dealer |
$XBD |
436.36 |
-1.74 |
-0.40% |
+15.56% |
| Retail |
$RLX |
3,405.23 |
-81.92 |
-2.35% |
-4.43% |
| Gold & Silver |
$XAU |
131.80 |
-3.05 |
-2.26% |
-8.60% |
| Bank |
$BKX |
117.63 |
+1.18 |
+1.01% |
+20.14% |
| Biotech |
$BTK |
5,525.55 |
-194.21 |
-3.40% |
-3.72% |
|
|
|
 |
Consolidating Above Prior Highs and 50-Day Moving Average
Kenneth J. Gruneisen - Passed the CAN SLIM® Master's Exam
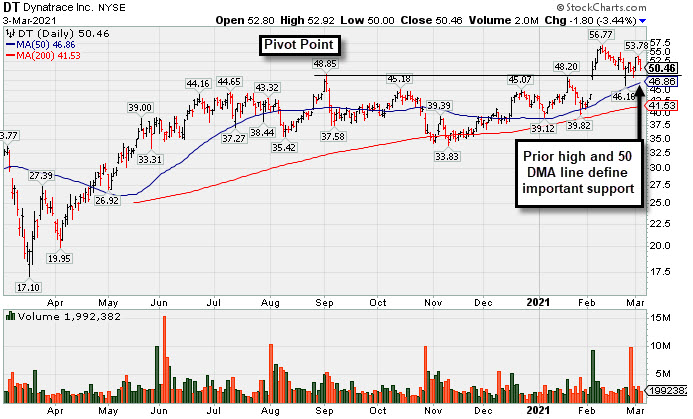
Dynatrace Inc (DT -$1.80 to -3.44% to $50.46) pulled back with below average volume today. Its Relative Strength Rating of 70 remains below the 80+ minimum guideline for buy candidates. Prior highs in the $48 area define initial support to watch above its 50-day moving average(DMA) line ($46.48).
DT was highlighted in yellow with pivot point cited based on its 9/02/20 high in the 2/04/21 mid-day report (read here). It found support near its 200-day moving average (DMA) line during the consolidation after dropped from the Featured Stocks list on 9/08/20. Fundamentals remained strong. It reported Dec '20 earnings +70% on +28% sales revenues versus the year ago period, its 6th consecutive strong quarterly comparison versus the year ago periods. It has a 98 Earnings Per Share Rating.
The high-ranked Computer Sftwr-Enterprse firm was last shown in this FSU section on 2/04/21 with an annotated graph under the headline, "Breakout Action Returns Dynatrace to Featured Stocks List". It completed its $16.00 IPO on 8/01/19 and Secondary Offerings on 12/06/19, 2/21/20, and 6/03/20.
The number of top-rated funds owning its shares rose from 226 in Sep '19 to 736 in Dec '20, a reassuring sign concerning the I criteria. Its current Up/Down Volume ratio of 1.0 is an unbiased indication its shares have been neutral concerning accumulation/distribution over the past 50 days. It has a B Timeliness rating and a B Sponsorship rating.
|
|
|
Color Codes Explained :
Y - Better candidates highlighted by our
staff of experts.
G - Previously featured
in past reports as yellow but may no longer be buyable under the
guidelines.
***Last / Change / Volume data in this table is the closing quote data***
Symbol/Exchange
Company Name
Industry Group |
PRICE |
CHANGE
(%Change) |
Day High |
Volume
(% DAV)
(% 50 day avg vol) |
52 Wk Hi
% From Hi |
Featured
Date |
Price
Featured |
Pivot Featured |
|
Max Buy |
 CRL
-
NYSE
CRL
-
NYSE
Charles River Labs Intl
DRUGS - Biotechnology
|
$278.27
|
-9.19
-3.20% |
$286.14
|
280,383
86.27% of 50 DAV
50 DAV is 325,000
|
$303.79
-8.40%
|
12/17/2020
|
$247.06
|
PP = $257.98
|
|
MB = $270.88
|
Most Recent Note - 3/1/2021 5:21:23 PM
G - Posted a gain today with below average volume. Sputtering since it reported Dec '20 quarterly earnings +19% on +14% sales revenues versus the year ago period, below the +25% minimum earnings guideline (C criteria). See the latest FSU analysis for more details and a new annotated graph.
>>> FEATURED STOCK ARTICLE : CRL Still Hovering Near Record High - 3/1/2021 |
View all notes |
Set NEW NOTE alert |
Company Profile |
SEC
News |
Chart |
Request a new note
C
A
S
I |
OPY
-
NYSE
Oppenheimer Holdings Inc
FINANCIAL SERVICES - Investment Brokerage - Regiona
|
$39.52
|
+0.08
0.20% |
$40.80
|
113,994
91.93% of 50 DAV
50 DAV is 124,000
|
$40.84
-3.23%
|
2/25/2021
|
$38.95
|
PP = $38.11
|
|
MB = $40.02
|
Most Recent Note - 3/2/2021 12:48:55 PM
G - Hit another new all-time high today following a noted spurt of volume-driven gains since featured in the 2/25/21 mid-day report. Disciplined investors avoid chasing stocks extended more than +5% above their pivot point.
>>> FEATURED STOCK ARTICLE : Rose From "3-weeks Tight" Base But Ended Near Session Low - 2/25/2021 |
View all notes |
Set NEW NOTE alert |
Company Profile |
SEC
News |
Chart |
Request a new note
C
A
S
I |
CLFD
-
NASDAQ
Clearfield Inc
TELECOMMUNICATIONS - Cables / Satalite Equipment
|
$33.28
|
-0.91
-2.66% |
$34.76
|
168,073
105.71% of 50 DAV
50 DAV is 159,000
|
$38.75
-14.12%
|
1/20/2021
|
$31.38
|
PP = $28.42
|
|
MB = $29.84
|
Most Recent Note - 3/1/2021 5:27:08 PM
G - Posted a solid gain today. It is very extended from any sound base. Its 50 DMA line ($30.32) defines important near-term support to watch above its prior highs in the $28 area. Fundamentals remain strong.
>>> FEATURED STOCK ARTICLE : Consolidating Well Above 50-Day Moving Average Line - 2/24/2021 |
View all notes |
Set NEW NOTE alert |
Company Profile |
SEC
News |
Chart |
Request a new note
C
A
S
I |
SMPL
-
NASDAQ
Simply Good Foods Co
Food-Confectionery
|
$28.91
|
-0.06
-0.21% |
$29.23
|
507,627
44.61% of 50 DAV
50 DAV is 1,138,000
|
$32.03
-9.74%
|
12/28/2020
|
$30.40
|
PP = $31.44
|
|
MB = $33.01
|
Most Recent Note - 3/2/2021 5:23:48 PM
Y - Posted a big loss today with below average (but higher) volume, retesting its 50 DMA line ($28.91) which recently acted as support. Its Relative Strength Rating is 75, still below the 80+ minimum guideline. Its prior low ($26.78) defines the next important near term support to watch.
>>> FEATURED STOCK ARTICLE : Pulling Back Quietly After Rebounding Near All-Time High - 2/17/2021 |
View all notes |
Set NEW NOTE alert |
Company Profile |
SEC
News |
Chart |
Request a new note
C
A
S
I |
TEAM
-
NASDAQ
Atlassian Corp Plc
Comp Sftwr-Spec Enterprs
|
$227.68
|
-16.72
-6.84% |
$245.43
|
2,122,826
152.43% of 50 DAV
50 DAV is 1,392,700
|
$262.40
-13.23%
|
10/12/2020
|
$193.77
|
PP = $199.60
|
|
MB = $209.58
|
 Most Recent Note - 3/3/2021 4:57:24 PM
Violated its 50 DMA line ($238) decisively with today's big loss backed by above average volume triggering a technical sell signal. The recent low ($208.62 on 1/27/21) defines the next important near-term support to watch. Relative Strength Rating has slumped to 53, below the +80 minimum guideline for buy candidates. Fundamental concerns were noted as the 2 latest quarterly comparisons were below the +25% minimum earnings guideline (C criteria). It will be dropped from the Featured Stocks list tonight.
>>> FEATURED STOCK ARTICLE : Quietly Touched a New High Despite Fundamental Concerns Noted - 2/8/2021 |
View all notes |
Set NEW NOTE alert |
Company Profile |
SEC
News |
Chart |
Request a new note
C
A
S
I |
Symbol/Exchange
Company Name
Industry Group |
PRICE |
CHANGE
(%Change) |
Day High |
Volume
(% DAV)
(% 50 day avg vol) |
52 Wk Hi
% From Hi |
Featured
Date |
Price
Featured |
Pivot Featured |
|
Max Buy |
SHOP
-
NYSE
Shopify Inc Cl A
Computer Sftwr-Enterprse
|
$1,220.30
|
-88.76
-6.78% |
$1,299.99
|
1,146,532
83.20% of 50 DAV
50 DAV is 1,378,000
|
$1,499.75
-18.63%
|
2/2/2021
|
$1,218.72
|
PP = $1,285.28
|
|
MB = $1,349.54
|
Most Recent Note - 3/3/2021 5:32:51 PM
G - Slumped below prior highs and today's damaging loss on light volume also violated its 50 DMA line ($1,241), raising concerns and triggering a technical sell signal. Only a prompt rebound above the 50 DMA line would help its outlook improve. Reported Dec '20 quarterly earnings +267% on +94% sales revenues versus the year ago period.
>>> FEATURED STOCK ARTICLE : Found Support Near Prior High and 50-Day Moving Average - 3/2/2021 |
View all notes |
Set NEW NOTE alert |
Company Profile |
SEC
News |
Chart |
Request a new note
C
A
S
I |
YETI
-
NYSE
Yeti Holdings Inc
Leisure-Products
|
$69.34
|
-0.42
-0.60% |
$71.48
|
907,338
61.31% of 50 DAV
50 DAV is 1,480,000
|
$80.89
-14.28%
|
2/19/2021
|
$74.99
|
PP = $80.99
|
|
MB = $85.04
|
Most Recent Note - 3/1/2021 5:35:37 PM
G - Rebounded near its 50 DMA line ($71.53) with today's big gain backed by below average volume. That short-term average may act as resistance. Prior low ($64.80) on 2/01/21) defines important near term support where a violation may trigger a more worrisome technical sell signal. Fundamentals remain strong.
>>> FEATURED STOCK ARTICLE : Rebounded Just Above 50-Day Moving Average Line - 2/18/2021 |
View all notes |
Set NEW NOTE alert |
Company Profile |
SEC
News |
Chart |
Request a new note
C
A
S
I |
DOCU
-
NASDAQ
Docusign Inc
Computer Sftwr-Enterprse
|
$219.64
|
-12.95
-5.57% |
$232.59
|
3,658,900
117.78% of 50 DAV
50 DAV is 3,106,600
|
$290.23
-24.32%
|
1/12/2021
|
$253.50
|
PP = $256.10
|
|
MB = $268.91
|
Most Recent Note - 3/3/2021 5:02:30 PM
Slumping badly again today, it met resistance at its 50 DMA line ($242) after damaging losses triggered a technical sell signal. Relative Strength Rating has slumped to 73, below the 80+ minimum guideline for buy candidates. Fundamentals remain strong. It will be dropped from the Featured Stocks list tonight.
>>> FEATURED STOCK ARTICLE : Consolidating Back Above 50-Day Moving Average Near Prior High - 2/9/2021 |
View all notes |
Set NEW NOTE alert |
Company Profile |
SEC
News |
Chart |
Request a new note
C
A
S
I |
DT
-
NYSE
Dynatrace Inc
Computer Sftwr-Enterprse
|
$50.46
|
-1.80
-3.44% |
$52.92
|
1,961,634
77.69% of 50 DAV
50 DAV is 2,524,800
|
$56.77
-11.12%
|
2/4/2021
|
$51.39
|
PP = $48.95
|
|
MB = $51.40
|
Most Recent Note - 3/3/2021 5:04:01 PM
G - Pulled back with below average volume today. Its Relative Strength Rating of 70 remains below the 80+ minimum guideline for buy candidates. Prior highs in the $48 area define initial support to watch above its 50 DMA line ($46.48). Fundamentals remain strong after it reported Dec '20 earnings +70% on +28% sales revenues versus the year ago period.
>>> FEATURED STOCK ARTICLE : Consolidating Above Prior Highs and 50-Day Moving Average - 3/3/2021 |
View all notes |
Set NEW NOTE alert |
Company Profile |
SEC
News |
Chart |
Request a new note
C
A
S
I |
MRBK
-
NASDAQ
Meridian Corp
Banks-Northeast
|
$25.66
|
+1.18
4.82% |
$25.95
|
44,268
152.65% of 50 DAV
50 DAV is 29,000
|
$26.94
-4.75%
|
2/22/2021
|
$25.58
|
PP = $26.10
|
|
MB = $27.41
|
Most Recent Note - 3/3/2021 5:05:03 PM
Y - Posted a solid gain today with above average volume. Pivot point cited was based on its 12/18/21 high plus 10 cents. Subsequent gains and a strong close above its pivot point backed by at least +40% above average volume may help clinch a convincing technical buy signal. Fundamentals are strong.
>>> FEATURED STOCK ARTICLE : Negative Reversal When Poised to Convincingly Breakout - 2/22/2021 |
View all notes |
Set NEW NOTE alert |
Company Profile |
SEC
News |
Chart |
Request a new note
C
A
S
I |
Symbol/Exchange
Company Name
Industry Group |
PRICE |
CHANGE
(%Change) |
Day High |
Volume
(% DAV)
(% 50 day avg vol) |
52 Wk Hi
% From Hi |
Featured
Date |
Price
Featured |
Pivot Featured |
|
Max Buy |
AXON
-
NASDAQ
Axon Enterprise Inc
Security/Sfty
|
$155.01
|
-11.14
-6.70% |
$167.79
|
633,704
88.75% of 50 DAV
50 DAV is 714,000
|
$212.37
-27.01%
|
12/22/2020
|
$127.84
|
PP = $130.51
|
|
MB = $137.04
|
Most Recent Note - 3/3/2021 4:59:02 PM
G - Suffered a big loss today on below average volume testing its 50 DMA line ($155). It has not formed a sound base. Reported strong Dec '20 quarterly results.
>>> FEATURED STOCK ARTICLE : Slumping Toward 50-Day Average Following Great Rally - 2/26/2021 |
View all notes |
Set NEW NOTE alert |
Company Profile |
SEC
News |
Chart |
Request a new note
C
A
S
I |
|
|
|
THESE ARE NOT BUY RECOMMENDATIONS!
Comments contained in the body of this report are technical
opinions only. The material herein has been obtained
from sources believed to be reliable and accurate, however,
its accuracy and completeness cannot be guaranteed.
This site is not an investment advisor, hence it does
not endorse or recommend any securities or other investments.
Any recommendation contained in this report may not
be suitable for all investors and it is not to be deemed
an offer or solicitation on our part with respect to
the purchase or sale of any securities. All trademarks,
service marks and trade names appearing in this report
are the property of their respective owners, and are
likewise used for identification purposes only.
This report is a service available
only to active Paid Premium Members.
You may opt-out of receiving report notifications
at any time. Questions or comments may be submitted
by writing to Premium Membership Services 665 S.E. 10 Street, Suite 201 Deerfield Beach, FL 33441-5634 or by calling 1-800-965-8307
or 954-785-1121.
|
|
|