You are not logged in.
This means you
CAN ONLY VIEW reports that were published prior to Thursday, March 20, 2025.
You
MUST UPGRADE YOUR MEMBERSHIP if you want to see any current reports.
AFTER MARKET UPDATE - WEDNESDAY, MARCH 17TH, 2021
Previous After Market Report Next After Market Report >>>
|
|
|
|
DOW |
+189.42 |
33,015.37 |
+0.58% |
|
Volume |
1,046,462,162 |
+6% |
|
Volume |
5,437,334,100 |
+0% |
|
NASDAQ |
+53.64 |
13,525.20 |
+0.40% |
|
Advancers |
1,780 |
56% |
|
Advancers |
2,374 |
59% |
|
S&P 500 |
+11.41 |
3,974.12 |
+0.29% |
|
Decliners |
1,378 |
44% |
|
Decliners |
1,652 |
41% |
|
Russell 2000 |
+16.87 |
2,336.39 |
+0.73% |
|
52 Wk Highs |
226 |
|
|
52 Wk Highs |
181 |
|
|
S&P 600 |
+7.90 |
1,381.46 |
+0.58% |
|
52 Wk Lows |
26 |
|
|
52 Wk Lows |
61 |
|
|
 |
Major Indices Rose But With Less Leadership
Kenneth J. Gruneisen - Passed the CAN SLIM® Master's Exam
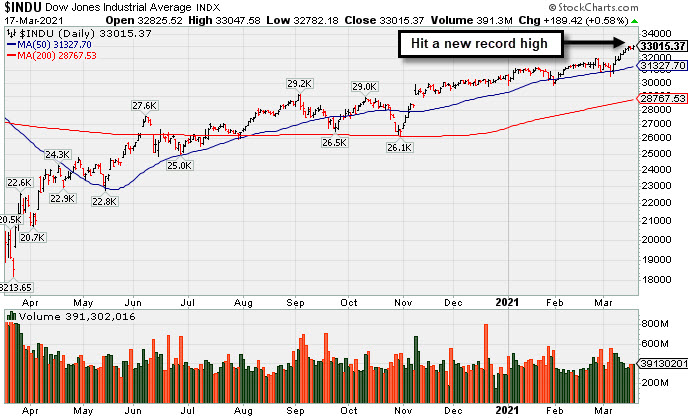
The Dow jumped 189 points, closing above the 33,000 level for the first time. The S&P 500 wiped out an early session loss to add 0.3%, also ending at a fresh record level. The Nasdaq Composite turned higher, closing the day up 0.4%. The volume totals were higher than the prior session totals on the NYSE and on the Nasdaq exchange. Breadth was positive as advancers led decliners by a 9-7 margin on the NYSE and by about a 3-2 margin on the Nasdaq exchange. There were 43 high-ranked companies from the Leaders List that hit new 52-week highs and were listed on the BreakOuts Page, versus the total of 52 on the prior session. New 52-week highs totals easily outnumbered new 52-week lows totals on the NYSE and on the Nasdaq exchange. The major indices are in a confirmed uptrend (M criteria). Investors are reminded to always make buying and selling decisions on case-by-case basis under the strict criteria and rules of the fact-based investment system.
PICTURED: The Dow Jones Industrial Average hit a new record high. It found prompt support near its 50-day moving average (DMA) line during recent consolidations.
Stocks finished higher on Wednesday as the conclusion of the Federal Reserve’s policy meeting boosted risk sentiment. Treasuries pared a decline, with the yield on the 10-year note finishing up two basis points to 1.64% after having climbed to a new 13-month high of 1.68% in early trading.
As widely anticipated, the central bank left its benchmark interest rate unchanged in the near zero-bound range, while the closely watched “dot plot” indicated committee members expected to leave rates on hold through 2023. Fed Chair Jerome Powell reiterated that an accommodative monetary policy remains appropriate until data clearly shows the central bank has met its dual mandates of maximum employment and inflation running moderately above 2%. Following the decision, the dollar weakened, buoying oil prices in afternoon trading. WTI crude pared an earlier decline to finish 0.4% lower at $64.57/barrel, still its fourth consecutive drop.
In earnings, homebuilder Lennar (LEN +13.80%) spiked to a new all-time high after topping analyst profit and revenue estimates. In other corporate news, Plug Power (PLUG -7.90%) fell as the fuel-cell company revealed accounting errors in past financial reports. McDonald’s (MCD +1.93%) rose following an analyst upgrade.
On the data front, housing starts fell to a six-month low in February, while building permits slumped 10.8%, a stark contrast to January's 10.7% advance. |
 Kenneth J. Gruneisen started out as a licensed stockbroker in August 1987, a couple of months prior to the historic stock market crash that took the Dow Jones Industrial Average down -22.6% in a single day. He has published daily fact-based fundamental and technical analysis on high-ranked stocks online for two decades. Through FACTBASEDINVESTING.COM, Kenneth provides educational articles, news, market commentary, and other information regarding proven investment systems that work in good times and bad.
Comments contained in the body of this report are technical opinions only and are not necessarily those of Gruneisen Growth Corp. The material herein has been obtained from sources believed to be reliable and accurate, however, its accuracy and completeness cannot be guaranteed. Our firm, employees, and customers may effect transactions, including transactions contrary to any recommendation herein, or have positions in the securities mentioned herein or options with respect thereto. Any recommendation contained in this report may not be suitable for all investors and it is not to be deemed an offer or solicitation on our part with respect to the purchase or sale of any securities. |
|
 |
Tech, Retail, Financial, and Commodity-Linked Groups Rose
Kenneth J. Gruneisen - Passed the CAN SLIM® Master's Exam
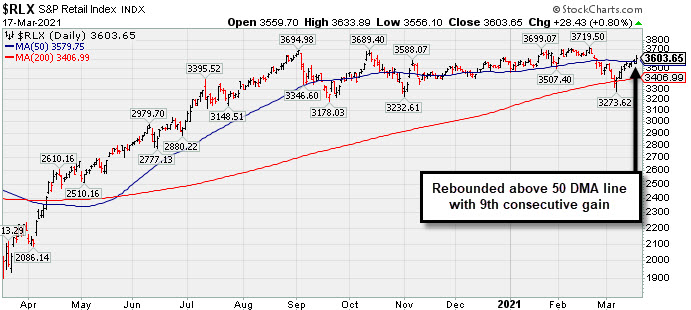
The Broker/Dealer Index ($XBD +1.04%), Bank Index ($BKX +0.90%), and Retail Index ($RLX +0.80%) posted unanimous gains. The Semiconductor Index ($SOX +1.22%) led the tech sector while the Biotech Index ($BTK +0.61%) and Networking Index ($NWX +0.60%) both posted smaller gains. The Oil Services Index ($OSX +0.75%) and Integrated Oil Index ($XOI +0.91%) both edged higher, meanwhile the Gold & Silver Index ($XAU +2.69%) posted a standout gain.
PICTURED: The Retail Index ($RLX +0.80%) rebounded above its 50-day moving average (DMA) line toward its all-time high with a 9th consecutive gain. The recent resilience shown by the Retail Index is a reassuring sign, since consumer spending accounts for nearly 2/3 of the US economy.
| Oil Services |
$OSX |
60.17 |
+0.45 |
+0.75% |
+35.73% |
| Integrated Oil |
$XOI |
1,066.53 |
+9.59 |
+0.91% |
+34.58% |
| Semiconductor |
$SOX |
3,107.92 |
+37.60 |
+1.22% |
+11.18% |
| Networking |
$NWX |
825.85 |
+4.91 |
+0.60% |
+15.16% |
| Broker/Dealer |
$XBD |
450.78 |
+4.64 |
+1.04% |
+19.38% |
| Retail |
$RLX |
3,603.65 |
+28.43 |
+0.80% |
+1.13% |
| Gold & Silver |
$XAU |
144.20 |
+3.78 |
+2.69% |
+0.01% |
| Bank |
$BKX |
121.81 |
+1.09 |
+0.90% |
+24.41% |
| Biotech |
$BTK |
5,630.55 |
+33.99 |
+0.61% |
-1.89% |
|
|
|
 |
Featured Stocks
Kenneth J. Gruneisen - Passed the CAN SLIM® Master's Exam
|
|
|
Color Codes Explained :
Y - Better candidates highlighted by our
staff of experts.
G - Previously featured
in past reports as yellow but may no longer be buyable under the
guidelines.
***Last / Change / Volume data in this table is the closing quote data***
Symbol/Exchange
Company Name
Industry Group |
PRICE |
CHANGE
(%Change) |
Day High |
Volume
(% DAV)
(% 50 day avg vol) |
52 Wk Hi
% From Hi |
Featured
Date |
Price
Featured |
Pivot Featured |
|
Max Buy |
 FBC
-
NYSE
FBC
-
NYSE
Flagstar Bancorp Inc
BANKING - Savings and Loans
|
$49.55
|
+0.64
1.31% |
$49.64
|
422,466
63.91% of 50 DAV
50 DAV is 661,000
|
$51.58
-3.94%
|
3/4/2021
|
$47.26
|
PP = $48.02
|
|
MB = $50.42
|
Most Recent Note - 3/15/2021 5:34:06 PM
Y - Color code is changed to yellow after pulling back below its "max buy" level. Its 50 DMA line ($44.80) and recent low define important near-term support to watch on pullbacks.
>>> FEATURED STOCK ARTICLE : Negative Reversal When Poised For Technical Breakout - 3/4/2021 |
View all notes |
Set NEW NOTE alert |
Company Profile |
SEC
News |
Chart |
Request a new note
C
A
S
I |
CRL
-
NYSE
Charles River Labs Intl
DRUGS - Biotechnology
|
$292.70
|
+4.17
1.45% |
$294.06
|
221,930
69.79% of 50 DAV
50 DAV is 318,000
|
$303.79
-3.65%
|
12/17/2020
|
$247.06
|
PP = $257.98
|
|
MB = $270.88
|
Most Recent Note - 3/16/2021 5:18:08 PM
G - Extended from any sound base, consolidating well above its 50 DMA line ($276) which acted as support throughout its ongoing ascent. Its Relative Strength Rating is 75, below the 80+ minimum guideline for buy candidates. Recently reported Dec '20 quarterly earnings +19% on +14% sales revenues versus the year ago period, below the +25% minimum earnings guideline (C criteria), raising fundamental concerns. See the latest FSU analysis for more details and a new annotated graph.
>>> FEATURED STOCK ARTICLE : Made Gradual Progress, Now Extended From Any Sound Base - 3/16/2021 |
View all notes |
Set NEW NOTE alert |
Company Profile |
SEC
News |
Chart |
Request a new note
C
A
S
I |
OPY
-
NYSE
Oppenheimer Holdings Inc
FINANCIAL SERVICES - Investment Brokerage - Regiona
|
$42.24
|
-0.26
-0.61% |
$42.75
|
117,555
93.30% of 50 DAV
50 DAV is 126,000
|
$43.89
-3.76%
|
2/25/2021
|
$38.95
|
PP = $38.11
|
|
MB = $40.02
|
Most Recent Note - 3/12/2021 10:57:21 PM
G - Hit another new all-time high with today's 6th consecutive gain. Disciplined investors avoid chasing stocks extended more than +5% above their pivot point. See the latest FSU analysis for more details and a new annotated graph.
>>> FEATURED STOCK ARTICLE : Perched at Record High After 6 Consecutive Gains - 3/12/2021 |
View all notes |
Set NEW NOTE alert |
Company Profile |
SEC
News |
Chart |
Request a new note
C
A
S
I |
CLFD
-
NASDAQ
Clearfield Inc
TELECOMMUNICATIONS - Cables / Satalite Equipment
|
$33.52
|
+0.06
0.18% |
$33.85
|
147,153
86.56% of 50 DAV
50 DAV is 170,000
|
$38.75
-13.50%
|
1/20/2021
|
$31.38
|
PP = $28.42
|
|
MB = $29.84
|
Most Recent Note - 3/12/2021 11:03:37 PM
G - Posted a 4th consecutive gain with higher volume today. Found prompt support near its 50 DMA line but it has not formed a sound base of sufficient length. Prior highs in the $28 area acted as support. Fundamentals remain strong.
>>> FEATURED STOCK ARTICLE : Quiet Gain Repaired 50-Day Moving Average Violation - 3/9/2021 |
View all notes |
Set NEW NOTE alert |
Company Profile |
SEC
News |
Chart |
Request a new note
C
A
S
I |
EDUC
-
NASDAQ
Educational Development
WHOLESALE - Basic Materials Wholesale
|
$17.91
|
+0.77
4.49% |
$18.69
|
31,828
83.76% of 50 DAV
50 DAV is 38,000
|
$20.00
-10.45%
|
3/10/2021
|
$17.89
|
PP = $20.10
|
|
MB = $21.11
|
 Most Recent Note - 3/17/2021 5:39:29 PM
Y - Rebounded toward its 52-week high with today's big gain backed by below average volume. Subsequent gains above the pivot point backed by at least +40% above average volume are needed to trigger a proper technical buy signal. Found support at its 200 DMA line since noted with caution in the 10/22/20 mid-day report. Reported earnings +55% on +63% sales revenues for the Nov '20 quarter versus the year-ago period, its 3rd strong quarterly comparison above the +25% minimum guideline (C criteria), helping it better match with the fact-based investment system's fundamental guidelines. This thinly traded Media - Books firm's annual earnings (A criteria) history has strong.
>>> FEATURED STOCK ARTICLE : Gain Leaves Media - Books Firm Perched Near Pivot Point - 3/10/2021 |
View all notes |
Set NEW NOTE alert |
Company Profile |
SEC
News |
Chart |
Request a new note
C
A
S
I |
Symbol/Exchange
Company Name
Industry Group |
PRICE |
CHANGE
(%Change) |
Day High |
Volume
(% DAV)
(% 50 day avg vol) |
52 Wk Hi
% From Hi |
Featured
Date |
Price
Featured |
Pivot Featured |
|
Max Buy |
SMPL
-
NASDAQ
Simply Good Foods Co
Food-Confectionery
|
$34.71
|
+0.83
2.45% |
$34.75
|
460,384
65.86% of 50 DAV
50 DAV is 699,000
|
$35.25
-1.53%
|
12/28/2020
|
$30.40
|
PP = $31.44
|
|
MB = $33.01
|
Most Recent Note - 3/17/2021 5:41:26 PM
Y - Posted a 3rd consecutive gain today on lighter volume and ended near the session high for a best ever close. Gain last week with heavier volume triggered a technical buy signal. Its 50 DMA line ($29.63) recently acted as support. Its Relative Strength Rating is 76, below the 80+ minimum guideline for buy candidates. Its prior low ($26.78) defines the next important near term support to watch.
>>> FEATURED STOCK ARTICLE : Found Support at 50-Day Moving Average; Relative Strength Improved - 3/5/2021 |
View all notes |
Set NEW NOTE alert |
Company Profile |
SEC
News |
Chart |
Request a new note
C
A
S
I |
XPEL
-
NASDAQ
Xpel Inc
Auto/Truck-Tires andamp; Misc
|
$61.78
|
+0.42
0.68% |
$62.87
|
272,399
89.90% of 50 DAV
50 DAV is 303,000
|
$65.74
-6.02%
|
3/11/2021
|
$59.70
|
PP = $60.87
|
|
MB = $63.91
|
Most Recent Note - 3/16/2021 5:21:15 PM
Y - Pulled back today for a 3rd consecutive small loss on lighter volume. Finished strong after highlighted in yellow with pivot point cited based on its 1/14/21 high plus 10 cents in the 3/11/21 mid-day report. The big gain and strong close above its pivot point backed by +250% above average volume triggered a new technical buy signal as it hit a new 52-week high. Prior highs in the $60 area define initial support to watch above its 50 DMA line ($53.77).
>>> FEATURED STOCK ARTICLE : Powerful Breakout Backed by Heavy Volume - 3/11/2021 |
View all notes |
Set NEW NOTE alert |
Company Profile |
SEC
News |
Chart |
Request a new note
C
A
S
I |
DT
-
NYSE
Dynatrace Inc
Computer Sftwr-Enterprse
|
$54.25
|
-0.13
-0.24% |
$55.22
|
1,825,792
69.69% of 50 DAV
50 DAV is 2,620,000
|
$56.94
-4.72%
|
2/4/2021
|
$51.39
|
PP = $48.95
|
|
MB = $51.40
|
Most Recent Note - 3/15/2021 5:32:58 PM
G - Posted a solid gain today with below average volume. Found prompt support after testing prior highs in the $48 area and its 50 DMA line ($48.10). More damaging losses would raise serious concerns. Its Relative Strength Rating is 78, still below the 80+ minimum guideline for buy candidates. Fundamentals remain strong after it reported Dec '20 earnings +70% on +28% sales revenues versus the year ago period.
>>> FEATURED STOCK ARTICLE : Consolidating Above Prior Highs and 50-Day Moving Average - 3/3/2021 |
View all notes |
Set NEW NOTE alert |
Company Profile |
SEC
News |
Chart |
Request a new note
C
A
S
I |
MRBK
-
NASDAQ
Meridian Corp
Banks-Northeast
|
$25.93
|
-0.33
-1.26% |
$26.50
|
28,683
91.06% of 50 DAV
50 DAV is 31,500
|
$27.93
-7.16%
|
2/22/2021
|
$25.58
|
PP = $26.10
|
|
MB = $27.41
|
Most Recent Note - 3/16/2021 12:41:52 PM
Y - Pulling back for a 4th consecutive loss today after a noted "negative reversal" at its 52-week high. Prior high defines initial support to watch on pullbacks. See the latest FSU analysis for more details and an annotated graph.
>>> FEATURED STOCK ARTICLE : Prior High Defines Initial Support to Watch - 3/15/2021 |
View all notes |
Set NEW NOTE alert |
Company Profile |
SEC
News |
Chart |
Request a new note
C
A
S
I |
|
|
|
THESE ARE NOT BUY RECOMMENDATIONS!
Comments contained in the body of this report are technical
opinions only. The material herein has been obtained
from sources believed to be reliable and accurate, however,
its accuracy and completeness cannot be guaranteed.
This site is not an investment advisor, hence it does
not endorse or recommend any securities or other investments.
Any recommendation contained in this report may not
be suitable for all investors and it is not to be deemed
an offer or solicitation on our part with respect to
the purchase or sale of any securities. All trademarks,
service marks and trade names appearing in this report
are the property of their respective owners, and are
likewise used for identification purposes only.
This report is a service available
only to active Paid Premium Members.
You may opt-out of receiving report notifications
at any time. Questions or comments may be submitted
by writing to Premium Membership Services 665 S.E. 10 Street, Suite 201 Deerfield Beach, FL 33441-5634 or by calling 1-800-965-8307
or 954-785-1121.
|
|
|