You are not logged in.
This means you
CAN ONLY VIEW reports that were published prior to Thursday, March 20, 2025.
You
MUST UPGRADE YOUR MEMBERSHIP if you want to see any current reports.
AFTER MARKET UPDATE - MONDAY, MARCH 1ST, 2021
Previous After Market Report Next After Market Report >>>
|
|
|
|
DOW |
+603.14 |
31,535.51 |
+1.95% |
|
Volume |
1,077,569,689 |
-35% |
|
Volume |
5,020,490,200 |
-15% |
|
NASDAQ |
+396.48 |
13,588.83 |
+3.01% |
|
Advancers |
2,568 |
80% |
|
Advancers |
3,183 |
80% |
|
S&P 500 |
+90.67 |
3,901.82 |
+2.38% |
|
Decliners |
654 |
20% |
|
Decliners |
788 |
20% |
|
Russell 2000 |
+74.27 |
2,275.32 |
+3.37% |
|
52 Wk Highs |
218 |
|
|
52 Wk Highs |
224 |
|
|
S&P 600 |
+39.02 |
1,317.58 |
+3.05% |
|
52 Wk Lows |
25 |
|
|
52 Wk Lows |
47 |
|
|
 |
Major Indices Rose With Lighter Volume Totals
Kenneth J. Gruneisen - Passed the CAN SLIM® Master's Exam
The Dow surged 603 points, while the Nasdaq Composite jumped 3%, now within 3.6% of its most recent record closing high reached on February 12. The S&P 500 bounced 2.4% higher for its best one-day performance since June. Small-cap stocks outperformed, with the Russell 2000 rallying 3.3%. The volume totals were lighter than the prior session on the NYSE and lighter on the Nasdaq exchange, indicative of lackluster institutional buying demand. Breadth was positive as advancers led decliners by almost a 4-1 margin on the NYSE and by more than 4-1 on the Nasdaq exchange. There were 78 high-ranked companies from the Leaders List that hit new 52-week highs and were listed on the BreakOuts Page, versus the total of 20 on the prior session. New 52-week highs outnumbered new 52-week lows totals on both exchanges. The major indices' uptrend (M criteria) has clearly come under pressure. It remains very important for healthy leadership to continue, for any rally can only be sustained if it is supported by many stocks hitting new highs. Investors are reminded to always make buying and selling decisions based based on the strict criteria and rules of the fact-based investment system. PICTURED: The Dow Jones Industrial Average posted a gain on lighter volume after testing its 50-day moving average (DMA) line with volume-driven losses.
U.S. stocks finished firmly in positive territory on Monday. Fiscal stimulus and vaccine developments propelled the market. Investor appetite for risk assets was renewed after the U.S. House of Representatives passed a $1.9 trillion COVID-19 relief package and Johnson & Johnson’s single-shot COVID-19 vaccine was granted emergency use authorization by the FDA.
All 11 S&P 500 sectors closed higher, with Technology and Financials pacing gains, each rising more than 3%. In earnings, Berkshire Hathaway class B shares (BRKB +3.48%) rose after posting a 23% increase in its quarterly profit and noting it repurchased almost $25 billion in stock last year. Elsewhere, Boeing (BA +5.84%) led the Dow higher, advancing on news that United Airlines (UAL +1.20%) had ordered 25 new 737-MAX jets to replace older aircrafts and meet projected post-pandemic demand growth.
Treasuries stabilized on the heels of last week’s steep sell-off, with the yield on the 10-year note adding three basis points to 1.43%. On the data front, the ISM’s gauge of U.S. manufacturing activity jumped to 60.8 in February, improving more than anticipated and hitting its best level in three years. Separately, construction spending climbed to a record high in January, more than doubling consensus forecasts by rising 1.7%. In commodities, WTI crude slumped 1.8% to $60.39/barrel amid concerns surrounding Chinese consumption. |
 Kenneth J. Gruneisen started out as a licensed stockbroker in August 1987, a couple of months prior to the historic stock market crash that took the Dow Jones Industrial Average down -22.6% in a single day. He has published daily fact-based fundamental and technical analysis on high-ranked stocks online for two decades. Through FACTBASEDINVESTING.COM, Kenneth provides educational articles, news, market commentary, and other information regarding proven investment systems that work in good times and bad.
Comments contained in the body of this report are technical opinions only and are not necessarily those of Gruneisen Growth Corp. The material herein has been obtained from sources believed to be reliable and accurate, however, its accuracy and completeness cannot be guaranteed. Our firm, employees, and customers may effect transactions, including transactions contrary to any recommendation herein, or have positions in the securities mentioned herein or options with respect thereto. Any recommendation contained in this report may not be suitable for all investors and it is not to be deemed an offer or solicitation on our part with respect to the purchase or sale of any securities. |
|
 |
Financial, Retail, Tech, and Energy-Linked Groups Rose
Kenneth J. Gruneisen - Passed the CAN SLIM® Master's Exam
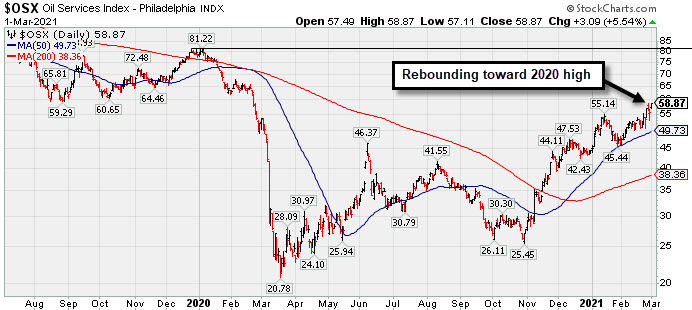
The Broker/Dealer Index ($XBD +3.41%) and Bank Index ($BKX +3.37%) both posted solid gains and the Retail Index ($RLX +1.73%) also posted an influential gain that helped the major indices rise. The tech sector saw unanimous gains from the Semiconductor Index ($SOX +3.31%), Networking Index ($NWX +2.99%), and the Biotech Index ($BTK +1.21%). The Oil Services Index ($OSX +5.54%) posted a standout gain and the Integrated Oil Index ($XOI +1.97%) also notched a solid gain. Meanwhile the Gold & Silver Index ($XAU -0.35%) was a clear laggard as it ended the day slightly lower. PICTURED: The Oil Services Index ($OSX +5.54%) is rebounding toward its 2020 high.
| Oil Services |
$OSX |
58.87 |
+3.09 |
+5.54% |
+32.80% |
| Integrated Oil |
$XOI |
1,003.57 |
+19.37 |
+1.97% |
+26.64% |
| Semiconductor |
$SOX |
3,169.11 |
+101.48 |
+3.31% |
+13.36% |
| Networking |
$NWX |
797.24 |
+23.17 |
+2.99% |
+11.17% |
| Broker/Dealer |
$XBD |
444.25 |
+14.67 |
+3.41% |
+17.65% |
| Retail |
$RLX |
3,540.52 |
+60.14 |
+1.73% |
-0.64% |
| Gold & Silver |
$XAU |
130.33 |
-0.46 |
-0.35% |
-9.61% |
| Bank |
$BKX |
117.23 |
+3.83 |
+3.37% |
+19.73% |
| Biotech |
$BTK |
5,813.58 |
+69.56 |
+1.21% |
+1.30% |
|
|
|
 |
CRL Still Hovering Near Record High
Kenneth J. Gruneisen - Passed the CAN SLIM® Master's Exam
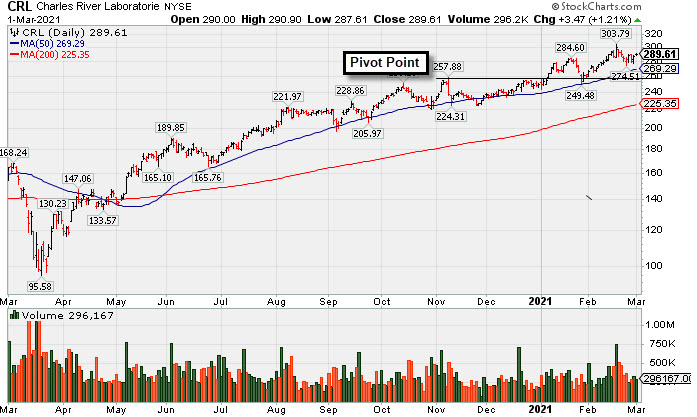
Charles River Labs Intl (CRL +$3.47 or +1.21% to $289.61) posted a small gain today with below average volume. It is extended from any sound base and has been sputtering since it reported Dec '20 quarterly earnings +19% on +14% sales revenues versus the year ago period, below the +25% minimum earnings guideline (C criteria). It still has a 92 Earnings Per Share Rating. Annual earnings (A criteria) history has been strong and steady.
Its Relative Strength Rating is 78, just below the 80+ minimum guideline for buy candidates. It found prompt support near the prior high ($257) and its 50-day moving average DMA line ($269) when they were tested during the prior consolidation. More damaging losses would raise concerns and trigger technical sell signals.
It hails from the Medical - Research Equipment/Services industry group which currently has a mediocre B- (52) Group Relative Strength Rating (L criteria). CRL traded up as much as +57.7% since it was highlighted in yellow with pivot point cited based on its 6/03/20 high plus 10 cents in the 7/15/20 mid-day report (read here). It was last shown in this FSU section on 1/29/21 with an annotated graph under the headline, "Testing Important Support on Pullback".
The number of top-rated funds owning its shares rose from 681 in Dec '19 to 833 in Dec '20, and its Up/Down Volume Ratio is 1.4 is an unbiased indication its shares have been under accumulation over the past 50 days. There is a small number of only 49.8 million shares (S criteria) outstanding, which can contribute to greater price volatility in the event of institutional buying or selling.
|
|
|
Color Codes Explained :
Y - Better candidates highlighted by our
staff of experts.
G - Previously featured
in past reports as yellow but may no longer be buyable under the
guidelines.
***Last / Change / Volume data in this table is the closing quote data***
Symbol/Exchange
Company Name
Industry Group |
PRICE |
CHANGE
(%Change) |
Day High |
Volume
(% DAV)
(% 50 day avg vol) |
52 Wk Hi
% From Hi |
Featured
Date |
Price
Featured |
Pivot Featured |
|
Max Buy |
 CRL
-
NYSE
CRL
-
NYSE
Charles River Labs Intl
DRUGS - Biotechnology
|
$289.61
|
+3.47
1.21% |
$290.90
|
296,167
90.85% of 50 DAV
50 DAV is 326,000
|
$303.79
-4.67%
|
12/17/2020
|
$247.06
|
PP = $257.98
|
|
MB = $270.88
|
 Most Recent Note - 3/1/2021 5:21:23 PM
G - Posted a gain today with below average volume. Sputtering since it reported Dec '20 quarterly earnings +19% on +14% sales revenues versus the year ago period, below the +25% minimum earnings guideline (C criteria). See the latest FSU analysis for more details and a new annotated graph.
>>> FEATURED STOCK ARTICLE : CRL Still Hovering Near Record High - 3/1/2021 |
View all notes |
Set NEW NOTE alert |
Company Profile |
SEC
News |
Chart |
Request a new note
C
A
S
I |
OPY
-
NYSE
Oppenheimer Holdings Inc
FINANCIAL SERVICES - Investment Brokerage - Regiona
|
$40.23
|
+2.33
6.15% |
$40.45
|
257,885
211.38% of 50 DAV
50 DAV is 122,000
|
$39.65
1.46%
|
2/25/2021
|
$38.95
|
PP = $38.11
|
|
MB = $40.02
|
Most Recent Note - 3/1/2021 5:25:21 PM
G - Color code is changed to green after hitting a new all-time high and rallying above its "max buy" level with today's big volume-driven gain. Disciplined investors avoid chasing stocks extended more than +5% above their pivot point.
>>> FEATURED STOCK ARTICLE : Rose From "3-weeks Tight" Base But Ended Near Session Low - 2/25/2021 |
View all notes |
Set NEW NOTE alert |
Company Profile |
SEC
News |
Chart |
Request a new note
C
A
S
I |
CLFD
-
NASDAQ
Clearfield Inc
TELECOMMUNICATIONS - Cables / Satalite Equipment
|
$34.98
|
+2.57
7.93% |
$35.22
|
193,846
123.47% of 50 DAV
50 DAV is 157,000
|
$38.75
-9.73%
|
1/20/2021
|
$31.38
|
PP = $28.42
|
|
MB = $29.84
|
Most Recent Note - 3/1/2021 5:27:08 PM
G - Posted a solid gain today. It is very extended from any sound base. Its 50 DMA line ($30.32) defines important near-term support to watch above its prior highs in the $28 area. Fundamentals remain strong.
>>> FEATURED STOCK ARTICLE : Consolidating Well Above 50-Day Moving Average Line - 2/24/2021 |
View all notes |
Set NEW NOTE alert |
Company Profile |
SEC
News |
Chart |
Request a new note
C
A
S
I |
SMPL
-
NASDAQ
Simply Good Foods Co
Food-Confectionery
|
$30.73
|
+1.56
5.35% |
$31.23
|
525,643
46.27% of 50 DAV
50 DAV is 1,136,000
|
$32.03
-4.06%
|
12/28/2020
|
$30.40
|
PP = $31.44
|
|
MB = $33.01
|
Most Recent Note - 3/1/2021 5:32:38 PM
Y - Posted a big gain today with light volume, rallying for its second-best ever close. Its 50 DMA line ($28.84) recently acted as support. Its Relative Strength Rating is 75, still below the 80+ minimum guideline. Its prior low ($26.78) defines the next important near term support to watch.
>>> FEATURED STOCK ARTICLE : Pulling Back Quietly After Rebounding Near All-Time High - 2/17/2021 |
View all notes |
Set NEW NOTE alert |
Company Profile |
SEC
News |
Chart |
Request a new note
C
A
S
I |
TEAM
-
NASDAQ
Atlassian Corp Plc
Comp Sftwr-Spec Enterprs
|
$251.50
|
+13.80
5.81% |
$252.18
|
1,416,866
99.90% of 50 DAV
50 DAV is 1,418,300
|
$262.40
-4.15%
|
10/12/2020
|
$193.77
|
PP = $199.60
|
|
MB = $209.58
|
Most Recent Note - 3/1/2021 5:33:53 PM
G - Rebounded above its 50 DMA line ($238) with today's big gain backed by average volume. The recent low ($208.62 on 1/27/21) defines the next important near-term support to watch. Still, its current Relative Strength Rating is 65, below the +80 minimum guideline for buy candidates. Fundamental concerns remain after earnings rose +0% on +23% sales revenues for the Dec '20 quarter versus the year ago period, its 2nd comparison below the +25% minimum earnings guideline (C criteria).
>>> FEATURED STOCK ARTICLE : Quietly Touched a New High Despite Fundamental Concerns Noted - 2/8/2021 |
View all notes |
Set NEW NOTE alert |
Company Profile |
SEC
News |
Chart |
Request a new note
C
A
S
I |
Symbol/Exchange
Company Name
Industry Group |
PRICE |
CHANGE
(%Change) |
Day High |
Volume
(% DAV)
(% 50 day avg vol) |
52 Wk Hi
% From Hi |
Featured
Date |
Price
Featured |
Pivot Featured |
|
Max Buy |
SHOP
-
NYSE
Shopify Inc Cl A
Computer Sftwr-Enterprse
|
$1,309.94
|
+28.97
2.26% |
$1,330.00
|
1,267,980
90.25% of 50 DAV
50 DAV is 1,405,000
|
$1,499.75
-12.66%
|
2/2/2021
|
$1,218.72
|
PP = $1,285.28
|
|
MB = $1,349.54
|
Most Recent Note - 2/25/2021 5:32:59 PM
G - Down considerably today undercutting the prior high ($1,285 on 12/22/20) raising concerns. Retesting important support near its 50 DMA line ($1,228) where more damaging losses would raise serious concerns. Reported Dec '20 quarterly earnings +267% on +94% sales revenues versus the year ago period.
>>> FEATURED STOCK ARTICLE : Perched Within Striking Distance of New Pivot Point - 2/3/2021 |
View all notes |
Set NEW NOTE alert |
Company Profile |
SEC
News |
Chart |
Request a new note
C
A
S
I |
YETI
-
NYSE
Yeti Holdings Inc
Leisure-Products
|
$71.17
|
+2.40
3.49% |
$72.10
|
858,980
58.12% of 50 DAV
50 DAV is 1,478,000
|
$80.89
-12.02%
|
2/19/2021
|
$74.99
|
PP = $80.99
|
|
MB = $85.04
|
Most Recent Note - 3/1/2021 5:35:37 PM
G - Rebounded near its 50 DMA line ($71.53) with today's big gain backed by below average volume. That short-term average may act as resistance. Prior low ($64.80) on 2/01/21) defines important near term support where a violation may trigger a more worrisome technical sell signal. Fundamentals remain strong.
>>> FEATURED STOCK ARTICLE : Rebounded Just Above 50-Day Moving Average Line - 2/18/2021 |
View all notes |
Set NEW NOTE alert |
Company Profile |
SEC
News |
Chart |
Request a new note
C
A
S
I |
DOCU
-
NASDAQ
Docusign Inc
Computer Sftwr-Enterprse
|
$238.56
|
+11.90
5.25% |
$240.93
|
5,072,821
166.43% of 50 DAV
50 DAV is 3,048,000
|
$290.23
-17.80%
|
1/12/2021
|
$253.50
|
PP = $256.10
|
|
MB = $268.91
|
Most Recent Note - 3/1/2021 5:30:44 PM
G - With today's 2nd consecutive volume-driven gain it rebounded toward its 50 DMA line ($243.51). That important short-term average may act as resistance after damaging losses triggered a technical sell signal. Fundamentals remain strong.
>>> FEATURED STOCK ARTICLE : Consolidating Back Above 50-Day Moving Average Near Prior High - 2/9/2021 |
View all notes |
Set NEW NOTE alert |
Company Profile |
SEC
News |
Chart |
Request a new note
C
A
S
I |
DT
-
NYSE
Dynatrace Inc
Computer Sftwr-Enterprse
|
$53.35
|
+3.59
7.21% |
$53.36
|
2,413,962
94.05% of 50 DAV
50 DAV is 2,566,700
|
$56.77
-6.02%
|
2/4/2021
|
$51.39
|
PP = $48.95
|
|
MB = $51.40
|
Most Recent Note - 3/1/2021 5:28:24 PM
G - Posted a big gain with near average volume today. Its Relative Strength Rating of 73 remains below the 80+ minimum guideline for buy candidates. Prior highs in the $48 area define initial support to watch above its 50 DMA line ($46.53). Fundamentals remain strong after it reported Dec '20 earnings +70% on +28% sales revenues versus the year ago period.
>>> FEATURED STOCK ARTICLE : Breakout Action Returns Dynatrace to Featured Stocks List - 2/4/2021 |
View all notes |
Set NEW NOTE alert |
Company Profile |
SEC
News |
Chart |
Request a new note
C
A
S
I |
MRBK
-
NASDAQ
Meridian Corp
Banks-Northeast
|
$24.84
|
+0.40
1.64% |
$25.48
|
27,017
96.49% of 50 DAV
50 DAV is 28,000
|
$26.94
-7.80%
|
2/22/2021
|
$25.58
|
PP = $26.10
|
|
MB = $27.41
|
Most Recent Note - 2/26/2021 12:50:11 PM
Y - Gapped down today following a Special Dividend. Posted 3 consecutive gains with above average volume for new high closes. Pivot point cited was based on its 12/18/21 high plus 10 cents. Subsequent gains and a strong close above its pivot point backed by at least +40% above average volume may help clinch a convincing technical buy signal. Fundamentals are strong.
>>> FEATURED STOCK ARTICLE : Negative Reversal When Poised to Convincingly Breakout - 2/22/2021 |
View all notes |
Set NEW NOTE alert |
Company Profile |
SEC
News |
Chart |
Request a new note
C
A
S
I |
Symbol/Exchange
Company Name
Industry Group |
PRICE |
CHANGE
(%Change) |
Day High |
Volume
(% DAV)
(% 50 day avg vol) |
52 Wk Hi
% From Hi |
Featured
Date |
Price
Featured |
Pivot Featured |
|
Max Buy |
AXON
-
NASDAQ
Axon Enterprise Inc
Security/Sfty
|
$169.65
|
+4.16
2.51% |
$174.83
|
1,052,040
150.08% of 50 DAV
50 DAV is 701,000
|
$212.37
-20.12%
|
12/22/2020
|
$127.84
|
PP = $130.51
|
|
MB = $137.04
|
Most Recent Note - 2/26/2021 6:58:41 PM
G - Posted a gain today breaking a streak of 4 consecutive losses while slumping toward its 50 DMA line ($153.35). Reported strong Dec '20 quarterly results. See the the latest FSU analysis for more details and a new annotated graph.
>>> FEATURED STOCK ARTICLE : Slumping Toward 50-Day Average Following Great Rally - 2/26/2021 |
View all notes |
Set NEW NOTE alert |
Company Profile |
SEC
News |
Chart |
Request a new note
C
A
S
I |
|
|
|
THESE ARE NOT BUY RECOMMENDATIONS!
Comments contained in the body of this report are technical
opinions only. The material herein has been obtained
from sources believed to be reliable and accurate, however,
its accuracy and completeness cannot be guaranteed.
This site is not an investment advisor, hence it does
not endorse or recommend any securities or other investments.
Any recommendation contained in this report may not
be suitable for all investors and it is not to be deemed
an offer or solicitation on our part with respect to
the purchase or sale of any securities. All trademarks,
service marks and trade names appearing in this report
are the property of their respective owners, and are
likewise used for identification purposes only.
This report is a service available
only to active Paid Premium Members.
You may opt-out of receiving report notifications
at any time. Questions or comments may be submitted
by writing to Premium Membership Services 665 S.E. 10 Street, Suite 201 Deerfield Beach, FL 33441-5634 or by calling 1-800-965-8307
or 954-785-1121.
|
|
|