You are not logged in.
This means you
CAN ONLY VIEW reports that were published prior to Friday, March 28, 2025.
You
MUST UPGRADE YOUR MEMBERSHIP if you want to see any current reports.
AFTER MARKET UPDATE - WEDNESDAY, MARCH 15TH, 2023
Previous After Market Report Next After Market Report >>>
|
|
|
|
DOW |
-280.83 |
31,874.57 |
-0.87% |
|
Volume |
1,472,780,056 |
+12% |
|
Volume |
5,847,056,000 |
+6% |
|
NASDAQ |
+5.90 |
11,434.05 |
+0.05% |
|
Advancers |
641 |
23% |
|
Advancers |
1,324 |
30% |
|
S&P 500 |
-27.36 |
3,891.93 |
-0.70% |
|
Decliners |
2,197 |
77% |
|
Decliners |
3,096 |
70% |
|
Russell 2000 |
-30.95 |
1,745.94 |
-1.74% |
|
52 Wk Highs |
12 |
|
|
52 Wk Highs |
29 |
|
|
S&P 600 |
-19.33 |
1,147.10 |
-1.66% |
|
52 Wk Lows |
266 |
|
|
52 Wk Lows |
432 |
|
|
Damaging losses on Thursday and Friday signaled a shift from the prior market uptrend (M criteria) to an uptrend under pressure and then quickly to a "market correction". Disciplined investors know to reduce market exposure by selling any weakening stocks on a case-by-case basis.
|
 |
Breadth Negative as Major Indices Slump With Higher Volume
Kenneth J. Gruneisen - Passed the CAN SLIM® Master's Exam
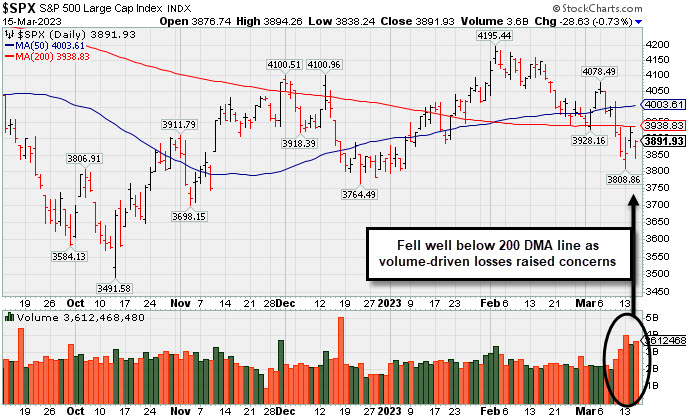
The Dow shed 280 points (0.9%), while the Nasdaq Composite added 0.1%. The S&P 500 declined 0.7%. Volume totals were higher than the prior session on the NYSE and on the Nasdaq exchange, indicating greater selling pressure coming from the institutional crowd. Breadth was clearly negative as decliners led advancers by more than a 3-1 margin on the NYSE and by more than 2-1 on the Nasdaq exchange. Leadership remained thin as there were 4 high-ranked companies from the Leaders List that hit a new 52-week high and were listed on the BreakOuts Page, versus 5 on the prior session. New 52-week lows totals expanded and soldly outnumbered a shrinking list of new 52-week highs on the NYSE and on the Nasdaq exchange. The evaporation of leadership and damaging losses late last week abruptly signaled that the major indices are in a market correction (M criteria). Disciplined investors know that in a market correction it is best to avoid new buying efforts and raise safe cash.
PICTURED: The S&P 500 Index recently fell well below its 200-day moving average (DMA) line with damaging losses marked by higher volume. The December and October lows define the next important chart support levels to watch as the market correction continues.
Six of 11 sectors finished in negative territory as U.S. equities pared losses to finish mixed in volatile trading Wednesday. There was renewed trouble in the Financials sector. Shares of Credit Suisse Group AG (CS -13.94%) led markets lower after their largest investor, Saudi National Bank, announced they will no longer provide funding for the Swiss bank. This afternoon, Credit Suisse and the Swiss authorities reported they are currently working to stabilize the bank. The turmoil comes days after several regional U.S. banks collapsed.
On the data front, the Producer Price Index (PPI), which serves as a measure of wholesale inflation, came in at -0.1% month-over-month in February, easing from the prior month’s revised 0.3% print, while the annual rate of growth eased to 4.6%. Core PPI, which excludes the more volatile food and energy prices, was unchanged on a monthly basis and eased to a 4.4% year-over-year growth rate. Elsewhere, retail sales for February fell 0.4% month-over-month as consumers adjusted their behavior amid stubbornly high inflation.
Treasuries strengthened, with the yield on the benchmark 10-year note shedding 20 basis points (0.20%) to 3.46%, while the 30-year bond yield fell 13 basis points (0.13%) to 3.65%. The yield on the two-year note declined 31 basis points (0.31%) to 3.92%. In commodities, West Texas Intermediate (WTI) crude tumbled 4.5% to $68.11/barrel as unease over the banking sector outweighed optimism over renewed demand from China. |
 Kenneth J. Gruneisen started out as a licensed stockbroker in August 1987, a couple of months prior to the historic stock market crash that took the Dow Jones Industrial Average down -22.6% in a single day. He has published daily fact-based fundamental and technical analysis on high-ranked stocks online for two decades. Through FACTBASEDINVESTING.COM, Kenneth provides educational articles, news, market commentary, and other information regarding proven investment systems that work in good times and bad.
Comments contained in the body of this report are technical opinions only and are not necessarily those of Gruneisen Growth Corp. The material herein has been obtained from sources believed to be reliable and accurate, however, its accuracy and completeness cannot be guaranteed. Our firm, employees, and customers may effect transactions, including transactions contrary to any recommendation herein, or have positions in the securities mentioned herein or options with respect thereto. Any recommendation contained in this report may not be suitable for all investors and it is not to be deemed an offer or solicitation on our part with respect to the purchase or sale of any securities. |
|
 |
Energy and Financial Indexes Fell; Retail Index Edged Higher
Kenneth J. Gruneisen - Passed the CAN SLIM® Master's Exam
Energy-linked groups led decliners as the Oil Services Index ($OSX -6.77%) and Integrated Oil Index ($XOI -5.62%) both suffered considerable losses. Financials also weighed on the major averages as the Bank Index ($BKX -3.55%) and Broker/Dealer Index ($XBD -1.73%) both slumped. The tech sector had a slightly negative bias as the Semiconductor Index ($SOX -1.09%), Networking Index ($NWX -1.36%), and Biotech Index ($BTK -0.63%) each lost ground. The Retail Index ($RLX +0.79%) posted a standout gain. The Gold & Silver Index ($XAU -0.46%) edged lower.
PICTURED: The Biotech Index ($BTK -0.63%) recently tested its 200-day moving average (DMA) line.
| Oil Services |
$OSX |
73.82 |
-5.36 |
-6.77% |
-11.97% |
| Integrated Oil |
$XOI |
1,593.49 |
-94.94 |
-5.62% |
-10.84% |
| Semiconductor |
$SOX |
2,977.39 |
-32.76 |
-1.09% |
+17.59% |
| Networking |
$NWX |
809.21 |
-11.19 |
-1.36% |
+3.31% |
| Broker/Dealer |
$XBD |
442.49 |
-7.79 |
-1.73% |
-1.48% |
| Retail |
$RLX |
2,849.49 |
+22.25 |
+0.79% |
+3.47% |
| Gold & Silver |
$XAU |
118.56 |
-0.55 |
-0.46% |
-1.90% |
| Bank |
$BKX |
81.08 |
-2.99 |
-3.55% |
-19.60% |
| Biotech |
$BTK |
5,175.44 |
-32.69 |
-0.63% |
-2.00% |
|
|
|
 |
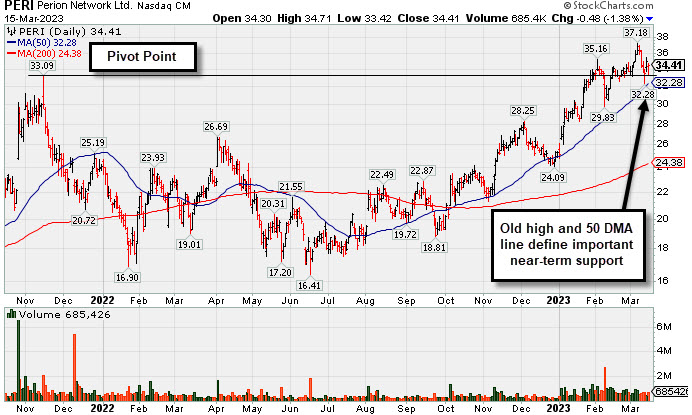
Consolidating in an Orderly Manner Above Old High and 50 DMA Line
Kenneth J. Gruneisen - Passed the CAN SLIM® Master's Exam
Perion Networks Ltd (PERI -$0.48 or -1.38% to $34.41) has suffered 5 losses with below average volume in the span of 6 session since hitting new all-time highs with recent gains backed by above average volume. Its prior high ($33) and 50-day moving average (DMA) line ($32.28) define important near-term support where violations would raise concerns and trigger technical sell signals.
PERI has a 98 Earnings Per Share Rating. It reported Dec '22 quarterly earnings +45% on +33% sales revenues versus the year ago period and its prior quarterly earnings history has been above the +25% minimum (C criteria). Its annual earnings (A criteria) history has been improving steadily after a downturn from FY '15-18. It hails from the Commercial Services-Advertising group which is currently ranked 76th on the 197 Industry Groups list.
There are 45.8 million shares outstanding which can contribute to greater price volatility in the event of institutional buying or selling. The number of top-rated funds owning its shares rose from 113 in Mar '22 to 144 in Dec '22, a reassuring sign concerning the I criteria. Its current Up/Down Volume Ratio of 1.7 is an unbiased indication its shares have been under accumulation over the past 50 days.
|
|
|
Color Codes Explained :
Y - Better candidates highlighted by our
staff of experts.
G - Previously featured
in past reports as yellow but may no longer be buyable under the
guidelines.
***Last / Change / Volume data in this table is the closing quote data***
Symbol/Exchange
Company Name
Industry Group |
PRICE |
CHANGE
(%Change) |
Day High |
Volume
(% DAV)
(% 50 day avg vol) |
52 Wk Hi
% From Hi |
Featured
Date |
Price
Featured |
Pivot Featured |
|
Max Buy |
 GPK
-
NYSE
GPK
-
NYSE
Graphic Packaging Hldg
CONSUMER NON-DURABLES - Packaging and Containers
|
$23.42
|
-0.55
-2.29% |
$23.56
|
4,097,226
126.22% of 50 DAV
50 DAV is 3,246,000
|
$25.17
-6.95%
|
10/25/2022
|
$22.75
|
PP = $24.17
|
|
MB = $25.38
|
 Most Recent Note - 3/15/2023 5:46:25 PM
Y - Sputtering below the noted pivot point and testing support at its 50 DMA line ($23.32) with today's volume-driven loss. More damaging losses would raise greater concerns and trigger a technical sell signal. Broader market weakness (M criteria) has been noted as a "correction" that has raised concerns.
>>> FEATURED STOCK ARTICLE : Quietly Lingering Near High With Strong Fundamentals - 2/27/2023 |
View all notes |
Set NEW NOTE alert |
Company Profile |
SEC
News |
Chart |
Request a new note
C
A
S
I |
TITN
-
NASDAQ
Titan Machinery Inc
SPECIALTY RETAIL
|
$39.56
|
-2.42
-5.76% |
$40.90
|
456,291
195.00% of 50 DAV
50 DAV is 234,000
|
$47.87
-17.36%
|
1/13/2023
|
$40.10
|
PP = $44.45
|
|
MB = $46.67
|
Most Recent Note - 3/15/2023 12:58:41 PM
Due to report Jan '23 quarterly results. Volume and volatility often increase near earnings news. Today's damaging volume-driven loss has it -19.5% off its high hit last week. It will be dropped from the Featured Stocks list tonight. Only a prompt rebound above the 50 DMA line ($43.41) would help its outlook improve.
>>> FEATURED STOCK ARTICLE : Pulled Back from New All-Time High - 2/28/2023 |
View all notes |
Set NEW NOTE alert |
Company Profile |
SEC
News |
Chart |
Request a new note
C
A
S
I |
STRL
-
NASDAQ
Sterling Infrastructure
MATERIALS and; CONSTRUCTION - Heavy Construction
|
$37.79
|
-1.43
-3.65% |
$38.29
|
293,767
100.61% of 50 DAV
50 DAV is 292,000
|
$42.00
-10.02%
|
12/14/2022
|
$32.41
|
PP = $33.72
|
|
MB = $35.41
|
Most Recent Note - 3/15/2023 12:48:30 PM
G - Abruptly slumping further from its all-time high with today's big loss. Its 50 DMA line ($36.13) and prior highs in the $34-33 area define important near-term support to watch.
>>> FEATURED STOCK ARTICLE : Sterling Perched Near High, Extended From Prior Base - 2/24/2023 |
View all notes |
Set NEW NOTE alert |
Company Profile |
SEC
News |
Chart |
Request a new note
C
A
S
I |
PERI
-
NASDAQ
Perion Networks Ltd
Comml Svcs-Advertising
|
$34.41
|
-0.48
-1.38% |
$34.71
|
684,839
91.19% of 50 DAV
50 DAV is 751,000
|
$37.18
-7.45%
|
1/25/2023
|
$31.79
|
PP = $33.19
|
|
MB = $34.85
|
Most Recent Note - 3/15/2023 5:42:23 PM
Y - A spurt of losses has been backed by below average volume while consolidating above its 50 DMA line ($32.28) and the prior high ($33) which define important near-term support. See the latest FSU analysis for more details and a new annotated graph.
>>> FEATURED STOCK ARTICLE : Consolidating in an Orderly Manner Above Old High and 50 DMA Line - 3/15/2023 |
View all notes |
Set NEW NOTE alert |
Company Profile |
SEC
News |
Chart |
Request a new note
C
A
S
I |
ALGM
-
NASDAQ
Allegro Microsystems Inc
Elec-Semiconductor Mfg
|
$44.47
|
-0.69
-1.53% |
$45.45
|
1,560,279
100.08% of 50 DAV
50 DAV is 1,559,000
|
$47.67
-6.71%
|
1/31/2023
|
$37.80
|
PP = $38.38
|
|
MB = $40.30
|
Most Recent Note - 3/14/2023 1:09:51 PM
G - Posting a solid gain today after another noted "negative reversal" and 3 volume-driven losses from its all-time high. It is extended from the previously noted base. Its 50 DMA line ($39) and prior high in the $38 area define important support to watch on pullbacks.
>>> FEATURED STOCK ARTICLE : Holding its Ground After Rallying From Previously Noted Base - 3/1/2023 |
View all notes |
Set NEW NOTE alert |
Company Profile |
SEC
News |
Chart |
Request a new note
C
A
S
I |
Symbol/Exchange
Company Name
Industry Group |
PRICE |
CHANGE
(%Change) |
Day High |
Volume
(% DAV)
(% 50 day avg vol) |
52 Wk Hi
% From Hi |
Featured
Date |
Price
Featured |
Pivot Featured |
|
Max Buy |
WCC
-
NYSE
Wesco International Inc
WHOLESALE - Electronics Wholesale
|
$144.60
|
-10.66
-6.87% |
$150.47
|
1,110,648
225.74% of 50 DAV
50 DAV is 492,000
|
$175.00
-17.37%
|
2/10/2023
|
$148.50
|
PP = $147.15
|
|
MB = $154.51
|
Most Recent Note - 3/15/2023 1:02:42 PM
Violating its 50 DMA line ($151) and sinking below prior highs in the $144-147 area with today's big loss adding to recent volume-driven losses triggering a technical sell signal. It will be dropped from the Featured Stocks list tonight. Only a prompt rebound above the 50 DMA line would help its outlook improve. Reported Dec '22 quarterly earnings +40% on +15% sales revenues versus the year-ago period. Broader market weakness (M criteria) has been noted as a "correction" that has raised concerns.
>>> FEATURED STOCK ARTICLE : Wesco Hovering Near All-Time High After Recent Breakout - 3/9/2023 |
View all notes |
Set NEW NOTE alert |
Company Profile |
SEC
News |
Chart |
Request a new note
C
A
S
I |
FIX
-
NYSE
Comfort Systems U S A
MATERIALS and CONSTRUCTION - General Contractors
|
$136.12
|
-4.47
-3.18% |
$137.54
|
270,657
113.72% of 50 DAV
50 DAV is 238,000
|
$152.13
-10.52%
|
2/23/2023
|
$136.52
|
PP = $128.78
|
|
MB = $135.22
|
Most Recent Note - 3/15/2023 1:05:04 PM
G - Slumping further from its all-time high with today's big loss adding to a noted spurt of losses. Still is extended from the previously noted base. Prior highs in the $128 area define initial support to watch above its 50 DMA line ($127).
>>> FEATURED STOCK ARTICLE : Powerful Technical Breakout After Earnings Report - 2/23/2023 |
View all notes |
Set NEW NOTE alert |
Company Profile |
SEC
News |
Chart |
Request a new note
C
A
S
I |
KOF
-
NYSE
Coca Cola Femsa Sab Ads
FOOD and BEVERAGE - Beverages - Soft Drinks
|
$75.09
|
-0.46
-0.61% |
$75.30
|
156,839
90.66% of 50 DAV
50 DAV is 173,000
|
$79.16
-5.14%
|
3/7/2023
|
$76.63
|
PP = $77.11
|
|
MB = $80.97
|
Most Recent Note - 3/14/2023 1:19:27 PM
Y - Still perched near its 52-week high after 3 losses with near average volume. Highlighted in yellow with pivot point cited based on its 1/24/23 high plus 10 cents in the 3/07/23 mid-day report. Gains above the pivot point must be backed by at least +40% above average volume to trigger a proper technical buy signal.
>>> FEATURED STOCK ARTICLE : Mexican Coke Bottler Hits New Multi-Year High - 3/7/2023 |
View all notes |
Set NEW NOTE alert |
Company Profile |
SEC
News |
Chart |
Request a new note
C
A
S
I |
ANET
-
NYSE
Arista Networks Inc
Computer-Networking
|
$153.80
|
+0.65
0.42% |
$154.02
|
2,980,888
124.88% of 50 DAV
50 DAV is 2,387,000
|
$153.25
0.36%
|
3/8/2023
|
$147.59
|
PP = $148.67
|
|
MB = $156.10
|
Most Recent Note - 3/14/2023 1:12:07 PM
Y - Hitting a new all-time high today, adding to recent volume-driven gains. Highlighted in yellow in the 3/08/23 mid-day report with pivot point cited based on its 12/27/21 high plus 10 cents. A gain and strong close above the pivot point backed by at least +40% above average volume may trigger a proper technical buy signal. Fundamentals remain strong after it reported Dec '22 quarterly earnings +72% on +55% sales revenues versus the year ago period. Broader market weakness (M criteria) has been noted as a "correction" that has raised concerns.
>>> FEATURED STOCK ARTICLE : Arista Challenging All-Time High - 3/8/2023 |
View all notes |
Set NEW NOTE alert |
Company Profile |
SEC
News |
Chart |
Request a new note
C
A
S
I |
CLH
-
NYSE
Clean Harbors Inc
Pollution Control
|
$133.07
|
-3.33
-2.44% |
$135.02
|
823,696
224.44% of 50 DAV
50 DAV is 367,000
|
$140.69
-5.42%
|
3/10/2023
|
$136.89
|
PP = $136.74
|
|
MB = $143.58
|
Most Recent Note - 3/15/2023 5:44:31 PM
Y - Suffered another volume-driven loss today, slumping after a noted "negative reversal" on 3/09/23 at an all-time high. Fundamentals remain strong. Its 50 DMA line ($129) defines important near-term support to watch.
>>> FEATURED STOCK ARTICLE : Pullback to Support Marked Secondary Buy Point; Market Concerns Rose - 3/10/2023 |
View all notes |
Set NEW NOTE alert |
Company Profile |
SEC
News |
Chart |
Request a new note
C
A
S
I |
Symbol/Exchange
Company Name
Industry Group |
PRICE |
CHANGE
(%Change) |
Day High |
Volume
(% DAV)
(% 50 day avg vol) |
52 Wk Hi
% From Hi |
Featured
Date |
Price
Featured |
Pivot Featured |
|
Max Buy |
|
|
|
THESE ARE NOT BUY RECOMMENDATIONS!
Comments contained in the body of this report are technical
opinions only. The material herein has been obtained
from sources believed to be reliable and accurate, however,
its accuracy and completeness cannot be guaranteed.
This site is not an investment advisor, hence it does
not endorse or recommend any securities or other investments.
Any recommendation contained in this report may not
be suitable for all investors and it is not to be deemed
an offer or solicitation on our part with respect to
the purchase or sale of any securities. All trademarks,
service marks and trade names appearing in this report
are the property of their respective owners, and are
likewise used for identification purposes only.
This report is a service available
only to active Paid Premium Members.
You may opt-out of receiving report notifications
at any time. Questions or comments may be submitted
by writing to Premium Membership Services 665 S.E. 10 Street, Suite 201 Deerfield Beach, FL 33441-5634 or by calling 1-800-965-8307
or 954-785-1121.
|
|
|