You are not logged in.
This means you
CAN ONLY VIEW reports that were published prior to Friday, April 18, 2025.
You
MUST UPGRADE YOUR MEMBERSHIP if you want to see any current reports.
AFTER MARKET UPDATE - TUESDAY, MARCH 14TH, 2023
Previous After Market Report Next After Market Report >>>
|
|
|
|
DOW |
+336.26 |
32,155.40 |
+1.06% |
|
Volume |
1,309,250,201 |
-8% |
|
Volume |
5,513,511,600 |
-11% |
|
NASDAQ |
+239.31 |
11,428.15 |
+2.14% |
|
Advancers |
2,177 |
75% |
|
Advancers |
2,927 |
66% |
|
S&P 500 |
+64.80 |
3,920.56 |
+1.68% |
|
Decliners |
739 |
25% |
|
Decliners |
1,522 |
34% |
|
Russell 2000 |
+32.59 |
1,776.89 |
+1.87% |
|
52 Wk Highs |
18 |
|
|
52 Wk Highs |
31 |
|
|
S&P 600 |
+22.63 |
1,166.43 |
+1.98% |
|
52 Wk Lows |
99 |
|
|
52 Wk Lows |
214 |
|
|
Damaging losses on Thursday and Friday signaled a shift from the prior market uptrend (M criteria) to an uptrend under pressure and then quickly to a "market correction". Disciplined investors know to reduce market exposure by selling any weakening stocks on a case-by-case basis.
|
 |
Major Averages Posted Gains Backed by Lighter Volume Totals
Kenneth J. Gruneisen - Passed the CAN SLIM® Master's Exam
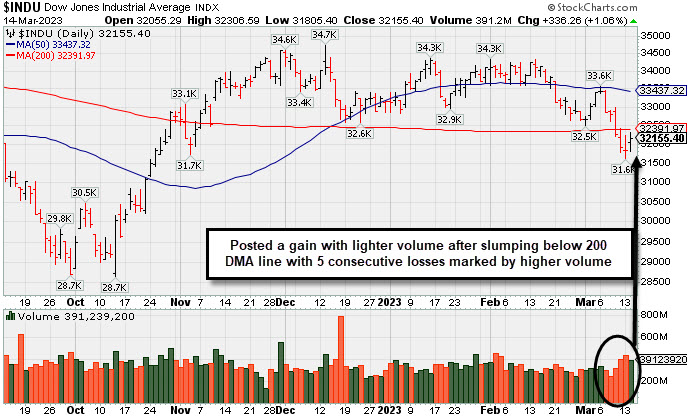
The Dow added 336 points (1.1%), while the Nasdaq Composite gained 2.1%. The S&P 500 increased 1.7%, snapping a three-day losing streak. Volume totals on Tuesday were lighter than the prior session on the NYSE and on the Nasdaq exchange, indicating lackluster buying demand coming from the institutional crowd. Breadth shifted to the positive side as advancers led decliners by almost a 3-1 margin on the NYSE and by nearly 2-1 on the Nasdaq exchange. There were 5 high-ranked companies from the Leaders List that hit a new 52-week high and were listed on the BreakOuts Page, versus 1 on the prior session. New 52-week lows totals contracted yet still soldly outnumbered a thin list of new 52-week highs on the NYSE and on the Nasdaq exchange. The evaporation of leadership and damaging losses late last week abruptly signaled that the major indices are in a market correction (M criteria). Disciplined investors know that in a market correction it is best to avoid new buying efforts and raise safe cash.
PICTURED: The Dow Jones Industrial Average posted a gain with lighter volume but remains below its 200-day moving average (DMA) lines after 5 consecutive damaging losses marked by higher volume.
All eleven sectors finished in positive territory as U.S. equities closed higher Tuesday. February’s Consumer Price Index (CPI) readings mostly met analysts’ expectations. Further boosting markets, the banking sector eased during intraday trading Tuesday after a major selloff hampered major averages in prior trading sessions. Following the closure of two regional banks, market participants are betting the risk has potentially been contained as bank stocks rebounded during Tuesday’s trading, leading to the sector’s biggest one-day climb since November 10.
On the data front, February’s National Federation of Independent Business’s Business Optimism Index unexpectedly increased from 90.3 to 90.9, notching its highest reading in three months. Despite February’s uptick, the index continues to remain below pre-pandemic levels. Meanwhile, February’s CPI showed a 0.4% month-over-month gain and a 6% year-over-year increase. Core CPI, which excludes the more volatile food and energy prices, climbed 0.5% month-over-month and 5.5% year-over-year.
Treasuries weakened, with the yield on the benchmark 10-year note increasing 14 basis points (0.14%) to 3.66% while the 30-year bond yield added 10 basis points (0.10%) to 3.78%. The yield on the two-year note gained 28 basis points (0.28%) to 4.23%. In commodities, West Texas Intermediate (WTI) crude declined 4.4% to $71.52/barrel amid fears of a potential financial crisis that may impact future demand. Meanwhile, the Organization of the Petroleum Exporting Countries (OPEC) projected an increase in Chinese demand in 2023 while keeping world oil demand growth forecasts unchanged at 2.32 million barrels/day. |
 Kenneth J. Gruneisen started out as a licensed stockbroker in August 1987, a couple of months prior to the historic stock market crash that took the Dow Jones Industrial Average down -22.6% in a single day. He has published daily fact-based fundamental and technical analysis on high-ranked stocks online for two decades. Through FACTBASEDINVESTING.COM, Kenneth provides educational articles, news, market commentary, and other information regarding proven investment systems that work in good times and bad.
Comments contained in the body of this report are technical opinions only and are not necessarily those of Gruneisen Growth Corp. The material herein has been obtained from sources believed to be reliable and accurate, however, its accuracy and completeness cannot be guaranteed. Our firm, employees, and customers may effect transactions, including transactions contrary to any recommendation herein, or have positions in the securities mentioned herein or options with respect thereto. Any recommendation contained in this report may not be suitable for all investors and it is not to be deemed an offer or solicitation on our part with respect to the purchase or sale of any securities. |
|
 |
Financial, Tech, Retail, and Commodity-Linked Groups Rose
Kenneth J. Gruneisen - Passed the CAN SLIM® Master's Exam
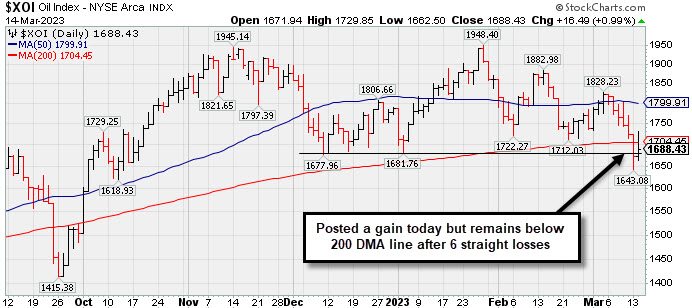
The Broker/Dealer Index ($XBD +3.04%) and Bank Index ($BKX +3.20%) both bounced back on Tuesday repairing part of Monday's big losses. The Retail Index ($RLX +1.24%) notched a modest gain. The Semiconductor Index ($SOX +3.03%) led the tech sector higher while the Networking Index ($NWX +2.28%) and Biotech Index ($BTK +1.01%) followed with smaller gains. Commodity-linked groups had a positive bias as the Gold & Silver Index ($XAU +0.99%), Oil Services Index ($OSX +0.68%), and Integrated Oil Index ($XOI +0.99%) each posted gains.
PICTURED: The Integrated Oil Index ($XOI +0.99%) posted again today but remains below its 50-day and 200-day moving average (DMA) lines after a 6-day slump which also undercut its December 2022 low.
| Oil Services |
$OSX |
79.18 |
+0.54 |
+0.68% |
-5.58% |
| Integrated Oil |
$XOI |
1,688.43 |
+16.49 |
+0.99% |
-5.53% |
| Semiconductor |
$SOX |
3,010.15 |
+88.44 |
+3.03% |
+18.88% |
| Networking |
$NWX |
820.40 |
+18.30 |
+2.28% |
+4.74% |
| Broker/Dealer |
$XBD |
450.28 |
+13.27 |
+3.04% |
+0.26% |
| Retail |
$RLX |
2,827.24 |
+34.57 |
+1.24% |
+2.66% |
| Gold & Silver |
$XAU |
119.11 |
+1.16 |
+0.99% |
-1.45% |
| Bank |
$BKX |
84.07 |
+2.60 |
+3.20% |
-16.64% |
| Biotech |
$BTK |
5,208.12 |
+52.24 |
+1.01% |
-1.38% |
|
|
|
 |
Featured Stocks
Kenneth J. Gruneisen - Passed the CAN SLIM® Master's Exam
|
|
|
Color Codes Explained :
Y - Better candidates highlighted by our
staff of experts.
G - Previously featured
in past reports as yellow but may no longer be buyable under the
guidelines.
***Last / Change / Volume data in this table is the closing quote data***
Symbol/Exchange
Company Name
Industry Group |
PRICE |
CHANGE
(%Change) |
Day High |
Volume
(% DAV)
(% 50 day avg vol) |
52 Wk Hi
% From Hi |
Featured
Date |
Price
Featured |
Pivot Featured |
|
Max Buy |
 GPK
-
NYSE
GPK
-
NYSE
Graphic Packaging Hldg
CONSUMER NON-DURABLES - Packaging and Containers
|
$23.97
|
+0.77
3.32% |
$24.20
|
2,691,299
83.68% of 50 DAV
50 DAV is 3,216,000
|
$25.17
-4.77%
|
10/25/2022
|
$22.75
|
PP = $24.17
|
|
MB = $25.38
|
 Most Recent Note - 3/14/2023 1:17:41 PM
Y - Posting a gain today and rebounding near the noted pivot point after a pullback of 4 consecutive losses tested support at its 50 DMA line ($23.30). Broader market weakness (M criteria) has been noted as a "correction" that has raised concerns.
>>> FEATURED STOCK ARTICLE : Quietly Lingering Near High With Strong Fundamentals - 2/27/2023 |
View all notes |
Set NEW NOTE alert |
Company Profile |
SEC
News |
Chart |
Request a new note
C
A
S
I |
TITN
-
NASDAQ
Titan Machinery Inc
SPECIALTY RETAIL
|
$41.98
|
+1.59
3.94% |
$43.11
|
311,250
135.33% of 50 DAV
50 DAV is 230,000
|
$47.87
-12.30%
|
1/13/2023
|
$40.10
|
PP = $44.45
|
|
MB = $46.67
|
Most Recent Note - 3/14/2023 1:05:54 PM
G - Today's gain has it rebounding near its 50 DMA line ($43.42) which may act as resistance after damaging volume-driven losses. Only a prompt rebound above the 50 DMA line would help its outlook improve.
>>> FEATURED STOCK ARTICLE : Pulled Back from New All-Time High - 2/28/2023 |
View all notes |
Set NEW NOTE alert |
Company Profile |
SEC
News |
Chart |
Request a new note
C
A
S
I |
STRL
-
NASDAQ
Sterling Infrastructure
MATERIALS and; CONSTRUCTION - Heavy Construction
|
$39.22
|
+1.35
3.56% |
$39.99
|
322,456
112.35% of 50 DAV
50 DAV is 287,000
|
$42.00
-6.62%
|
12/14/2022
|
$32.41
|
PP = $33.72
|
|
MB = $35.41
|
Most Recent Note - 3/14/2023 1:07:19 PM
G - Posting a solid gain today after slumping from its all-time high with 4 consecutive losses. It remains very extended from the previously noted base. Its 50 DMA line ($36.06) and prior highs in the $34-33 area define important near-term support to watch.
>>> FEATURED STOCK ARTICLE : Sterling Perched Near High, Extended From Prior Base - 2/24/2023 |
View all notes |
Set NEW NOTE alert |
Company Profile |
SEC
News |
Chart |
Request a new note
C
A
S
I |
PERI
-
NASDAQ
Perion Networks Ltd
Comml Svcs-Advertising
|
$34.89
|
+1.36
4.06% |
$35.42
|
436,350
58.41% of 50 DAV
50 DAV is 747,000
|
$37.18
-6.16%
|
1/25/2023
|
$31.79
|
PP = $33.19
|
|
MB = $34.85
|
Most Recent Note - 3/14/2023 1:23:13 PM
Y - Posting a big gain today with below average volume following a streak of 4 consecutive losses with below average volume. Consolidating above its 50 DMA line ($32.11) which defines important near term support above the prior high ($33).
>>> FEATURED STOCK ARTICLE : Perion Stubbornly Holding Ground Near High After Spurt of Gains - 2/22/2023 |
View all notes |
Set NEW NOTE alert |
Company Profile |
SEC
News |
Chart |
Request a new note
C
A
S
I |
ALGM
-
NASDAQ
Allegro Microsystems Inc
Elec-Semiconductor Mfg
|
$45.16
|
+1.87
4.32% |
$45.72
|
1,689,250
109.91% of 50 DAV
50 DAV is 1,537,000
|
$47.67
-5.27%
|
1/31/2023
|
$37.80
|
PP = $38.38
|
|
MB = $40.30
|
Most Recent Note - 3/14/2023 1:09:51 PM
G - Posting a solid gain today after another noted "negative reversal" and 3 volume-driven losses from its all-time high. It is extended from the previously noted base. Its 50 DMA line ($39) and prior high in the $38 area define important support to watch on pullbacks.
>>> FEATURED STOCK ARTICLE : Holding its Ground After Rallying From Previously Noted Base - 3/1/2023 |
View all notes |
Set NEW NOTE alert |
Company Profile |
SEC
News |
Chart |
Request a new note
C
A
S
I |
Symbol/Exchange
Company Name
Industry Group |
PRICE |
CHANGE
(%Change) |
Day High |
Volume
(% DAV)
(% 50 day avg vol) |
52 Wk Hi
% From Hi |
Featured
Date |
Price
Featured |
Pivot Featured |
|
Max Buy |
WCC
-
NYSE
Wesco International Inc
WHOLESALE - Electronics Wholesale
|
$155.26
|
+3.55
2.34% |
$159.93
|
512,082
105.37% of 50 DAV
50 DAV is 486,000
|
$175.00
-11.28%
|
2/10/2023
|
$148.50
|
PP = $147.15
|
|
MB = $154.51
|
Most Recent Note - 3/14/2023 1:24:22 PM
G - Finding support with today's gain after abruptly retreating and testing support at its 50 DMA line ($150.71). Prior highs in the $144-147 area define the next important support to watch. Reported Dec '22 quarterly earnings +40% on +15% sales revenues versus the year ago period. Broader market weakness (M criteria) has been noted as a "correction" that has raised concerns.
>>> FEATURED STOCK ARTICLE : Wesco Hovering Near All-Time High After Recent Breakout - 3/9/2023 |
View all notes |
Set NEW NOTE alert |
Company Profile |
SEC
News |
Chart |
Request a new note
C
A
S
I |
FIX
-
NYSE
Comfort Systems U S A
MATERIALS and CONSTRUCTION - General Contractors
|
$140.59
|
+3.59
2.62% |
$141.94
|
332,156
142.56% of 50 DAV
50 DAV is 233,000
|
$152.13
-7.59%
|
2/23/2023
|
$136.52
|
PP = $128.78
|
|
MB = $135.22
|
Most Recent Note - 3/14/2023 1:14:47 PM
G - Halting its slide with today's gain after slumping from its all-time high with 6 consecutive losses. It still is extended from the previously noted base. Prior highs in the $128 area define initial support to watch above its 50 DMA line ($126.81).
>>> FEATURED STOCK ARTICLE : Powerful Technical Breakout After Earnings Report - 2/23/2023 |
View all notes |
Set NEW NOTE alert |
Company Profile |
SEC
News |
Chart |
Request a new note
C
A
S
I |
KOF
-
NYSE
Coca Cola Femsa Sab Ads
FOOD and BEVERAGE - Beverages - Soft Drinks
|
$75.55
|
+1.00
1.34% |
$76.78
|
209,607
122.58% of 50 DAV
50 DAV is 171,000
|
$79.16
-4.56%
|
3/7/2023
|
$76.63
|
PP = $77.11
|
|
MB = $80.97
|
Most Recent Note - 3/14/2023 1:19:27 PM
Y - Still perched near its 52-week high after 3 losses with near average volume. Highlighted in yellow with pivot point cited based on its 1/24/23 high plus 10 cents in the 3/07/23 mid-day report. Gains above the pivot point must be backed by at least +40% above average volume to trigger a proper technical buy signal.
>>> FEATURED STOCK ARTICLE : Mexican Coke Bottler Hits New Multi-Year High - 3/7/2023 |
View all notes |
Set NEW NOTE alert |
Company Profile |
SEC
News |
Chart |
Request a new note
C
A
S
I |
ANET
-
NYSE
Arista Networks Inc
Computer-Networking
|
$153.15
|
+6.28
4.28% |
$153.25
|
3,212,482
136.82% of 50 DAV
50 DAV is 2,348,000
|
$152.07
0.71%
|
3/8/2023
|
$147.59
|
PP = $148.67
|
|
MB = $156.10
|
Most Recent Note - 3/14/2023 1:12:07 PM
Y - Hitting a new all-time high today, adding to recent volume-driven gains. Highlighted in yellow in the 3/08/23 mid-day report with pivot point cited based on its 12/27/21 high plus 10 cents. A gain and strong close above the pivot point backed by at least +40% above average volume may trigger a proper technical buy signal. Fundamentals remain strong after it reported Dec '22 quarterly earnings +72% on +55% sales revenues versus the year ago period. Broader market weakness (M criteria) has been noted as a "correction" that has raised concerns.
>>> FEATURED STOCK ARTICLE : Arista Challenging All-Time High - 3/8/2023 |
View all notes |
Set NEW NOTE alert |
Company Profile |
SEC
News |
Chart |
Request a new note
C
A
S
I |
CLH
-
NYSE
Clean Harbors Inc
Pollution Control
|
$136.40
|
+6.24
4.79% |
$137.01
|
644,910
180.14% of 50 DAV
50 DAV is 358,000
|
$140.69
-3.05%
|
3/10/2023
|
$136.89
|
PP = $136.74
|
|
MB = $143.58
|
Most Recent Note - 3/14/2023 1:13:28 PM
Y - Posting a solid gain today following 3 consecutive volume-driven losses after a "negative reversal" on 3/09/23 at an all-time high. Fundamentals remain strong. Its 50 DMA line ($128.65) defines important near-term support to watch.
>>> FEATURED STOCK ARTICLE : Pullback to Support Marked Secondary Buy Point; Market Concerns Rose - 3/10/2023 |
View all notes |
Set NEW NOTE alert |
Company Profile |
SEC
News |
Chart |
Request a new note
C
A
S
I |
Symbol/Exchange
Company Name
Industry Group |
PRICE |
CHANGE
(%Change) |
Day High |
Volume
(% DAV)
(% 50 day avg vol) |
52 Wk Hi
% From Hi |
Featured
Date |
Price
Featured |
Pivot Featured |
|
Max Buy |
|
|
|
THESE ARE NOT BUY RECOMMENDATIONS!
Comments contained in the body of this report are technical
opinions only. The material herein has been obtained
from sources believed to be reliable and accurate, however,
its accuracy and completeness cannot be guaranteed.
This site is not an investment advisor, hence it does
not endorse or recommend any securities or other investments.
Any recommendation contained in this report may not
be suitable for all investors and it is not to be deemed
an offer or solicitation on our part with respect to
the purchase or sale of any securities. All trademarks,
service marks and trade names appearing in this report
are the property of their respective owners, and are
likewise used for identification purposes only.
This report is a service available
only to active Paid Premium Members.
You may opt-out of receiving report notifications
at any time. Questions or comments may be submitted
by writing to Premium Membership Services 665 S.E. 10 Street, Suite 201 Deerfield Beach, FL 33441-5634 or by calling 1-800-965-8307
or 954-785-1121.
|
|
|