You are not logged in.
This means you
CAN ONLY VIEW reports that were published prior to Thursday, April 17, 2025.
You
MUST UPGRADE YOUR MEMBERSHIP if you want to see any current reports.
AFTER MARKET UPDATE - THURSDAY, MARCH 16TH, 2023
Previous After Market Report Next After Market Report >>>
|
|
|
|
DOW |
+371.98 |
32,246.55 |
+1.17% |
|
Volume |
1,262,087,933 |
-14% |
|
Volume |
5,442,468,200 |
-7% |
|
NASDAQ |
+283.22 |
11,717.28 |
+2.48% |
|
Advancers |
2,203 |
76% |
|
Advancers |
2,919 |
66% |
|
S&P 500 |
+68.35 |
3,960.28 |
+1.76% |
|
Decliners |
702 |
24% |
|
Decliners |
1,531 |
34% |
|
Russell 2000 |
+25.29 |
1,771.24 |
+1.45% |
|
52 Wk Highs |
16 |
|
|
52 Wk Highs |
54 |
|
|
S&P 600 |
+18.97 |
1,166.07 |
+1.65% |
|
52 Wk Lows |
177 |
|
|
52 Wk Lows |
284 |
|
|
Damaging losses last Thursday and Friday signaled a shift from the prior market uptrend (M criteria) to an uptrend under pressure and then quickly to a "market correction". Disciplined investors know to reduce market exposure by selling any weakening stocks on a case-by-case basis.
|
 |
Major Averages Rose With Lighter Volume Totals Behind Gains
Kenneth J. Gruneisen - Passed the CAN SLIM® Master's Exam
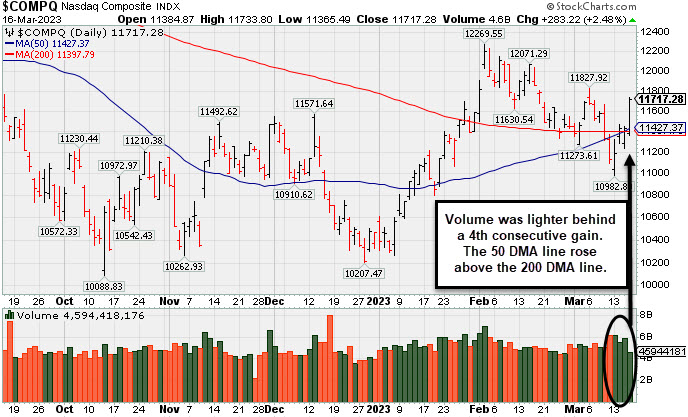
The Dow added 371 points (1.2%), while the technology heavy Nasdaq Composite gained 2.5%. The S&P 500 increased 1.8%. Volume totals were lighter than the prior session on the NYSE and on the Nasdaq exchange, indicating lackluster buying demand coming from the institutional crowd. Breadth was clearly positive as advancers led decliners by more than a 3-1 margin on the NYSE and by nearly 2-1 on the Nasdaq exchange. There were 9 high-ranked companies from the Leaders List that hit a new 52-week high and were listed on the BreakOuts Page, versus 4 on the prior session. New 52-week lows totals contracted yet still soldly outnumbered new 52-week highs on the NYSE and on the Nasdaq exchange. The evaporation of leadership and damaging losses late last week abruptly signaled that the major indices are in a market correction (M criteria). Disciplined investors know that in a market correction it is best to avoid new buying efforts and raise safe cash.
PICTURED: The Nasdaq Composite Index posted a 4th consecutive gain backed by lighter volume. The gain helped it rebound well above its 50-day and 200-day moving average (DMA) lines. Those important moving averages just converged, a bullish technical signal termed a "golden cross". The December and October lows define the next important chart support levels to watch as the market correction continues. Disciplined investors are watching for a solid follow-through day to confirm a new uptrend. Friday marks Day 5 of the rally attempt for the tech-heavy Nasdaq.
Nine of the eleven sectors finished in positive territory as U.S. equities closed higher Thursday. Multiple U.S. banks announced their consideration to assist First Republic Bank (FRC +9.98%) by depositing approximately $30 billion as a group. Further boosting markets today was the announcement from Credit Suisse Group (CS +0%) on securing a $54 billion loan from Swiss National Bank to assure short-term liquidity.
On the data front, initial jobless claims for the week ended March 11 declined from the prior week’s upwardly revised 212,000 to 192,000; as well as a decline in continuing claims for the week ended March 4 with 29,000 less claims. Meanwhile, housing starts and building permits grew more than expected with 9.8% and 13.8% growth versus the 0.1% and 0.3% expected.
Treasuries weakened as bond volatility surges to levels not seen since the 2008 Financial Crisis amid limited liquidity. The yield on the benchmark 10-year note increased 11 basis points (0.11%) to 3.57% while the 30-year bond yield added six basis points (0.06%) to 3.71%. The yield on the two-year note, which is more sensitive to changes in monetary policy, gained 24 basis points (0.24%) to 4.16%. In commodities, West Texas Intermediate (WTI) crude increased 0.7% to $68.10/barrel after oil dropped to a 15-month low during intraday trading Thursday. Elsewhere, the Organization of the Petroleum Exporting Counties (OPEC) and the International Energy Agency (IEA) have forecasted stronger oil demand this week; however, oversupply concerns continue to mount in the global market.
|
 Kenneth J. Gruneisen started out as a licensed stockbroker in August 1987, a couple of months prior to the historic stock market crash that took the Dow Jones Industrial Average down -22.6% in a single day. He has published daily fact-based fundamental and technical analysis on high-ranked stocks online for two decades. Through FACTBASEDINVESTING.COM, Kenneth provides educational articles, news, market commentary, and other information regarding proven investment systems that work in good times and bad.
Comments contained in the body of this report are technical opinions only and are not necessarily those of Gruneisen Growth Corp. The material herein has been obtained from sources believed to be reliable and accurate, however, its accuracy and completeness cannot be guaranteed. Our firm, employees, and customers may effect transactions, including transactions contrary to any recommendation herein, or have positions in the securities mentioned herein or options with respect thereto. Any recommendation contained in this report may not be suitable for all investors and it is not to be deemed an offer or solicitation on our part with respect to the purchase or sale of any securities. |
|
 |
Financial, Retail, Tech, and Energy-Linked Groups Rose
Kenneth J. Gruneisen - Passed the CAN SLIM® Master's Exam
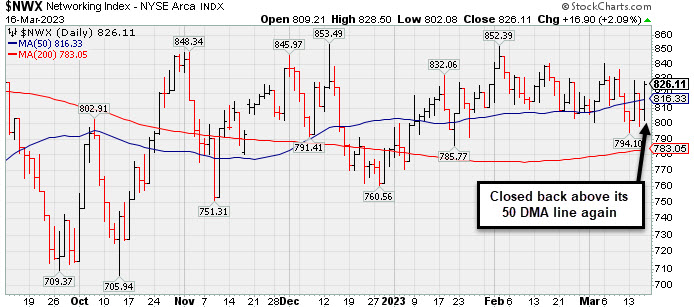
The Broker/Dealer Index ($XBD +2.40%), Bank Index ($BKX +2.57%), and Retail Index ($RLX +1.96%) each posted solid gains. The Semiconductor Index ($SOX +4.05%) led the tech sector higher while the Networking Index ($NWX +2.09%) and Biotech Index ($BTK +0.84%) both posted smaller gains. The Oil Services Index ($OSX +1.13%) and Integrated Oil Index ($XOI +1.45%) both posted gains while the Gold & Silver Index ($XAU -0.34%) ended the session slightly lower.
PICTURED: The Networking Index ($NWX +2.09%) posted a gain and closed back above its 50-day moving average (DMA) line.
| Oil Services |
$OSX |
74.65 |
+0.83 |
+1.13% |
-10.98% |
| Integrated Oil |
$XOI |
1,616.63 |
+23.14 |
+1.45% |
-9.55% |
| Semiconductor |
$SOX |
3,098.07 |
+120.68 |
+4.05% |
+22.35% |
| Networking |
$NWX |
826.11 |
+16.90 |
+2.09% |
+5.46% |
| Broker/Dealer |
$XBD |
453.13 |
+10.64 |
+2.40% |
+0.89% |
| Retail |
$RLX |
2,905.21 |
+55.72 |
+1.96% |
+5.49% |
| Gold & Silver |
$XAU |
118.16 |
-0.40 |
-0.34% |
-2.24% |
| Bank |
$BKX |
83.17 |
+2.09 |
+2.57% |
-17.53% |
| Biotech |
$BTK |
5,218.83 |
+43.40 |
+0.84% |
-1.18% |
|
|
|
 |
Consolidating Above Support at Prior High and 50-Day Moving Average
Kenneth J. Gruneisen - Passed the CAN SLIM® Master's Exam
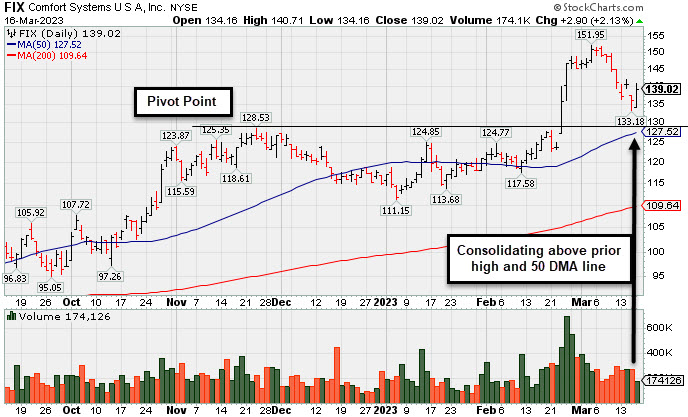
Comfort Systems U S A (FIX +$2.90 or +2.13% to $139.02) is consolidating above prior highs in the $128 area its 50-day moving average (DMA) line ($127.52) which define important near-term support to watch. Broader market weakness (M criteria) has been noted as a "correction" that has raised concerns.
FIX was highlighted in yellow in the 2/23/23 mid-day report (read here) with a pivot point cited based on its 11/23/22 high plus 10 cents. It broke out hitting a new 52-week high (N criteria) with volume +131% above average behind the gain, triggering a technical buy signal while rising from an orderly 3-month base. It was shown in greater detail that evening with an annotated graph under the headline, "Powerful Technical Breakout After Earnings Report". The bullish action came after it reported earnings +48% on +31% sales revenues for the Dec '22 quarter versus the year ago period, its 4th strong quarter above the +25% minimum guideline (C criteria). Annual earning history has been strong and steady.
It hails from the Building - A/C & Heating Products group which is currently ranked 32nd on the 197 Industry Groups list. It has a small supply of only 35.7 million shares outstanding (S criteria) which can contribute to greater price volatility in the event of institutional buying or selling. The number of top-rated funds that own its shares rose from 487 in Jun '22 to 550 in Dec '22, a reassuring sign regarding the I criteria. Its current Up/Down Volume Ratio is 2.0, an unbiased indication its shares have been under acumulation over the past 50 days.
|
|
|
Color Codes Explained :
Y - Better candidates highlighted by our
staff of experts.
G - Previously featured
in past reports as yellow but may no longer be buyable under the
guidelines.
***Last / Change / Volume data in this table is the closing quote data***
Symbol/Exchange
Company Name
Industry Group |
PRICE |
CHANGE
(%Change) |
Day High |
Volume
(% DAV)
(% 50 day avg vol) |
52 Wk Hi
% From Hi |
Featured
Date |
Price
Featured |
Pivot Featured |
|
Max Buy |
 GPK
-
NYSE
GPK
-
NYSE
Graphic Packaging Hldg
CONSUMER NON-DURABLES - Packaging and Containers
|
$23.65
|
+0.23
0.98% |
$23.76
|
2,216,977
67.26% of 50 DAV
50 DAV is 3,296,000
|
$25.17
-6.04%
|
10/25/2022
|
$22.75
|
PP = $24.17
|
|
MB = $25.38
|
Most Recent Note - 3/15/2023 5:46:25 PM
Y - Sputtering below the noted pivot point and testing support at its 50 DMA line ($23.32) with today's volume-driven loss. More damaging losses would raise greater concerns and trigger a technical sell signal. Broader market weakness (M criteria) has been noted as a "correction" that has raised concerns.
>>> FEATURED STOCK ARTICLE : Quietly Lingering Near High With Strong Fundamentals - 2/27/2023 |
View all notes |
Set NEW NOTE alert |
Company Profile |
SEC
News |
Chart |
Request a new note
C
A
S
I |
STRL
-
NASDAQ
Sterling Infrastructure
MATERIALS and; CONSTRUCTION - Heavy Construction
|
$37.97
|
+0.18
0.48% |
$38.80
|
199,832
67.74% of 50 DAV
50 DAV is 295,000
|
$42.00
-9.60%
|
12/14/2022
|
$32.41
|
PP = $33.72
|
|
MB = $35.41
|
Most Recent Note - 3/15/2023 12:48:30 PM
G - Abruptly slumping further from its all-time high with today's big loss. Its 50 DMA line ($36.13) and prior highs in the $34-33 area define important near-term support to watch.
>>> FEATURED STOCK ARTICLE : Sterling Perched Near High, Extended From Prior Base - 2/24/2023 |
View all notes |
Set NEW NOTE alert |
Company Profile |
SEC
News |
Chart |
Request a new note
C
A
S
I |
PERI
-
NASDAQ
Perion Networks Ltd
Comml Svcs-Advertising
|
$35.46
|
+1.05
3.05% |
$35.90
|
642,895
84.48% of 50 DAV
50 DAV is 761,000
|
$37.18
-4.63%
|
1/25/2023
|
$31.79
|
PP = $33.19
|
|
MB = $34.85
|
Most Recent Note - 3/15/2023 5:42:23 PM
Y - A spurt of losses has been backed by below average volume while consolidating above its 50 DMA line ($32.28) and the prior high ($33) which define important near-term support. See the latest FSU analysis for more details and a new annotated graph.
>>> FEATURED STOCK ARTICLE : Consolidating in an Orderly Manner Above Old High and 50 DMA Line - 3/15/2023 |
View all notes |
Set NEW NOTE alert |
Company Profile |
SEC
News |
Chart |
Request a new note
C
A
S
I |
ALGM
-
NASDAQ
Allegro Microsystems Inc
Elec-Semiconductor Mfg
|
$46.03
|
+1.56
3.51% |
$46.31
|
1,655,660
105.19% of 50 DAV
50 DAV is 1,574,000
|
$47.67
-3.44%
|
1/31/2023
|
$37.80
|
PP = $38.38
|
|
MB = $40.30
|
Most Recent Note - 3/14/2023 1:09:51 PM
G - Posting a solid gain today after another noted "negative reversal" and 3 volume-driven losses from its all-time high. It is extended from the previously noted base. Its 50 DMA line ($39) and prior high in the $38 area define important support to watch on pullbacks.
>>> FEATURED STOCK ARTICLE : Holding its Ground After Rallying From Previously Noted Base - 3/1/2023 |
View all notes |
Set NEW NOTE alert |
Company Profile |
SEC
News |
Chart |
Request a new note
C
A
S
I |
FIX
-
NYSE
Comfort Systems U S A
MATERIALS and CONSTRUCTION - General Contractors
|
$139.02
|
+2.90
2.13% |
$140.71
|
174,078
73.14% of 50 DAV
50 DAV is 238,000
|
$152.13
-8.62%
|
2/23/2023
|
$136.52
|
PP = $128.78
|
|
MB = $135.22
|
 Most Recent Note - 3/16/2023 6:02:54 PM
G - Consolidating above the prior high in the $128 area and its 50 DMA line ($127.65) defining important support to watch. Fundamentals remain strong. See the latest FSU analysis for more details and a new annotated graph.
>>> FEATURED STOCK ARTICLE : Consolidating Above Support at Prior High and 50-Day Moving Average - 3/16/2023 |
View all notes |
Set NEW NOTE alert |
Company Profile |
SEC
News |
Chart |
Request a new note
C
A
S
I |
Symbol/Exchange
Company Name
Industry Group |
PRICE |
CHANGE
(%Change) |
Day High |
Volume
(% DAV)
(% 50 day avg vol) |
52 Wk Hi
% From Hi |
Featured
Date |
Price
Featured |
Pivot Featured |
|
Max Buy |
KOF
-
NYSE
Coca Cola Femsa Sab Ads
FOOD and BEVERAGE - Beverages - Soft Drinks
|
$75.58
|
+0.49
0.65% |
$75.68
|
84,286
48.44% of 50 DAV
50 DAV is 174,000
|
$79.16
-4.52%
|
3/7/2023
|
$76.63
|
PP = $77.11
|
|
MB = $80.97
|
Most Recent Note - 3/14/2023 1:19:27 PM
Y - Still perched near its 52-week high after 3 losses with near average volume. Highlighted in yellow with pivot point cited based on its 1/24/23 high plus 10 cents in the 3/07/23 mid-day report. Gains above the pivot point must be backed by at least +40% above average volume to trigger a proper technical buy signal.
>>> FEATURED STOCK ARTICLE : Mexican Coke Bottler Hits New Multi-Year High - 3/7/2023 |
View all notes |
Set NEW NOTE alert |
Company Profile |
SEC
News |
Chart |
Request a new note
C
A
S
I |
ANET
-
NYSE
Arista Networks Inc
Computer-Networking
|
$162.68
|
+8.88
5.77% |
$164.26
|
5,136,937
211.31% of 50 DAV
50 DAV is 2,431,000
|
$154.02
5.62%
|
3/8/2023
|
$147.59
|
PP = $148.67
|
|
MB = $156.10
|
Most Recent Note - 3/16/2023 12:25:06 PM
Y - Powering into new all-time high territory with today's big gain adding to recent volume-driven gains. Highlighted in yellow in the 3/08/23 mid-day report with pivot point cited based on its 12/27/21 high plus 10 cents. Fundamentals remain strong after it reported Dec '22 quarterly earnings +72% on +55% sales revenues versus the year-ago period. Broader market weakness (M criteria) has been noted as a "correction" that has raised concerns.
>>> FEATURED STOCK ARTICLE : Arista Challenging All-Time High - 3/8/2023 |
View all notes |
Set NEW NOTE alert |
Company Profile |
SEC
News |
Chart |
Request a new note
C
A
S
I |
CLH
-
NYSE
Clean Harbors Inc
Pollution Control
|
$135.98
|
+2.91
2.19% |
$136.44
|
392,603
103.05% of 50 DAV
50 DAV is 381,000
|
$140.69
-3.35%
|
3/10/2023
|
$136.89
|
PP = $136.74
|
|
MB = $143.58
|
Most Recent Note - 3/15/2023 5:44:31 PM
Y - Suffered another volume-driven loss today, slumping after a noted "negative reversal" on 3/09/23 at an all-time high. Fundamentals remain strong. Its 50 DMA line ($129) defines important near-term support to watch.
>>> FEATURED STOCK ARTICLE : Pullback to Support Marked Secondary Buy Point; Market Concerns Rose - 3/10/2023 |
View all notes |
Set NEW NOTE alert |
Company Profile |
SEC
News |
Chart |
Request a new note
C
A
S
I |
|
|
|
THESE ARE NOT BUY RECOMMENDATIONS!
Comments contained in the body of this report are technical
opinions only. The material herein has been obtained
from sources believed to be reliable and accurate, however,
its accuracy and completeness cannot be guaranteed.
This site is not an investment advisor, hence it does
not endorse or recommend any securities or other investments.
Any recommendation contained in this report may not
be suitable for all investors and it is not to be deemed
an offer or solicitation on our part with respect to
the purchase or sale of any securities. All trademarks,
service marks and trade names appearing in this report
are the property of their respective owners, and are
likewise used for identification purposes only.
This report is a service available
only to active Paid Premium Members.
You may opt-out of receiving report notifications
at any time. Questions or comments may be submitted
by writing to Premium Membership Services 665 S.E. 10 Street, Suite 201 Deerfield Beach, FL 33441-5634 or by calling 1-800-965-8307
or 954-785-1121.
|
|
|