You are not logged in.
This means you
CAN ONLY VIEW reports that were published prior to Thursday, April 17, 2025.
You
MUST UPGRADE YOUR MEMBERSHIP if you want to see any current reports.
AFTER MARKET UPDATE - WEDNESDAY, MARCH 8TH, 2023
Previous After Market Report Next After Market Report >>>
|
|
|
|
DOW |
-58.06 |
32,798.40 |
-0.18% |
|
Volume |
791,030,010 |
-11% |
|
Volume |
5,105,797,500 |
-5% |
|
NASDAQ |
+45.67 |
11,576.00 |
+0.40% |
|
Advancers |
1,516 |
52% |
|
Advancers |
2,173 |
49% |
|
S&P 500 |
+5.64 |
3,992.01 |
+0.14% |
|
Decliners |
1,392 |
48% |
|
Decliners |
2,286 |
51% |
|
Russell 2000 |
-3.34 |
1,875.38 |
-0.18% |
|
52 Wk Highs |
45 |
|
|
52 Wk Highs |
63 |
|
|
S&P 600 |
-3.80 |
1,224.90 |
-0.31% |
|
52 Wk Lows |
56 |
|
|
52 Wk Lows |
195 |
|
|
 |
Major Indices Indecisive on Mixed Session
Kenneth J. Gruneisen - Passed the CAN SLIM® Master's Exam
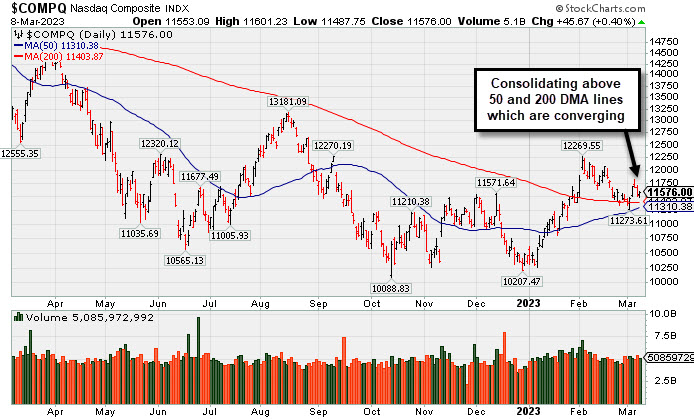
The Dow lost 58 points (-0.2%), while the technology heavy Nasdaq Composite increased 0.4%. The S&P 500 gained 0.1%. Volume totals were mixed, lighter than the prior session on the NYSE and higher on the Nasdaq exchange. Breadth was fairly even as advancers narrowly led decliners on the NYSE and decliners narrowly led advancers on the Nasdaq exchange. There were 19 high-ranked companies from the Leaders List that hit new 52-week highs and were listed on the BreakOuts Page, versus 15 on the prior session. New 52-week lows outnumbered new 52-week highs on the NYSE and on the Nasdaq exchange. The major indices are in a confirmed uptrend (M criteria). For any rally to be sustained there must be healthy leadership. It will be important to watch for the new highs totals to improve in the immediate days ahead. Stay tuned!
PICTURED: The Nasdaq Composite Index is consolidating above its 50-day and 200-day moving average (DMA) lines which are converging.
Seven of the eleven sectors finished in positive territory as U.S. equities finished mixed Wednesday. Federal Reserve (Fed) Chair Jerome Powell wrapped up his second day before Congress. During his two days of hawkish rhetoric, markets resumed their sell-off and further inverted the Treasury yield curve. Powell reiterated before the House Financial Services Committee that the central bank will continue to monitor incoming data as they head into their next meeting on March 22 and will reassess how much further interest rates will need to climb to tackle the persistently high inflation.
On the data front, MBA Mortgage Applications jumped 7.4% in the week ended March 3 after declining 5.7% in the prior week. Today’s jump in applications was the first time the reading has risen since February 3 amid the average 30-year fixed rate mortgage increasing. Meanwhile, January’s Job Opening and Labor Turnover Survey fell less than expected as the labor market remains resilient.
Treasuries were mixed, with the yield on the benchmark 10-year note adding one basis point (0.01%) to 3.98% while the 30-year bond yield remains unchanged at 3.88%. The yield on the two-year note increased five basis points (0.05%) to 5.06%. In commodities, West Texas Intermediate (WTI) crude dropped 1.4% to $76.47/barrel as Powell returned to Capitol Hill. Meanwhile, oil ministers continued to debate supply tightness following Russia’s 500,000 barrel per day cut.
|
 Kenneth J. Gruneisen started out as a licensed stockbroker in August 1987, a couple of months prior to the historic stock market crash that took the Dow Jones Industrial Average down -22.6% in a single day. He has published daily fact-based fundamental and technical analysis on high-ranked stocks online for two decades. Through FACTBASEDINVESTING.COM, Kenneth provides educational articles, news, market commentary, and other information regarding proven investment systems that work in good times and bad.
Comments contained in the body of this report are technical opinions only and are not necessarily those of Gruneisen Growth Corp. The material herein has been obtained from sources believed to be reliable and accurate, however, its accuracy and completeness cannot be guaranteed. Our firm, employees, and customers may effect transactions, including transactions contrary to any recommendation herein, or have positions in the securities mentioned herein or options with respect thereto. Any recommendation contained in this report may not be suitable for all investors and it is not to be deemed an offer or solicitation on our part with respect to the purchase or sale of any securities. |
|
 |
Semiconductor, Networking, and Broker/Dealer Indexes Posted Gains
Kenneth J. Gruneisen - Passed the CAN SLIM® Master's Exam
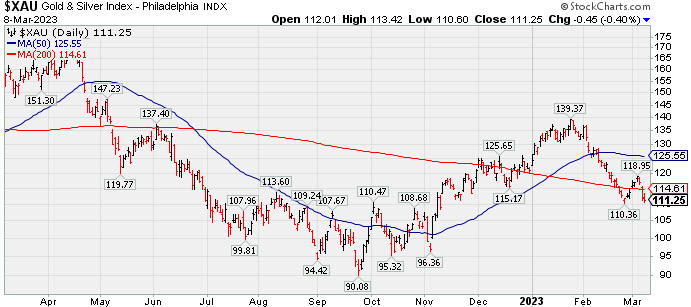
The Broker/Dealer Index ($XBD +0.55%) rose while the Bank Index ($BKX -0.76%) and Retail Index ($RLX -0.45%) both lost ground. The Semiconductor Index ($SOX +2.67%) and Networking Index ($NWX +1.61%) bothn posted solid gains while the Biotech Index ($BTK -0.80%) sputtered. Commodity-linked groups had a negative bias as the Oil Services Index ($OSX -1.48%) and Integrated Oil Index ($XOI -0.95%) outpaced the Gold & Silver Index ($XAU -0.40%) to the downside.
PICTURED: The Gold & Silver Index ($XAU -0.40%) is slumping below its 200-day moving average (DMA) line again.
| Oil Services |
$OSX |
87.98 |
-1.32 |
-1.48% |
+4.92% |
| Integrated Oil |
$XOI |
1,764.29 |
-16.87 |
-0.95% |
-1.28% |
| Semiconductor |
$SOX |
3,041.39 |
+78.97 |
+2.67% |
+20.11% |
| Networking |
$NWX |
829.31 |
+13.13 |
+1.61% |
+5.87% |
| Broker/Dealer |
$XBD |
492.82 |
+2.72 |
+0.55% |
+9.73% |
| Retail |
$RLX |
2,834.13 |
-12.77 |
-0.45% |
+2.91% |
| Gold & Silver |
$XAU |
111.25 |
-0.45 |
-0.40% |
-7.95% |
| Bank |
$BKX |
103.98 |
-0.80 |
-0.76% |
+3.10% |
| Biotech |
$BTK |
5,206.67 |
-41.83 |
-0.80% |
-1.41% |
|
|
|
 |
Arista Challenging All-Time High
Kenneth J. Gruneisen - Passed the CAN SLIM® Master's Exam
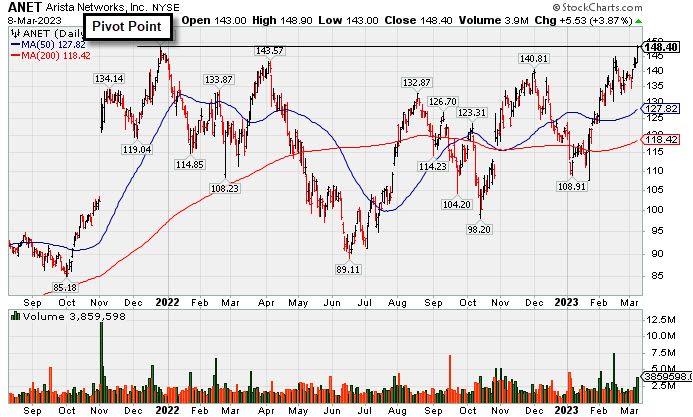
Arista Networks Inc (ANET +$5.53 or +3.87% to $148.40) was highlighted in yellow with pivot point cited based on its 12/27/21 high plus 10 cents in the earlier mid-day report (read here). Subsequent gains above the pivot point backed by at least +40% above average volume may trigger a technical buy signal. Fundamentals remain strong after it reported Dec '22 quarterly earnings +72% on +55% sales revenues versus the year ago period. It showed resilience since sputtering below its 200 DMA line after dropped from the Featured Stocks list on 12/22/22.
ANET currently has a 98 Earnings Per Share Rating. It reported Dec '22 quarterly earnings +72% on +55% sales revenues versus the year ago period, its 5th quarterly comparison strong and steady above the +25% minimum earnings guideline (C criteria). Annual earnings had a downturn in FY 20 like many during the pandemic. It was last shown in this FSU section on 11/14/22 with an annotated graph under the headline, "Finished in Middle of Intra-Day Range After Challenging Pivot Point".
The number of top-rated funds owning its shares rose from 1,758 in Dec '21 to 2,057 in Dec '22, a reassuring sign concerning the I criteria. Its current Up/Down Volume Ratio of 1.8 is an unbiased indication its shares have been under accumulation over the past 50 days. The high-ranked Computer - Networking firm has a Timeliness Rating of A and a Sponsorship Rating of C. Its small supply of 245.1 million shares (S criteria) in the public float may contribute to greater volatility in the event of institutional buying or selling.
|
|
|
Color Codes Explained :
Y - Better candidates highlighted by our
staff of experts.
G - Previously featured
in past reports as yellow but may no longer be buyable under the
guidelines.
***Last / Change / Volume data in this table is the closing quote data***
Symbol/Exchange
Company Name
Industry Group |
PRICE |
CHANGE
(%Change) |
Day High |
Volume
(% DAV)
(% 50 day avg vol) |
52 Wk Hi
% From Hi |
Featured
Date |
Price
Featured |
Pivot Featured |
|
Max Buy |
 CMC
-
NYSE
CMC
-
NYSE
Commercial Metals Co
METALS and MINING - Steel and Iron
|
$52.35
|
+0.76
1.47% |
$52.54
|
796,301
73.39% of 50 DAV
50 DAV is 1,085,000
|
$58.09
-9.88%
|
10/14/2022
|
$41.61
|
PP = $44.45
|
|
MB = $46.67
|
Most Recent Note - 3/6/2023 6:27:51 PM
G - Color code is changed to green after slumping back below its 50 DMA line ($53.15) with today's loss following 3 consecutive volume-driven gains. The recent low ($50.90 on 2/24/23) defines important near term support where any more damaging losses would raise greater concerns. Fundamentals remain strong. See the latest FSU analysis for more details and a new annotated grsph.
>>> FEATURED STOCK ARTICLE : Sputtering Below 50-Day Moving Average Line Again - 3/6/2023 |
View all notes |
Set NEW NOTE alert |
Company Profile |
SEC
News |
Chart |
Request a new note
C
A
S
I |
GPK
-
NYSE
Graphic Packaging Hldg
CONSUMER NON-DURABLES - Packaging and Containers
|
$24.94
|
-0.08
-0.32% |
$25.15
|
2,939,636
92.62% of 50 DAV
50 DAV is 3,174,000
|
$25.10
-0.64%
|
10/25/2022
|
$22.75
|
PP = $24.17
|
|
MB = $25.38
|
Most Recent Note - 3/7/2023 5:33:36 PM
Y - Closed in the upper third of its intra-day range today as it posted a solid gain, breaking into new all-time high territory with volume +37% above average. It has the look of a solid technical breakout, but members were previously reminded - "Disciplined investors know that gains above a stock's pivot point must be backed by at least +40% above average volume to trigger a proper technical buy signal."
>>> FEATURED STOCK ARTICLE : Quietly Lingering Near High With Strong Fundamentals - 2/27/2023 |
View all notes |
Set NEW NOTE alert |
Company Profile |
SEC
News |
Chart |
Request a new note
C
A
S
I |
TITN
-
NASDAQ
Titan Machinery Inc
SPECIALTY RETAIL
|
$46.70
|
-0.76
-1.60% |
$47.87
|
544,957
257.06% of 50 DAV
50 DAV is 212,000
|
$47.79
-2.28%
|
1/13/2023
|
$40.10
|
PP = $44.45
|
|
MB = $46.67
|
Most Recent Note - 3/7/2023 5:38:12 PM
G - Posted a gain today with light volume for a best-ever close. Its 50 DMA line ($42.98) definies important near-term support to watch on pullbacks.
>>> FEATURED STOCK ARTICLE : Pulled Back from New All-Time High - 2/28/2023 |
View all notes |
Set NEW NOTE alert |
Company Profile |
SEC
News |
Chart |
Request a new note
C
A
S
I |
STRL
-
NASDAQ
Sterling Infrastructure
MATERIALS and; CONSTRUCTION - Heavy Construction
|
$41.59
|
-0.22
-0.53% |
$42.00
|
218,462
78.87% of 50 DAV
50 DAV is 277,000
|
$41.99
-0.95%
|
12/14/2022
|
$32.41
|
PP = $33.72
|
|
MB = $35.41
|
Most Recent Note - 3/7/2023 5:36:33 PM
G - Hit another new all-time high today with a gain backed by +30% above average volume, getting more extended from the previously noted base. Its 50 DMA line ($35.33) and prior highs in the $34-33 area define important near-term support to watch on pullbacks.
>>> FEATURED STOCK ARTICLE : Sterling Perched Near High, Extended From Prior Base - 2/24/2023 |
View all notes |
Set NEW NOTE alert |
Company Profile |
SEC
News |
Chart |
Request a new note
C
A
S
I |
PERI
-
NASDAQ
Perion Networks Ltd
Comml Svcs-Advertising
|
$36.28
|
-0.07
-0.19% |
$37.02
|
555,786
78.17% of 50 DAV
50 DAV is 711,000
|
$37.18
-2.42%
|
1/25/2023
|
$31.79
|
PP = $33.19
|
|
MB = $34.85
|
Most Recent Note - 3/6/2023 12:15:10 PM
G - Posting a 4th consecutive gain today without very heavy volume, its color code is changed to green after rising above its "max buy" level and hitting a new 52-week high. Stubbornly held ground and showed resilience. Important suppport to watch is its 50 DMA line ($30.89) and recent low ($29.83 on 2/08/23).
>>> FEATURED STOCK ARTICLE : Perion Stubbornly Holding Ground Near High After Spurt of Gains - 2/22/2023 |
View all notes |
Set NEW NOTE alert |
Company Profile |
SEC
News |
Chart |
Request a new note
C
A
S
I |
Symbol/Exchange
Company Name
Industry Group |
PRICE |
CHANGE
(%Change) |
Day High |
Volume
(% DAV)
(% 50 day avg vol) |
52 Wk Hi
% From Hi |
Featured
Date |
Price
Featured |
Pivot Featured |
|
Max Buy |
ALGM
-
NASDAQ
Allegro Microsystems Inc
Elec-Semiconductor Mfg
|
$46.03
|
+0.78
1.72% |
$46.29
|
1,178,951
81.48% of 50 DAV
50 DAV is 1,447,000
|
$46.90
-1.86%
|
1/31/2023
|
$37.80
|
PP = $38.38
|
|
MB = $40.30
|
Most Recent Note - 3/6/2023 6:27:41 PM
G - There was a "negative reversal" today while churning higher volume after hitting a new all-time high. It is extended from the previously noted base. Prior high in the $38 area defines initial support to watch on pullbacks.
>>> FEATURED STOCK ARTICLE : Holding its Ground After Rallying From Previously Noted Base - 3/1/2023 |
View all notes |
Set NEW NOTE alert |
Company Profile |
SEC
News |
Chart |
Request a new note
C
A
S
I |
WCC
-
NYSE
Wesco International Inc
WHOLESALE - Electronics Wholesale
|
$172.26
|
+1.74
1.02% |
$172.47
|
343,473
74.83% of 50 DAV
50 DAV is 459,000
|
$175.00
-1.57%
|
2/10/2023
|
$148.50
|
PP = $147.15
|
|
MB = $154.51
|
 Most Recent Note - 3/8/2023 7:05:11 PM
G - Hovering near its all-time high, extended from the previously noted base. Prior highs in the $144-147 area define initial support to watch above its 50 DMA line ($147.82). Reported Dec '22 quarterly earnings +40% on +15% sales revenues versus the year ago period.
>>> FEATURED STOCK ARTICLE : Powered Higher After Recently Highlighted in Feb 10th Report - 2/21/2023 |
View all notes |
Set NEW NOTE alert |
Company Profile |
SEC
News |
Chart |
Request a new note
C
A
S
I |
FIX
-
NYSE
Comfort Systems U S A
MATERIALS and CONSTRUCTION - General Contractors
|
$148.82
|
-0.26
-0.17% |
$149.59
|
186,699
84.10% of 50 DAV
50 DAV is 222,000
|
$152.13
-2.18%
|
2/23/2023
|
$136.52
|
PP = $128.78
|
|
MB = $135.22
|
Most Recent Note - 3/8/2023 7:04:01 PM
G - Hovering near its all-time high holding its ground stubbornly after an impressive spurt higher, extended from the previously noted base. Prior highs in the $128 area define initial support to watch on pullbacks.
>>> FEATURED STOCK ARTICLE : Powerful Technical Breakout After Earnings Report - 2/23/2023 |
View all notes |
Set NEW NOTE alert |
Company Profile |
SEC
News |
Chart |
Request a new note
C
A
S
I |
KOF
-
NYSE
Coca Cola Femsa Sab Ads
FOOD and BEVERAGE - Beverages - Soft Drinks
|
$78.37
|
+1.96
2.57% |
$79.16
|
189,384
114.09% of 50 DAV
50 DAV is 166,000
|
$77.55
1.06%
|
3/7/2023
|
$76.63
|
PP = $77.11
|
|
MB = $80.97
|
Most Recent Note - 3/8/2023 7:02:12 PM
Y - Posted a 6th consecutive gain today with near average volume hitting a new 52-week high. Highlighted in yellow with pivot point cited based on its 1/24/23 high plus 10 cents in the 3/07/23 mid-day report. Gains above the pivot point must be backed by at least +40% above average volume to trigger a proper technical buy signal. Reported Jun, Sep and Dec '22 quarterly earnings increases above the +25% minimum guideline (C criteria) backed by strong sales revenues growth. Annal earnings had a downturn in FY '20 like many companies during the pandemic.
>>> FEATURED STOCK ARTICLE : Mexican Coke Bottler Hits New Multi-Year High - 3/7/2023 |
View all notes |
Set NEW NOTE alert |
Company Profile |
SEC
News |
Chart |
Request a new note
C
A
S
I |
ANET
-
NYSE
Arista Networks Inc
Computer-Networking
|
$148.40
|
+5.53
3.87% |
$148.90
|
3,859,756
177.62% of 50 DAV
50 DAV is 2,173,000
|
$145.17
2.22%
|
3/8/2023
|
$147.59
|
PP = $148.67
|
|
MB = $156.10
|
Most Recent Note - 3/8/2023 6:58:30 PM
Y - Posted a solid gain today with +77% above average volume and closed near the session high after highlighted in yellow in the earlier mid-day report with pivot point cited based on its 12/27/21 high plus 10 cents. Subsequent gains above the pivot point backed by at least +40% above average volume may trigger a technical buy signal. Fundamentals remain strong after it reported Dec '22 quarterly earnings +72% on +55% sales revenues versus the year ago period. Showed resilience since sputtering below its 200 DMA line after dropped from the Featured Stocks list on 12/22/22. See the latest FSU analysis for more details and a new annotated graph.
>>> FEATURED STOCK ARTICLE : Arista Challenging All-Time High - 3/8/2023 |
View all notes |
Set NEW NOTE alert |
Company Profile |
SEC
News |
Chart |
Request a new note
C
A
S
I |
Symbol/Exchange
Company Name
Industry Group |
PRICE |
CHANGE
(%Change) |
Day High |
Volume
(% DAV)
(% 50 day avg vol) |
52 Wk Hi
% From Hi |
Featured
Date |
Price
Featured |
Pivot Featured |
|
Max Buy |
|
|
|
THESE ARE NOT BUY RECOMMENDATIONS!
Comments contained in the body of this report are technical
opinions only. The material herein has been obtained
from sources believed to be reliable and accurate, however,
its accuracy and completeness cannot be guaranteed.
This site is not an investment advisor, hence it does
not endorse or recommend any securities or other investments.
Any recommendation contained in this report may not
be suitable for all investors and it is not to be deemed
an offer or solicitation on our part with respect to
the purchase or sale of any securities. All trademarks,
service marks and trade names appearing in this report
are the property of their respective owners, and are
likewise used for identification purposes only.
This report is a service available
only to active Paid Premium Members.
You may opt-out of receiving report notifications
at any time. Questions or comments may be submitted
by writing to Premium Membership Services 665 S.E. 10 Street, Suite 201 Deerfield Beach, FL 33441-5634 or by calling 1-800-965-8307
or 954-785-1121.
|
|
|