You are not logged in.
This means you
CAN ONLY VIEW reports that were published prior to Thursday, April 17, 2025.
You
MUST UPGRADE YOUR MEMBERSHIP if you want to see any current reports.
AFTER MARKET UPDATE - THURSDAY, MARCH 9TH, 2023
Previous After Market Report Next After Market Report >>>
|
|
|
|
DOW |
-543.54 |
32,254.86 |
-1.66% |
|
Volume |
981,198,779 |
+24% |
|
Volume |
5,090,888,800 |
-0% |
|
NASDAQ |
-237.65 |
11,338.35 |
-2.05% |
|
Advancers |
381 |
13% |
|
Advancers |
958 |
21% |
|
S&P 500 |
-73.69 |
3,918.32 |
-1.85% |
|
Decliners |
2,587 |
87% |
|
Decliners |
3,558 |
79% |
|
Russell 2000 |
-52.89 |
1,826.59 |
-2.81% |
|
52 Wk Highs |
51 |
|
|
52 Wk Highs |
72 |
|
|
S&P 600 |
-29.07 |
1,202.34 |
-2.36% |
|
52 Wk Lows |
96 |
|
|
52 Wk Lows |
313 |
|
|
 |
Breadth Negative as Major Indices Came Under Pressure
Kenneth J. Gruneisen - Passed the CAN SLIM® Master's Exam
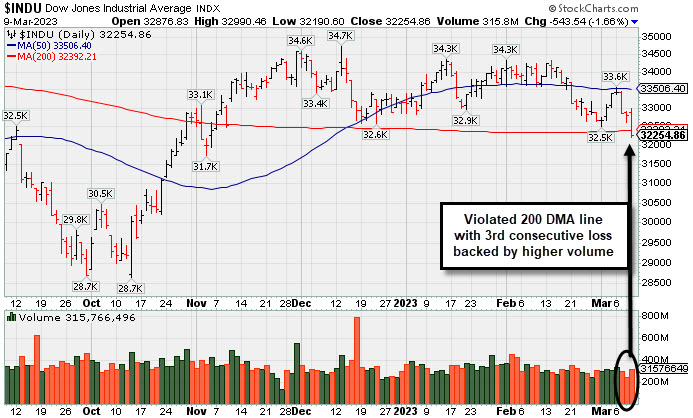
The Dow fell 543 points (-1.7%) while the Nasdaq Composite shed 2.1%. The S&P 500 fell 1.9%. Volume totals were mixed, lighter than the prior session on the NYSE and higher on the Nasdaq exchange. Breadth was clearly negative as decliners led advancers by more than 6-1 on the NYSE and by more than 3-1 on the Nasdaq exchange. There were 16 high-ranked companies from the Leaders List that hit new 52-week highs and were listed on the BreakOuts Page, versus 19 on the prior session. New 52-week lows totals swelled and outnumbered new 52-week highs on the NYSE and on the Nasdaq exchange. The major indices are in an uptrend under pressure (M criteria). For any rally to be sustained there must be healthy leadership. It will be important to watch for the new highs totals to improve in the immediate days ahead. Stay tuned!
PICTURED: The Dow Jones Industrial Average suffered a big 3rd consecutive loss with higher volume while violating its 200-day moving average (DMA) line.
U.S. equities finished lower Thursday with all sectors finishing in negative territory. The Financial sector weathered its worst day since 2020. SVB Financial Group (SIVB -60.41%) plummeted the most on record after announcing their decision to hold a stock offering. The California-based bank stated they will be taking steps to offset around $2 billion in losses stemming from losses on bond sales and “elevated cash burn” from their clients. Also weighing on stocks was Silvergate Capital Corp. (SI -42.16%) after announcing they are closing down operations amid heightened scrutiny from Washington.
On the data front, the labor market was in focus as investors try to gauge the future course of the Federal Reserve’s (Fed) monetary policy. Initial jobless claims for the week ended March 4 came in higher than expected at 211,000, its highest level since December. Meanwhile, the Challenger Job Cuts report announced U.S. employers cut 77,770 jobs in February, as companies assess the likelihood of an economic downturn. Treasuries strengthened, with the yield on the benchmark 10-year note down six basis points (0.06%) to 3.92%, while the 30-year bond yield dipped one basis point (0.01%) to 3.87%. The yield on the more Fed-sensitive two-year note shed 17 basis points (0.17%) to 4.89%. In commodities, West Texas Intermediate (WTI) crude declined 1.4% to $75.57/barrel amid heightened worries over the global economic outlook. |
 Kenneth J. Gruneisen started out as a licensed stockbroker in August 1987, a couple of months prior to the historic stock market crash that took the Dow Jones Industrial Average down -22.6% in a single day. He has published daily fact-based fundamental and technical analysis on high-ranked stocks online for two decades. Through FACTBASEDINVESTING.COM, Kenneth provides educational articles, news, market commentary, and other information regarding proven investment systems that work in good times and bad.
Comments contained in the body of this report are technical opinions only and are not necessarily those of Gruneisen Growth Corp. The material herein has been obtained from sources believed to be reliable and accurate, however, its accuracy and completeness cannot be guaranteed. Our firm, employees, and customers may effect transactions, including transactions contrary to any recommendation herein, or have positions in the securities mentioned herein or options with respect thereto. Any recommendation contained in this report may not be suitable for all investors and it is not to be deemed an offer or solicitation on our part with respect to the purchase or sale of any securities. |
|
 |
Financial Indexes Led Broad Based Declines
Kenneth J. Gruneisen - Passed the CAN SLIM® Master's Exam
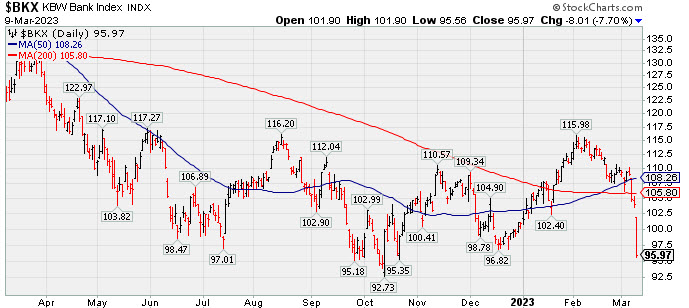
Financial stocks created a big drag on the major average as the Bank Index ($BKX -7.70%) and Broker/Dealer Index ($XBD -4.05%) were both standout decliners. The Retail Index ($RLX -1.70%) fell and the tech sector also had a negative bias as the Semiconductor Index ($SOX -2.01%), Networking Index ($NWX -1.33%), and Biotech Index ($BTK -1.57%) each lost ground. The Oil Services Index ($OSX -4.18%) outpaced the Integrated Oil Index ($XOI -1.12%) to the downside while the Gold & Silver Index ($XAU -0.65%) edged lower, rounding out the widely negative session.
PICTURED: The Bank Index ($BKX -7.70%) suffered a big 4th consecutive loss, slumping well below its 50-day and 200-day moving average (DMA) lines toward the October low. Financial indexes have been reliable leading indicators, so the weak action bodes poorly for the broader market outlook.
| Oil Services |
$OSX |
84.31 |
-3.68 |
-4.18% |
+0.53% |
| Integrated Oil |
$XOI |
1,744.58 |
-19.71 |
-1.12% |
-2.39% |
| Semiconductor |
$SOX |
2,980.21 |
-61.18 |
-2.01% |
+17.70% |
| Networking |
$NWX |
818.30 |
-11.00 |
-1.33% |
+4.47% |
| Broker/Dealer |
$XBD |
472.86 |
-19.95 |
-4.05% |
+5.28% |
| Retail |
$RLX |
2,807.05 |
-48.46 |
-1.70% |
+1.93% |
| Gold & Silver |
$XAU |
110.53 |
-0.72 |
-0.65% |
-8.55% |
| Bank |
$BKX |
95.97 |
-8.01 |
-7.70% |
-4.84% |
| Biotech |
$BTK |
5,125.15 |
-81.53 |
-1.57% |
-2.95% |
|
|
|
 |
Wesco Hovering Near All-Time High After Recent Breakout
Kenneth J. Gruneisen - Passed the CAN SLIM® Master's Exam
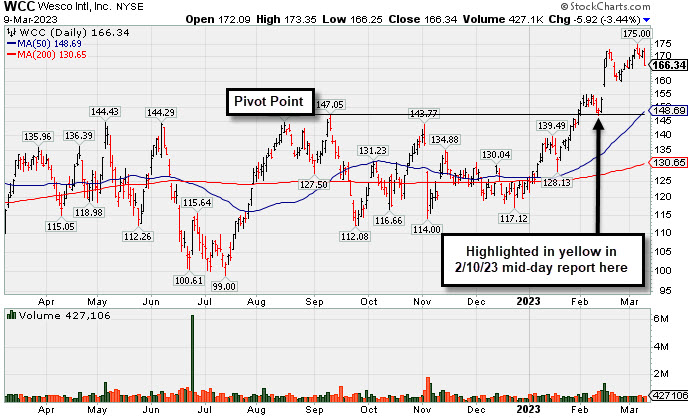
Wesco International Inc (WCC -$5.92 or -3.44% to $166.34) pulled back today with average volume yet remains only -4.9% off its all-time high, extended from the previously noted base. Prior highs in the $144-147 area define initial support to watch above its 50-day moving average (DMA) line ($148.69).
Fundamentals remain strong as it recently reported Dec '22 quarterly earnings +40% on +15% sales revenues versus the year ago period. Its Earnings Per Share Rating is 97, well above the 80+ minimum for buy candidates. The Electronic - Parts firm was highlighted in yellow in the 2/10/23 mid-day report (read here) while consolidating after recent volume-driven gains triggered a technical buy signal, a reassuring sign of fresh institutional buying demand which could lead to a meaningful price advance. It was last shown in this FSU section on 2/21/22 with an annotated graph under the headline, "Powered Higher After Recently Highlighted in Feb 10th Report".
There is a small supply of only 50.7 million shares outstanding (S criteria) which can contribute to greater price volatility in the event of institutional buying or selling. The number of top-rated funds owning its shares rose from 489 in Jun '21 to 621 in Dec '22, a reassuring sign concerning the I criteria. Its current Up/Down Volume Ratio of 1.4 is an unbiased indication of slightly distributional action over the past 50 days.
|
|
|
Color Codes Explained :
Y - Better candidates highlighted by our
staff of experts.
G - Previously featured
in past reports as yellow but may no longer be buyable under the
guidelines.
***Last / Change / Volume data in this table is the closing quote data***
Symbol/Exchange
Company Name
Industry Group |
PRICE |
CHANGE
(%Change) |
Day High |
Volume
(% DAV)
(% 50 day avg vol) |
52 Wk Hi
% From Hi |
Featured
Date |
Price
Featured |
Pivot Featured |
|
Max Buy |
 CMC
-
NYSE
CMC
-
NYSE
Commercial Metals Co
METALS and MINING - Steel and Iron
|
$50.56
|
-1.79
-3.42% |
$52.56
|
885,143
81.81% of 50 DAV
50 DAV is 1,082,000
|
$58.09
-12.96%
|
10/14/2022
|
$41.61
|
PP = $44.45
|
|
MB = $46.67
|
 Most Recent Note - 3/9/2023 7:41:08 PM
G - Volume was light behindn today's loss while slumping further below its 50 DMA line ($53.37). The recent low ($50.90 on 2/24/23) defines important near term support where any more damaging losses would raise greater concerns. Fundamentals remain strong.
>>> FEATURED STOCK ARTICLE : Sputtering Below 50-Day Moving Average Line Again - 3/6/2023 |
View all notes |
Set NEW NOTE alert |
Company Profile |
SEC
News |
Chart |
Request a new note
C
A
S
I |
GPK
-
NYSE
Graphic Packaging Hldg
CONSUMER NON-DURABLES - Packaging and Containers
|
$24.62
|
-0.32
-1.28% |
$25.17
|
2,301,997
73.17% of 50 DAV
50 DAV is 3,146,000
|
$25.15
-2.11%
|
10/25/2022
|
$22.75
|
PP = $24.17
|
|
MB = $25.38
|
Most Recent Note - 3/9/2023 7:53:24 PM
Y - Closed near the session low today for a 2nd consecutive loss backed by lighter volume. Posted a solid gain on 3/07/23, breaking into new all-time high territory with volume +39% above average. It has the look of a solid technical breakout, but the fact-based investment system's most successful breakouts that went on to produce big gains flashed much heavier volume behind gains as a buy signal.
>>> FEATURED STOCK ARTICLE : Quietly Lingering Near High With Strong Fundamentals - 2/27/2023 |
View all notes |
Set NEW NOTE alert |
Company Profile |
SEC
News |
Chart |
Request a new note
C
A
S
I |
TITN
-
NASDAQ
Titan Machinery Inc
SPECIALTY RETAIL
|
$46.49
|
-0.21
-0.45% |
$47.39
|
259,392
118.99% of 50 DAV
50 DAV is 218,000
|
$47.87
-2.88%
|
1/13/2023
|
$40.10
|
PP = $44.45
|
|
MB = $46.67
|
Most Recent Note - 3/7/2023 5:38:12 PM
G - Posted a gain today with light volume for a best-ever close. Its 50 DMA line ($42.98) definies important near-term support to watch on pullbacks.
>>> FEATURED STOCK ARTICLE : Pulled Back from New All-Time High - 2/28/2023 |
View all notes |
Set NEW NOTE alert |
Company Profile |
SEC
News |
Chart |
Request a new note
C
A
S
I |
STRL
-
NASDAQ
Sterling Infrastructure
MATERIALS and; CONSTRUCTION - Heavy Construction
|
$40.86
|
-0.73
-1.76% |
$41.91
|
196,491
70.94% of 50 DAV
50 DAV is 277,000
|
$42.00
-2.71%
|
12/14/2022
|
$32.41
|
PP = $33.72
|
|
MB = $35.41
|
Most Recent Note - 3/7/2023 5:36:33 PM
G - Hit another new all-time high today with a gain backed by +30% above average volume, getting more extended from the previously noted base. Its 50 DMA line ($35.33) and prior highs in the $34-33 area define important near-term support to watch on pullbacks.
>>> FEATURED STOCK ARTICLE : Sterling Perched Near High, Extended From Prior Base - 2/24/2023 |
View all notes |
Set NEW NOTE alert |
Company Profile |
SEC
News |
Chart |
Request a new note
C
A
S
I |
PERI
-
NASDAQ
Perion Networks Ltd
Comml Svcs-Advertising
|
$34.31
|
-1.97
-5.43% |
$36.28
|
639,925
89.13% of 50 DAV
50 DAV is 718,000
|
$37.18
-7.72%
|
1/25/2023
|
$31.79
|
PP = $33.19
|
|
MB = $34.85
|
Most Recent Note - 3/9/2023 7:39:19 PM
Y - Pulled back today with light volume behind a 2nd consecutive loss off its 52-week high and its color code is changed to yellow after dipping below its "max buy" level. Important support to watch is its 50 DMA line ($31.54) and recent low ($29.83 on 2/08/23).
>>> FEATURED STOCK ARTICLE : Perion Stubbornly Holding Ground Near High After Spurt of Gains - 2/22/2023 |
View all notes |
Set NEW NOTE alert |
Company Profile |
SEC
News |
Chart |
Request a new note
C
A
S
I |
Symbol/Exchange
Company Name
Industry Group |
PRICE |
CHANGE
(%Change) |
Day High |
Volume
(% DAV)
(% 50 day avg vol) |
52 Wk Hi
% From Hi |
Featured
Date |
Price
Featured |
Pivot Featured |
|
Max Buy |
ALGM
-
NASDAQ
Allegro Microsystems Inc
Elec-Semiconductor Mfg
|
$45.22
|
-0.81
-1.76% |
$47.67
|
2,051,610
140.62% of 50 DAV
50 DAV is 1,459,000
|
$46.90
-3.58%
|
1/31/2023
|
$37.80
|
PP = $38.38
|
|
MB = $40.30
|
Most Recent Note - 3/9/2023 7:47:03 PM
G - There was another "negative reversal" today for a loss with +38% above average volume after hitting a new all-time high. It is extended from the previously noted base. Prior high in the $38 area defines initial support to watch on pullbacks.
>>> FEATURED STOCK ARTICLE : Holding its Ground After Rallying From Previously Noted Base - 3/1/2023 |
View all notes |
Set NEW NOTE alert |
Company Profile |
SEC
News |
Chart |
Request a new note
C
A
S
I |
WCC
-
NYSE
Wesco International Inc
WHOLESALE - Electronics Wholesale
|
$166.34
|
-5.92
-3.44% |
$173.35
|
427,106
93.25% of 50 DAV
50 DAV is 458,000
|
$175.00
-4.95%
|
2/10/2023
|
$148.50
|
PP = $147.15
|
|
MB = $154.51
|
Most Recent Note - 3/9/2023 7:36:27 PM
G - Pulled back with average volume today yet remains -4.9% off its all-time high, extended from the prior base. Prior highs in the $144-147 area define initial support to watch above its 50 DMA line ($148.69). Reported Dec '22 quarterly earnings +40% on +15% sales revenues versus the year ago period. See the latest FSU analysis for more details and a new annotated graph.
>>> FEATURED STOCK ARTICLE : Wesco Hovering Near All-Time High After Recent Breakout - 3/9/2023 |
View all notes |
Set NEW NOTE alert |
Company Profile |
SEC
News |
Chart |
Request a new note
C
A
S
I |
FIX
-
NYSE
Comfort Systems U S A
MATERIALS and CONSTRUCTION - General Contractors
|
$145.00
|
-3.65
-2.45% |
$149.51
|
220,397
98.83% of 50 DAV
50 DAV is 223,000
|
$152.13
-4.69%
|
2/23/2023
|
$136.52
|
PP = $128.78
|
|
MB = $135.22
|
Most Recent Note - 3/9/2023 7:42:29 PM
G - Pulled back from its all-time high with today's 3rd consecutive loss backed by average volume. It is extended from the previously noted base. Prior highs in the $128 area define initial support to watch on pullbacks.
>>> FEATURED STOCK ARTICLE : Powerful Technical Breakout After Earnings Report - 2/23/2023 |
View all notes |
Set NEW NOTE alert |
Company Profile |
SEC
News |
Chart |
Request a new note
C
A
S
I |
KOF
-
NYSE
Coca Cola Femsa Sab Ads
FOOD and BEVERAGE - Beverages - Soft Drinks
|
$77.17
|
-1.20
-1.53% |
$79.07
|
186,877
111.90% of 50 DAV
50 DAV is 167,000
|
$79.16
-2.51%
|
3/7/2023
|
$76.63
|
PP = $77.11
|
|
MB = $80.97
|
Most Recent Note - 3/8/2023 7:02:12 PM
Y - Posted a 6th consecutive gain today with near average volume hitting a new 52-week high. Highlighted in yellow with pivot point cited based on its 1/24/23 high plus 10 cents in the 3/07/23 mid-day report. Gains above the pivot point must be backed by at least +40% above average volume to trigger a proper technical buy signal. Reported Jun, Sep and Dec '22 quarterly earnings increases above the +25% minimum guideline (C criteria) backed by strong sales revenues growth. Annal earnings had a downturn in FY '20 like many companies during the pandemic.
>>> FEATURED STOCK ARTICLE : Mexican Coke Bottler Hits New Multi-Year High - 3/7/2023 |
View all notes |
Set NEW NOTE alert |
Company Profile |
SEC
News |
Chart |
Request a new note
C
A
S
I |
ANET
-
NYSE
Arista Networks Inc
Computer-Networking
|
$148.65
|
+0.25
0.17% |
$152.07
|
4,152,002
187.36% of 50 DAV
50 DAV is 2,216,000
|
$148.90
-0.17%
|
3/8/2023
|
$147.59
|
PP = $148.67
|
|
MB = $156.10
|
Most Recent Note - 3/9/2023 12:37:59 PM
Y - Posting a 5th consecutive gain today and hitting a new all-time high. Highlighted in yellow in the prior mid-day report with pivot point cited based on its 12/27/21 high plus 10 cents. A gain and strong close above the pivot point backed by at least +40% above average volume may trigger a proper technical buy signal. Fundamentals remain strong after it reported Dec '22 quarterly earnings +72% on +55% sales revenues versus the year ago period.
>>> FEATURED STOCK ARTICLE : Arista Challenging All-Time High - 3/8/2023 |
View all notes |
Set NEW NOTE alert |
Company Profile |
SEC
News |
Chart |
Request a new note
C
A
S
I |
Symbol/Exchange
Company Name
Industry Group |
PRICE |
CHANGE
(%Change) |
Day High |
Volume
(% DAV)
(% 50 day avg vol) |
52 Wk Hi
% From Hi |
Featured
Date |
Price
Featured |
Pivot Featured |
|
Max Buy |
|
|
|
THESE ARE NOT BUY RECOMMENDATIONS!
Comments contained in the body of this report are technical
opinions only. The material herein has been obtained
from sources believed to be reliable and accurate, however,
its accuracy and completeness cannot be guaranteed.
This site is not an investment advisor, hence it does
not endorse or recommend any securities or other investments.
Any recommendation contained in this report may not
be suitable for all investors and it is not to be deemed
an offer or solicitation on our part with respect to
the purchase or sale of any securities. All trademarks,
service marks and trade names appearing in this report
are the property of their respective owners, and are
likewise used for identification purposes only.
This report is a service available
only to active Paid Premium Members.
You may opt-out of receiving report notifications
at any time. Questions or comments may be submitted
by writing to Premium Membership Services 665 S.E. 10 Street, Suite 201 Deerfield Beach, FL 33441-5634 or by calling 1-800-965-8307
or 954-785-1121.
|
|
|