You are not logged in.
This means you
CAN ONLY VIEW reports that were published prior to Saturday, March 29, 2025.
You
MUST UPGRADE YOUR MEMBERSHIP if you want to see any current reports.
AFTER MARKET UPDATE - TUESDAY, MARCH 7TH, 2023
Previous After Market Report Next After Market Report >>>
|
|
|
|
DOW |
-574.98 |
32,856.46 |
-1.72% |
|
Volume |
885,256,150 |
-6% |
|
Volume |
5,364,775,400 |
+8% |
|
NASDAQ |
-145.40 |
11,530.33 |
-1.25% |
|
Advancers |
593 |
20% |
|
Advancers |
1,344 |
30% |
|
S&P 500 |
-61.98 |
3,986.44 |
-1.53% |
|
Decliners |
2,332 |
80% |
|
Decliners |
3,131 |
70% |
|
Russell 2000 |
-21.03 |
1,878.72 |
-1.11% |
|
52 Wk Highs |
58 |
|
|
52 Wk Highs |
62 |
|
|
S&P 600 |
-12.41 |
1,228.70 |
-1.00% |
|
52 Wk Lows |
49 |
|
|
52 Wk Lows |
154 |
|
|
 |
Breadth Negative as Major Averages Slumped
Kenneth J. Gruneisen - Passed the CAN SLIM® Master's Exam
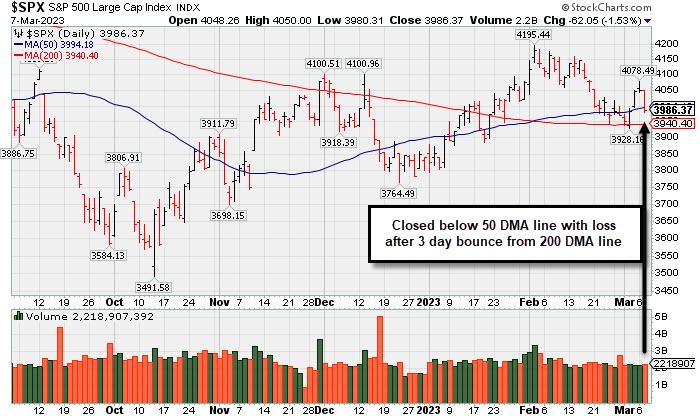
All eleven sectors finished in negative territory as the Dow lost 574 points, and the technology heavy Nasdaq Composite declined 1.3%, while the S&P 500 decreased 1.5%. Volume totals were mixed, lighter than the prior session on the NYSE and higher on the Nasdaq exchange. Breadth was clearly negative as decliners led advancers by almost a 4-1 margin on the NYSE and by more than 2-1 on the Nasdaq exchange. Leadership thinned as there were only 15 high-ranked companies from the Leaders List that hit new 52-week highs and were listed on the BreakOuts Page, versus 42 on the prior session. New 52-week highs outnumbered new 52-week lows on the NYSE while new lows outnumbered new highs on the Nasdaq exchange. The major indices are in an uptrend under pressure (M criteria). For any rally to be sustained there must be healthy leadership. It will be important to watch for the new highs totals to improve in the immediate days ahead. Stay tuned!
PICTURED: The S&P 500 Index closed below its 50-day moving average (DMA) with a loss after finding support and posting 3 gains from its 200-day moving average (DMA) line.
U.S. equities plummeted Tuesday after Federal Reserve (Fed) Chair Jerome Powell stated interest rates may have to rise higher for longer during his testimony to Congress. Powell’s comments come after multiple economic readings were reported stronger than expected, warranting the potential for a faster monetary tightening. Multiple analysts are now thinking the Fed will raise rates by a half-point instead of the hoped for quarter-point at the March 22nd FOMC meeting.
On the data front, January’s finalized wholesale inventories remained unchanged at a 0.4% decline month-over-month. Meanwhile, January’s consumer credit came in lower than expected as it increased $4.11 billion from its downwardly revised $10.692 billion print in December.
Treasuries were mixed, with the yield on the benchmark 10-year note remaining unchanged at 3.97% while the 30-year bond yield lost three basis points (0.03%) to 3.88%. The yield on the two-year note increased thirteen basis points (0.13%) to 5.01% after touching 5% for the first time since 2007. Meanwhile, the 2- and 10-year inversion widened to 100 basis points (1%) during intraday trading, notching its widest level since September 1981. In commodities, West Texas Intermediate (WTI) crude dropped 3.8% to $77.41/barrel as analyst’s concerns mount around the potential inefficiencies within the global oil market created by the Russian/Ukrainian War. In FOREX trading, the greenback rose 1.2% against a basket of major currencies, notching a level not seen in roughly two months.
|
 Kenneth J. Gruneisen started out as a licensed stockbroker in August 1987, a couple of months prior to the historic stock market crash that took the Dow Jones Industrial Average down -22.6% in a single day. He has published daily fact-based fundamental and technical analysis on high-ranked stocks online for two decades. Through FACTBASEDINVESTING.COM, Kenneth provides educational articles, news, market commentary, and other information regarding proven investment systems that work in good times and bad.
Comments contained in the body of this report are technical opinions only and are not necessarily those of Gruneisen Growth Corp. The material herein has been obtained from sources believed to be reliable and accurate, however, its accuracy and completeness cannot be guaranteed. Our firm, employees, and customers may effect transactions, including transactions contrary to any recommendation herein, or have positions in the securities mentioned herein or options with respect thereto. Any recommendation contained in this report may not be suitable for all investors and it is not to be deemed an offer or solicitation on our part with respect to the purchase or sale of any securities. |
|
 |
Commodity-Linked Groups Led Financial, Retail, Tech Losses
Kenneth J. Gruneisen - Passed the CAN SLIM® Master's Exam
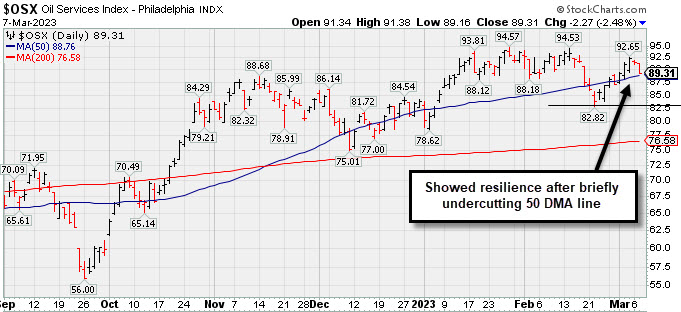
The Bank Index ($BKX -3.87%) suffered a big loss that weighed on the major averages while the Broker/Dealer Index ($XBD -0.83%) and Retail Index ($RLX -1.02%) also fell. The Gold & Silver Index ($XAU -4.36%) outpaced the Oil Services Index ($OSX -2.48%) and Integrated Oil Index ($XOI -1.90%) to the downside as commodity-linked groups led decliners. The Biotech Index ($BTK -1.85%), Semiconductor Index ($SOX -1.07%), and Networking Index ($NWX -1.52%) suffered unanimous losses.
PICTURED: The Oil Services Index ($OSX -2.48%) showed resilience after briefly undercutting its 50-day moving average (DMA) line.
| Oil Services |
$OSX |
89.31 |
-2.27 |
-2.48% |
+6.49% |
| Integrated Oil |
$XOI |
1,781.19 |
-34.55 |
-1.90% |
-0.34% |
| Semiconductor |
$SOX |
2,962.42 |
-32.17 |
-1.07% |
+16.99% |
| Networking |
$NWX |
816.18 |
-12.63 |
-1.52% |
+4.20% |
| Broker/Dealer |
$XBD |
490.10 |
-4.11 |
-0.83% |
+9.12% |
| Retail |
$RLX |
2,846.90 |
-29.34 |
-1.02% |
+3.37% |
| Gold & Silver |
$XAU |
111.70 |
-5.09 |
-4.36% |
-7.58% |
| Bank |
$BKX |
104.78 |
-4.21 |
-3.87% |
+3.89% |
| Biotech |
$BTK |
5,248.55 |
-98.89 |
-1.85% |
-0.62% |
|
|
|
 |
Mexican Coke Bottler Hits New Multi-Year High
Kenneth J. Gruneisen - Passed the CAN SLIM® Master's Exam
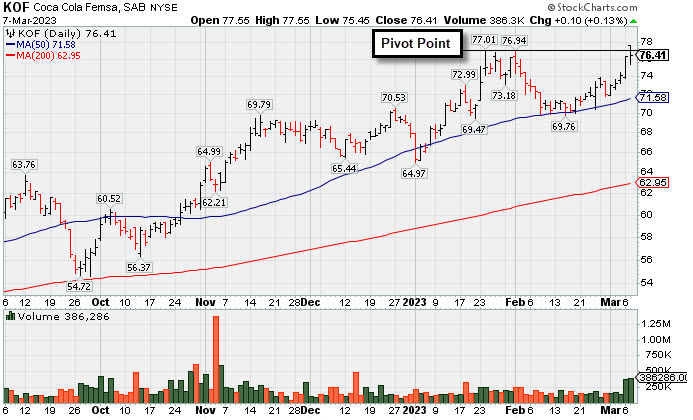
Coca Cola Femsa Sab Ads (KOF +$0.10 or +0.13% to $76.41) was highlighted in yellow with pivot point cited based on its 1/24/23 high plus 10 cents in the earlier mid-day report (read here). It hit a new 52-week high with today's 5th consecutive gain. Subsquent gains and a strong close above the pivot point backed by at least +40% above average volume may trigger a proper technical buy signal.
KOF has a 92 Earnings Per Share Rating. It reported Jun, Sep and Dec '22 quarterly earnings increases above the +25% minimum guideline (C criteria) backed by strong sales revenues growth. Annal earnings had a downturn in FY '20 like many companies during the pandemic.
It hails from the Beverages - Non-Alcoholic group which is currently ranked 97th on the 197 Industry Groups list. There are only 107.1 million shares in the public float (S criteria). The number of top-rated funds owning its shares rose from 120 in Mar '22 to 155 in Dec '22, a reassuring sign concerning the I criteria. Its current Up/Down Volume Ratio of 1.2 is an unbiased indication its shares have been under accumulation over the past 50 days. |
|
|
Color Codes Explained :
Y - Better candidates highlighted by our
staff of experts.
G - Previously featured
in past reports as yellow but may no longer be buyable under the
guidelines.
***Last / Change / Volume data in this table is the closing quote data***
Symbol/Exchange
Company Name
Industry Group |
PRICE |
CHANGE
(%Change) |
Day High |
Volume
(% DAV)
(% 50 day avg vol) |
52 Wk Hi
% From Hi |
Featured
Date |
Price
Featured |
Pivot Featured |
|
Max Buy |
 CMC
-
NYSE
CMC
-
NYSE
Commercial Metals Co
METALS and MINING - Steel and Iron
|
$51.59
|
-0.57
-1.09% |
$52.64
|
919,982
84.87% of 50 DAV
50 DAV is 1,084,000
|
$58.09
-11.19%
|
10/14/2022
|
$41.61
|
PP = $44.45
|
|
MB = $46.67
|
Most Recent Note - 3/6/2023 6:27:51 PM
G - Color code is changed to green after slumping back below its 50 DMA line ($53.15) with today's loss following 3 consecutive volume-driven gains. The recent low ($50.90 on 2/24/23) defines important near term support where any more damaging losses would raise greater concerns. Fundamentals remain strong. See the latest FSU analysis for more details and a new annotated grsph.
>>> FEATURED STOCK ARTICLE : Sputtering Below 50-Day Moving Average Line Again - 3/6/2023 |
View all notes |
Set NEW NOTE alert |
Company Profile |
SEC
News |
Chart |
Request a new note
C
A
S
I |
GPK
-
NYSE
Graphic Packaging Hldg
CONSUMER NON-DURABLES - Packaging and Containers
|
$25.02
|
+0.83
3.43% |
$25.10
|
4,404,595
137.47% of 50 DAV
50 DAV is 3,204,000
|
$24.73
1.17%
|
10/25/2022
|
$22.75
|
PP = $24.17
|
|
MB = $25.38
|
 Most Recent Note - 3/7/2023 5:33:36 PM
Y - Closed in the upper third of its intra-day range today as it posted a solid gain, breaking into new all-time high territory with volume +37% above average. It has the look of a solid technical breakout, but members were previously reminded - "Disciplined investors know that gains above a stock's pivot point must be backed by at least +40% above average volume to trigger a proper technical buy signal."
>>> FEATURED STOCK ARTICLE : Quietly Lingering Near High With Strong Fundamentals - 2/27/2023 |
View all notes |
Set NEW NOTE alert |
Company Profile |
SEC
News |
Chart |
Request a new note
C
A
S
I |
TITN
-
NASDAQ
Titan Machinery Inc
SPECIALTY RETAIL
|
$47.46
|
+1.08
2.33% |
$47.62
|
175,864
82.57% of 50 DAV
50 DAV is 213,000
|
$47.79
-0.69%
|
1/13/2023
|
$40.10
|
PP = $44.45
|
|
MB = $46.67
|
Most Recent Note - 3/7/2023 5:38:12 PM
G - Posted a gain today with light volume for a best-ever close. Its 50 DMA line ($42.98) definies important near-term support to watch on pullbacks.
>>> FEATURED STOCK ARTICLE : Pulled Back from New All-Time High - 2/28/2023 |
View all notes |
Set NEW NOTE alert |
Company Profile |
SEC
News |
Chart |
Request a new note
C
A
S
I |
STRL
-
NASDAQ
Sterling Infrastructure
MATERIALS and; CONSTRUCTION - Heavy Construction
|
$41.81
|
+1.35
3.34% |
$41.99
|
356,933
129.79% of 50 DAV
50 DAV is 275,000
|
$41.31
1.21%
|
12/14/2022
|
$32.41
|
PP = $33.72
|
|
MB = $35.41
|
Most Recent Note - 3/7/2023 5:36:33 PM
G - Hit another new all-time high today with a gain backed by +30% above average volume, getting more extended from the previously noted base. Its 50 DMA line ($35.33) and prior highs in the $34-33 area define important near-term support to watch on pullbacks.
>>> FEATURED STOCK ARTICLE : Sterling Perched Near High, Extended From Prior Base - 2/24/2023 |
View all notes |
Set NEW NOTE alert |
Company Profile |
SEC
News |
Chart |
Request a new note
C
A
S
I |
PERI
-
NASDAQ
Perion Networks Ltd
Comml Svcs-Advertising
|
$36.35
|
+0.59
1.65% |
$37.18
|
863,829
123.76% of 50 DAV
50 DAV is 698,000
|
$36.32
0.08%
|
1/25/2023
|
$31.79
|
PP = $33.19
|
|
MB = $34.85
|
Most Recent Note - 3/6/2023 12:15:10 PM
G - Posting a 4th consecutive gain today without very heavy volume, its color code is changed to green after rising above its "max buy" level and hitting a new 52-week high. Stubbornly held ground and showed resilience. Important suppport to watch is its 50 DMA line ($30.89) and recent low ($29.83 on 2/08/23).
>>> FEATURED STOCK ARTICLE : Perion Stubbornly Holding Ground Near High After Spurt of Gains - 2/22/2023 |
View all notes |
Set NEW NOTE alert |
Company Profile |
SEC
News |
Chart |
Request a new note
C
A
S
I |
Symbol/Exchange
Company Name
Industry Group |
PRICE |
CHANGE
(%Change) |
Day High |
Volume
(% DAV)
(% 50 day avg vol) |
52 Wk Hi
% From Hi |
Featured
Date |
Price
Featured |
Pivot Featured |
|
Max Buy |
ALGM
-
NASDAQ
Allegro Microsystems Inc
Elec-Semiconductor Mfg
|
$45.25
|
-0.10
-0.22% |
$45.80
|
1,381,043
96.44% of 50 DAV
50 DAV is 1,432,000
|
$46.90
-3.52%
|
1/31/2023
|
$37.80
|
PP = $38.38
|
|
MB = $40.30
|
Most Recent Note - 3/6/2023 6:27:41 PM
G - There was a "negative reversal" today while churning higher volume after hitting a new all-time high. It is extended from the previously noted base. Prior high in the $38 area defines initial support to watch on pullbacks.
>>> FEATURED STOCK ARTICLE : Holding its Ground After Rallying From Previously Noted Base - 3/1/2023 |
View all notes |
Set NEW NOTE alert |
Company Profile |
SEC
News |
Chart |
Request a new note
C
A
S
I |
WCC
-
NYSE
Wesco International Inc
WHOLESALE - Electronics Wholesale
|
$170.52
|
-0.76
-0.44% |
$173.31
|
487,127
106.83% of 50 DAV
50 DAV is 456,000
|
$175.00
-2.56%
|
2/10/2023
|
$148.50
|
PP = $147.15
|
|
MB = $154.51
|
Most Recent Note - 3/3/2023 5:55:59 PM
G - Posted a 3rd consecutive gain with below average volume and hit a new all-time high, getting more extended from the previously noted base. Prior highs in the $144-147 area define initial support to watch above its 50 DMA line ($144.88). Reported Dec '22 quarterly earnings +40% on +15% sales revenues versus the year ago period.
>>> FEATURED STOCK ARTICLE : Powered Higher After Recently Highlighted in Feb 10th Report - 2/21/2023 |
View all notes |
Set NEW NOTE alert |
Company Profile |
SEC
News |
Chart |
Request a new note
C
A
S
I |
FIX
-
NYSE
Comfort Systems U S A
MATERIALS and CONSTRUCTION - General Contractors
|
$149.08
|
-1.75
-1.16% |
$151.91
|
163,626
74.04% of 50 DAV
50 DAV is 221,000
|
$152.13
-2.00%
|
2/23/2023
|
$136.52
|
PP = $128.78
|
|
MB = $135.22
|
Most Recent Note - 3/3/2023 5:45:34 PM
G - Hit yet another new high with today's gain adding to an impressive spurt higher, getting more extended from the previously noted base. Prior highs in the $128 area define initial support to watch on pullbacks.
>>> FEATURED STOCK ARTICLE : Powerful Technical Breakout After Earnings Report - 2/23/2023 |
View all notes |
Set NEW NOTE alert |
Company Profile |
SEC
News |
Chart |
Request a new note
C
A
S
I |
KOF
-
NYSE
Coca Cola Femsa Sab Ads
FOOD and BEVERAGE - Beverages - Soft Drinks
|
$76.41
|
+0.10
0.13% |
$77.55
|
385,216
234.89% of 50 DAV
50 DAV is 164,000
|
$77.01
-0.78%
|
3/7/2023
|
$76.63
|
PP = $77.11
|
|
MB = $80.97
|
Most Recent Note - 3/7/2023 5:29:27 PM
Y - Churned higher volume today but ended little changed after highlighted in yellow with pivot point cited based on its 1/24/23 high plus 10 cents in the earlier mid-day report. It hit a new 52-week high with today's 5th consecutive gain. Subsequent gains and a strong close above the pivot point backed by at least +40% above average volume may trigger a proper technical buy signal. Reported Jun, Sep and Dec '22 quarterly earnings increases above the +25% minimum guideline (C criteria) backed by strong sales revenues growth. Annal earnings had a downturn in FY '20 like many companies during the pandemic. See the latest FSU analysis for more details and a new annotated graph.
>>> FEATURED STOCK ARTICLE : Mexican Coke Bottler Hits New Multi-Year High - 3/7/2023 |
View all notes |
Set NEW NOTE alert |
Company Profile |
SEC
News |
Chart |
Request a new note
C
A
S
I |
|
|
|
THESE ARE NOT BUY RECOMMENDATIONS!
Comments contained in the body of this report are technical
opinions only. The material herein has been obtained
from sources believed to be reliable and accurate, however,
its accuracy and completeness cannot be guaranteed.
This site is not an investment advisor, hence it does
not endorse or recommend any securities or other investments.
Any recommendation contained in this report may not
be suitable for all investors and it is not to be deemed
an offer or solicitation on our part with respect to
the purchase or sale of any securities. All trademarks,
service marks and trade names appearing in this report
are the property of their respective owners, and are
likewise used for identification purposes only.
This report is a service available
only to active Paid Premium Members.
You may opt-out of receiving report notifications
at any time. Questions or comments may be submitted
by writing to Premium Membership Services 665 S.E. 10 Street, Suite 201 Deerfield Beach, FL 33441-5634 or by calling 1-800-965-8307
or 954-785-1121.
|
|
|