You are not logged in.
This means you
CAN ONLY VIEW reports that were published prior to Monday, March 24, 2025.
You
MUST UPGRADE YOUR MEMBERSHIP if you want to see any current reports.
AFTER MARKET UPDATE - WEDNESDAY, MARCH 13TH, 2024
Previous After Market Report Next After Market Report >>>
|
|
|
|
DOW |
+37.83 |
39,043.32 |
+0.10% |
|
Volume |
1,117,851,954 |
+19% |
|
Volume |
4,887,811,400 |
-6% |
|
NASDAQ |
-87.87 |
16,177.77 |
-0.54% |
|
Advancers |
1,640 |
59% |
|
Advancers |
2,064 |
49% |
|
S&P 500 |
-9.96 |
5,165.31 |
-0.19% |
|
Decliners |
1,128 |
41% |
|
Decliners |
2,166 |
51% |
|
Russell 2000 |
+6.23 |
2,071.71 |
+0.30% |
|
52 Wk Highs |
270 |
|
|
52 Wk Highs |
192 |
|
|
S&P 600 |
+1.38 |
1,302.30 |
+0.11% |
|
52 Wk Lows |
23 |
|
|
52 Wk Lows |
124 |
|
|
 |
Leadership Improved but Major Indices Ended Mixed Again
Kenneth J. Gruneisen - Passed the CAN SLIM® Master's Exam
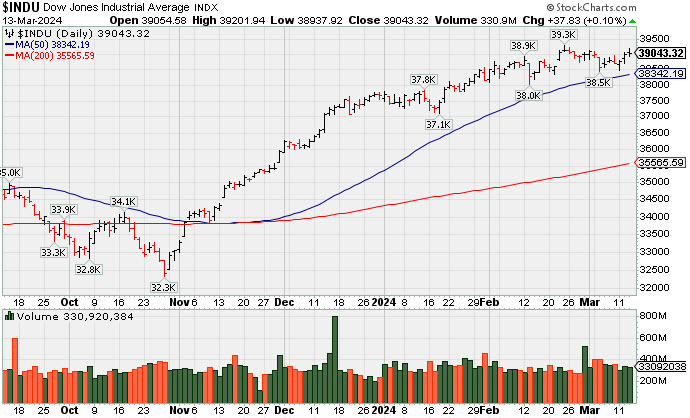
The Dow Jones Industrial Average (+0.1%) and Russell 2000 (+0.3%) closed with gains while the S&P 500 (-0.2%) and Nasdaq Composite (-0.5%) logged declines. Volume reported was mixed, higher that the prior session total on the NYSE and lighter on the Nasdaq exchange. Advancers led decliners by a 3-2 margin on the NYSE but for the 4th consecutive session decliners led advancers by a narrow margin on the Nasdaq exchange. Leadership improved as there were 74 high-ranked companies from the Leaders List that hit new 52-week highs and were listed on the BreakOuts Page, versus the total of 40 on the prior session. New 52-week highs totals expanded and outnumbered the new 52-week lows totals on the NYSE and on the Nasdaq exchange. The major indices are in a confirmed uptrend (M criteria). New buying efforts should be only made in stocks fitting all key criteria of the fact-based investment system.
PICTURED: The Dow Jones Industrial Average posted a 3rd consecutive gain, consolidating above its 50-day moving average line and closing only -0.6% off its all time high.
Most of the S&P 500 sectors closed with gains. Seven sectors closed higher while four sectors registered declines. The heavily-weighted information technology sector (-1.1%) was the worst performer, followed by the rate-sensitive real estate sector (-0.6%). An earnings-related decline in Dollar Tree (DLTR -14.2%) pressured the consumer staples sector (+0.1%) as it ended with the slimmest gain among the seven sectors that closed higher. Tesla (TSLA -4.5%) fell following an analyst downgrade.
Treasuries settled with losses as the 10-yr note yield rose four basis points to 4.19% and the 2-yr note yield rose two basis points to 4.62%. A fresh $22 billion 30-yr bond sales was met with excellent demand.
|
 Kenneth J. Gruneisen started out as a licensed stockbroker in August 1987, a couple of months prior to the historic stock market crash that took the Dow Jones Industrial Average down -22.6% in a single day. He has published daily fact-based fundamental and technical analysis on high-ranked stocks online for two decades. Through FACTBASEDINVESTING.COM, Kenneth provides educational articles, news, market commentary, and other information regarding proven investment systems that work in good times and bad.
Comments contained in the body of this report are technical opinions only and are not necessarily those of Gruneisen Growth Corp. The material herein has been obtained from sources believed to be reliable and accurate, however, its accuracy and completeness cannot be guaranteed. Our firm, employees, and customers may effect transactions, including transactions contrary to any recommendation herein, or have positions in the securities mentioned herein or options with respect thereto. Any recommendation contained in this report may not be suitable for all investors and it is not to be deemed an offer or solicitation on our part with respect to the purchase or sale of any securities. |
|
 |
Retail, Financial, Tech, and Commodity-Linked Groups Rose
Kenneth J. Gruneisen - Passed the CAN SLIM® Master's Exam
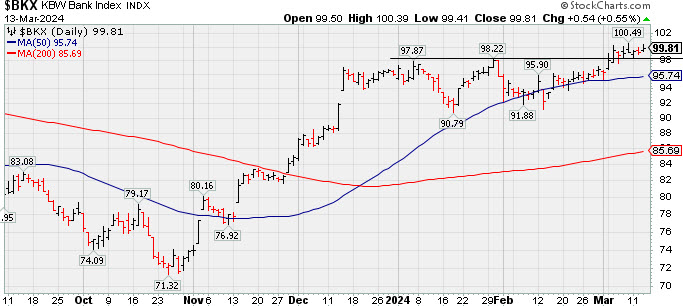
The Retail Index ($RLX +0.83%), Broker/Dealer Index ($XBD +0.77%), and the Bank Index ($BKX +0.55%) each posted gains and had a positive influence on the major averages. The tech sector was led lower by the Semiconductor Index ($SOX -2.47%), and the Networking Index ($NWX -1.07%) also slumped, while the Biotech Index ($BTK -0.12%) did a better job of holding its ground. Commodity-linked groups had a clearly positive bias as the Gold & Silver Index ($XAU +2.77%), Oil Services Index ($OSX +1.89%), and the Integrated Oil Index ($XOI +2.33%).
![]() PICTURED: The Bank Index ($BKX +0.55%) has been hovering near its 2024 high after finding prompt support near its 50-day moving average (DMA) line.
| Oil Services |
$OSX |
86.40 |
+1.60 |
+1.89% |
+3.00% |
| Integrated Oil |
$XOI |
2,050.67 |
+46.74 |
+2.33% |
+10.10% |
| Semiconductor |
$SOX |
4,868.95 |
-123.56 |
-2.47% |
+16.61% |
| Networking |
$NWX |
794.85 |
-8.61 |
-1.07% |
-4.56% |
| Broker/Dealer |
$XBD |
590.38 |
+4.53 |
+0.77% |
+5.94% |
| Retail |
$RLX |
4,422.19 |
+36.35 |
+0.83% |
+13.72% |
| Gold & Silver |
$XAU |
121.35 |
+3.27 |
+2.77% |
-3.45% |
| Bank |
$BKX |
99.81 |
+0.54 |
+0.55% |
+3.95% |
| Biotech |
$BTK |
5,311.48 |
-6.40 |
-0.12% |
-1.98% |
|
|
|
 |
Hit New All Time High With Light Volume Behind 5th Straight Gain
Kenneth J. Gruneisen - Passed the CAN SLIM® Master's Exam
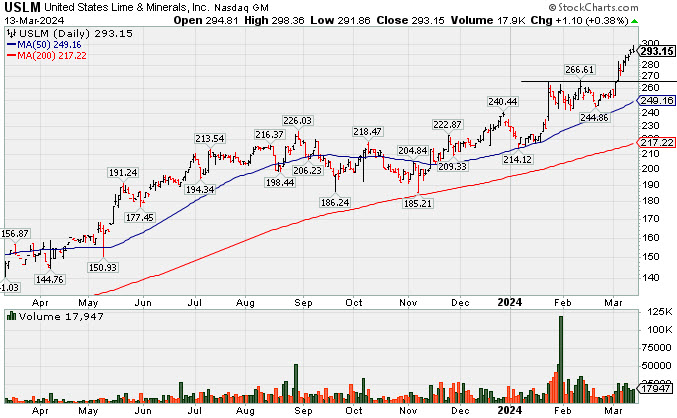
U.S. Lime & Minerals (USLM +$1.10 or +0.38% to $293.15) wedged higher with below average volume behind today's 5th consecutive gain hitting another new all-time high. It is extended from any sound base. Prior highs in the $265-266 area define initial support to watch above its 50-day moving average (DMA) line.
It has a highest possible earnings Per Share Rating of 99. It reported Dec '23 quarterly earnings +57% on +13% sales revenues versus the year ago period. Its prior quarterly and annual earnings (C and A criteria) history has been strong, a good match with the fact-based investment system's guidelines. The thinly traded firm has only 5.7 million shares outstanding (S criteria), which can contribute to greater price volatility in the event of institutional buying or selling.
USLM was last shown in this FSU section on 2/09/24 with an annotated graph under the headline, "Strong Finish for Thinly Traded U.S Lime & Minerals". The number of top-rated funds owning its shares rose from 192 in Mar '23 to 221 in Dec '23, a reassuring sign concerning the I criteria. Its current Up/Down Volume Ratio of 1.7 is an unbiased indication its shares have been under accumulation over the past 50 days. |
|
|
Color Codes Explained :
Y - Better candidates highlighted by our
staff of experts.
G - Previously featured
in past reports as yellow but may no longer be buyable under the
guidelines.
***Last / Change / Volume data in this table is the closing quote data***
Symbol/Exchange
Company Name
Industry Group |
PRICE |
CHANGE
(%Change) |
Day High |
Volume
(% DAV)
(% 50 day avg vol) |
52 Wk Hi
% From Hi |
Featured
Date |
Price
Featured |
Pivot Featured |
|
Max Buy |
 ANET
-
NYSE
ANET
-
NYSE
Arista Networks
Computer-Networking
|
$280.71
|
-1.15
-0.41% |
$282.25
|
2,780,257
119.94% of 50 DAV
50 DAV is 2,318,000
|
$292.66
-4.08%
|
10/31/2023
|
$188.84
|
PP = $198.80
|
|
MB = $208.74
|
Most Recent Note - 3/12/2024 9:43:43 PM
G - Posted a solid gain today after testing support at its 50 DMA line ($263.70) on the prior session. It has not formed a sound base of sufficient length.
>>> FEATURED STOCK ARTICLE : Best Ever Close for Arista Networks - 3/1/2024 |
View all notes |
Set NEW NOTE alert |
Company Profile |
SEC
News |
Chart |
Request a new note
C
A
S
I |
NVO
-
NYSE
Novo Nordisk ADR
Medical-Ethical Drugs
|
$133.47
|
-1.65
-1.22% |
$135.50
|
6,820,369
126.54% of 50 DAV
50 DAV is 5,390,000
|
$138.28
-3.48%
|
3/1/2024
|
$124.23
|
PP = $124.97
|
|
MB = $131.22
|
 Most Recent Note - 3/13/2024 12:40:50 PM
G - Stubbornly holding its ground after last week it rallied from a noted new advanced "3-weeks tight" base with big volume-driven gains. Recent lows in the $118 area define initial support to watch above its 50 DMA line ($116.52).
>>> FEATURED STOCK ARTICLE : Perched at All-Time High After Rallying from Advanced "3-Weeks Tight" - 3/12/2024 |
View all notes |
Set NEW NOTE alert |
Company Profile |
SEC
News |
Chart |
Request a new note
C
A
S
I |
AXON
-
NASDAQ
Axon Enterprise
Security/Sfty
|
$306.78
|
-4.59
-1.47% |
$312.55
|
575,993
123.34% of 50 DAV
50 DAV is 467,000
|
$325.63
-5.79%
|
11/8/2023
|
$127.84
|
PP = $223.30
|
|
MB = $234.47
|
Most Recent Note - 3/13/2024 10:21:27 PM
G - Pulled back today with higher volume, still hovering near its all-time high. Bullish action came after it reported Dec '23 quarterly earnings +60% on +29% sales revenues versus the year-ago period. Its 50-day moving average (DMA) line ($270) defines near-term support above the prior high ($262.95 on 1/12/24).
>>> FEATURED STOCK ARTICLE : Reversal at All-Time High After 7 Consecutive Gains - 2/12/2024 |
View all notes |
Set NEW NOTE alert |
Company Profile |
SEC
News |
Chart |
Request a new note
C
A
S
I |
TDG
-
NYSE
TransDigm Group
Aerospace/Defense
|
$1,187.40
|
+4.27
0.36% |
$1,190.18
|
159,411
71.17% of 50 DAV
50 DAV is 224,000
|
$1,207.58
-1.67%
|
12/12/2023
|
$1,000.39
|
PP = $1,013.18
|
|
MB = $1,063.84
|
Most Recent Note - 3/12/2024 9:07:11 PM
G - Posted a solid gain today with average volume. Its 50 DMA line ($1,103) defines near-term support to watch.
>>> FEATURED STOCK ARTICLE : Transdigm Perched Near All-Time High - 2/14/2024 |
View all notes |
Set NEW NOTE alert |
Company Profile |
SEC
News |
Chart |
Request a new note
C
A
S
I |
CRWD
-
NASDAQ
CrowdStrike Holdings
Computer Sftwr-Security
|
$332.24
|
+2.97
0.90% |
$334.83
|
2,713,109
64.08% of 50 DAV
50 DAV is 4,234,000
|
$365.00
-8.98%
|
1/2/2024
|
$246.42
|
PP = $261.91
|
|
MB = $275.01
|
Most Recent Note - 3/12/2024 9:45:23 PM
G - Perched within close striking distance of its all-time high, it has not formed a sound base of sufficient length. Its 50 DMA ($300) recently acted as support. Fundamentals remain strong after it reported Jan '24 quarterly earnings +102% on +33% sales revenues versus the year-ago period.
>>> FEATURED STOCK ARTICLE : Encountered Distributional Pressure After Spiking to New High - 3/11/2024 |
View all notes |
Set NEW NOTE alert |
Company Profile |
SEC
News |
Chart |
Request a new note
C
A
S
I |
Symbol/Exchange
Company Name
Industry Group |
PRICE |
CHANGE
(%Change) |
Day High |
Volume
(% DAV)
(% 50 day avg vol) |
52 Wk Hi
% From Hi |
Featured
Date |
Price
Featured |
Pivot Featured |
|
Max Buy |
ELF
-
NYSE
e.l.f. Beauty
Cosmetics/Personal Care
|
$206.42
|
+1.11
0.54% |
$209.72
|
824,373
53.22% of 50 DAV
50 DAV is 1,549,000
|
$221.83
-6.95%
|
1/2/2024
|
$138.23
|
PP = $153.63
|
|
MB = $161.31
|
Most Recent Note - 3/12/2024 9:41:21 PM
G - Extended from any sound base, it posted a big gain today with below-average volume. Its 50 DMA line ($171.65) defines important near-term support to watch. Fundamentals remain strong.
>>> FEATURED STOCK ARTICLE : Encountering Distributional Pressure Near All-Time High - 3/8/2024 |
View all notes |
Set NEW NOTE alert |
Company Profile |
SEC
News |
Chart |
Request a new note
C
A
S
I |
KOF
-
NYSE
Coca Cola Femsa Sab Ads
Beverages-Non-Alcoholic
|
$99.73
|
+1.34
1.36% |
$99.94
|
163,594
95.56% of 50 DAV
50 DAV is 171,200
|
$104.38
-4.45%
|
1/12/2024
|
$93.38
|
PP = $99.34
|
|
MB = $104.31
|
Most Recent Note - 3/12/2024 9:37:21 PM
Y - Posted a 2nd consecutive gain today with slightly above-average volume, finding support above its 50 DMA line ($95.23). There was a noted "negative reversal" on 2/20/24 at its all-time high. Reported Dec '23 quarterly earnings -13% on +24% sales revenues versus the year-ago period, raising fundamental concerns.
>>> FEATURED STOCK ARTICLE : Perched at High With Earnings News Due - 2/21/2024 |
View all notes |
Set NEW NOTE alert |
Company Profile |
SEC
News |
Chart |
Request a new note
C
A
S
I |
PCAR
-
NASDAQ
Paccar
Trucks and Parts-Hvy Duty
|
$115.97
|
+1.19
1.04% |
$116.06
|
2,029,460
90.56% of 50 DAV
50 DAV is 2,241,000
|
$116.88
-0.78%
|
1/23/2024
|
$100.35
|
PP = $98.57
|
|
MB = $103.50
|
Most Recent Note - 3/13/2024 10:18:12 PM
G - Posted a gain for a best-ever close today, and it has been steadily wedging higher with gains lacking great volume conviction. Its 50 DMA line ($104.30) defines near-term support to watch on pullbacks. Fundamentals remain strong.
>>> FEATURED STOCK ARTICLE : Extended From Any Sound Base After 7 Weekly Gains - 2/26/2024 |
View all notes |
Set NEW NOTE alert |
Company Profile |
SEC
News |
Chart |
Request a new note
C
A
S
I |
HUBB
-
NYSE
Hubbell
Electrical-Power/Equipmt
|
$399.53
|
+2.60
0.66% |
$400.00
|
503,916
123.81% of 50 DAV
50 DAV is 407,000
|
$397.32
0.56%
|
1/30/2024
|
$343.26
|
PP = $336.83
|
|
MB = $353.67
|
Most Recent Note - 3/12/2024 9:01:56 PM
G - Rallied for a new all-time high and closed at the session high with today's volume-driven gain, getting more extended from the previously noted base. Its 50 DMA line ($350) defines important support to watch on pullbacks.
>>> FEATURED STOCK ARTICLE : Inched to New Highs With Average Volume - 2/28/2024 |
View all notes |
Set NEW NOTE alert |
Company Profile |
SEC
News |
Chart |
Request a new note
C
A
S
I |
MANH
-
NASDAQ
Manhattan Associates
Computer Sftwr-Enterprse
|
$251.46
|
-4.73
-1.85% |
$255.69
|
336,417
93.19% of 50 DAV
50 DAV is 361,000
|
$266.94
-5.80%
|
1/31/2024
|
$240.57
|
PP = $230.71
|
|
MB = $242.25
|
Most Recent Note - 3/12/2024 9:47:13 PM
G - Posted a small gain today with +47% above average volume. It is extended from the previously noted base. Its 50 DMA line ($234) defines near-term support to watch above prior highs in the $230 area.
>>> FEATURED STOCK ARTICLE : Hovering Near All-Time High After Streak of Small Gains - 2/29/2024 |
View all notes |
Set NEW NOTE alert |
Company Profile |
SEC
News |
Chart |
Request a new note
C
A
S
I |
Symbol/Exchange
Company Name
Industry Group |
PRICE |
CHANGE
(%Change) |
Day High |
Volume
(% DAV)
(% 50 day avg vol) |
52 Wk Hi
% From Hi |
Featured
Date |
Price
Featured |
Pivot Featured |
|
Max Buy |
USLM
-
NASDAQ
U.S. Lime & Minerals
Bldg-Cement/Concrt/Ag
|
$293.15
|
+1.10
0.38% |
$298.36
|
17,947
89.74% of 50 DAV
50 DAV is 20,000
|
$294.98
-0.62%
|
2/9/2024
|
$254.68
|
PP = $265.09
|
|
MB = $278.34
|
Most Recent Note - 3/13/2024 10:16:16 PM
G - Wedged to another new all-time high with below-average volume behind today's 5th consecutive gain. Prior highs in the $265-266 area define initial near-term support to watch on pullbacks. See the latest FSU analysis for more details and a new annotated graph.
>>> FEATURED STOCK ARTICLE : Hit New All Time High With Light Volume Behind 5th Straight Gain - 3/13/2024 |
View all notes |
Set NEW NOTE alert |
Company Profile |
SEC
News |
Chart |
Request a new note
C
A
S
I |
NOW
-
NYSE
ServiceNow
Computer Sftwr-Enterprse
|
$776.55
|
-13.01
-1.65% |
$807.77
|
1,217,922
97.51% of 50 DAV
50 DAV is 1,249,000
|
$815.32
-4.76%
|
2/22/2024
|
$771.75
|
PP = $815.32
|
|
MB = $856.09
|
Most Recent Note - 3/12/2024 9:39:47 PM
Y - Posted a solid gap up gain today with above-average volume. Found prompt support near its 50 DMA line ($754) in recent weeks while consolidating, while recent lows define the next important near-term support to watch.
>>> FEATURED STOCK ARTICLE : Found Support With a Solid Gap Up from 10-Week Moving Average - 2/23/2024 |
View all notes |
Set NEW NOTE alert |
Company Profile |
SEC
News |
Chart |
Request a new note
C
A
S
I |
SNPS
-
NASDAQ
Synopsys
Computer Sftwr-Design
|
$560.97
|
-15.75
-2.73% |
$576.72
|
881,385
65.00% of 50 DAV
50 DAV is 1,356,000
|
$629.38
-10.87%
|
2/22/2024
|
$600.65
|
PP = $582.85
|
|
MB = $611.99
|
Most Recent Note - 3/13/2024 10:20:11 PM
Y - Pulled back today with higher (still below-average) volume. Volume totals have been cooling in recent weeks while consolidating. The prior low ($555 on 3/11/24) defines near-term support above its 50 DMA line ($544.38). Previously noted - "A strong volume-driven gain and close above the pivot point is needed to clinch a proper technical buy signal. Reported Jan '24 quarterly earnings +36% on +21% sales revenues versus the year-ago period, its 3rd strong quarter above the +25% minimum earnings guideline (C criteria). Annual earnings growth (A criteria) has been strong and steady."
>>> FEATURED STOCK ARTICLE : Gapped Up for New High But Ended Near Session Low - 2/22/2024 |
View all notes |
Set NEW NOTE alert |
Company Profile |
SEC
News |
Chart |
Request a new note
C
A
S
I |
PAY
-
NYSE
Paymentus Holdings
Finance-CrdtCard/PmtPr
|
$24.88
|
+0.95
3.97% |
$24.99
|
845,308
342.23% of 50 DAV
50 DAV is 247,000
|
$24.00
3.67%
|
3/5/2024
|
$19.97
|
PP = $18.89
|
|
MB = $19.83
|
Most Recent Note - 3/13/2024 12:44:37 PM
G - Rallying for yet another new 52-week high with today's 4th consecutive volume-driven gain, quickly getting very extended from the previously noted base. Prior highs in the $18 range define important initial support to watch on pullbacks.
>>> FEATURED STOCK ARTICLE : Big Gap Up Gain Triggered Technical Buy Signal - 3/5/2024 |
View all notes |
Set NEW NOTE alert |
Company Profile |
SEC
News |
Chart |
Request a new note
C
A
S
I |
|
|
|
THESE ARE NOT BUY RECOMMENDATIONS!
Comments contained in the body of this report are technical
opinions only. The material herein has been obtained
from sources believed to be reliable and accurate, however,
its accuracy and completeness cannot be guaranteed.
This site is not an investment advisor, hence it does
not endorse or recommend any securities or other investments.
Any recommendation contained in this report may not
be suitable for all investors and it is not to be deemed
an offer or solicitation on our part with respect to
the purchase or sale of any securities. All trademarks,
service marks and trade names appearing in this report
are the property of their respective owners, and are
likewise used for identification purposes only.
This report is a service available
only to active Paid Premium Members.
You may opt-out of receiving report notifications
at any time. Questions or comments may be submitted
by writing to Premium Membership Services 665 S.E. 10 Street, Suite 201 Deerfield Beach, FL 33441-5634 or by calling 1-800-965-8307
or 954-785-1121.
|
|
|