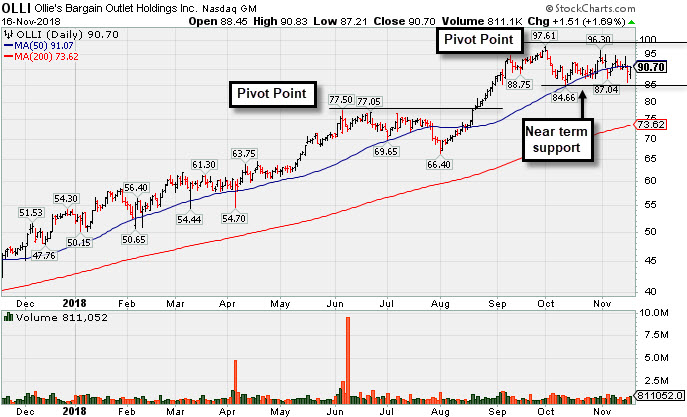
Consolidating Near 50-Day Average Forming New Base - Friday, November 16, 2018
Ollie's Bargain Outlet (OLLI +$4.05 or +4.57% to $92.72) rebounded near its 50-day moving average (DMA) line ($91.07) with today's volume-driven gain. Its color code is changed to yellow with new pivot point cited based on its 10/01/18 high plus 10 cents. Subsequent gains above the pivot point backed by at least +40% above average volume may trigger a new (or add-on) technical buy signal. Meanwhile, the prior low ($84.66 on 10/11/18) defines important near-term support where any violation may raise serious concerns and trigger a technical sell signal.
It is due to report earnings on December 6th. Fundamentals remain strong. OLLI was last shown in this FSU section on 10/30/18 with an annotated graph under the headline, "Finding Support Near its 50-Day Moving Average". Recently it reported earnings +48% on +13% sales revenues for the Jul '18 quarter, continuing its strong earnings track record and meeting the +25% minimum earnings guideline (C criteria). It has earned a very strong 98 Earnings Per Share (EPS) rating.
The Retail - Discount & Variety firm traded up as much as +269.5% since highlighted in yellow with a pivot point based on its 4/28/16 high plus 10 cents in 7/19/16 mid-day report (read here). OLLI completed its $16 IPO on 7/16/15. It completed a Secondary Offerings on 6/06/16 and 2/18/16.
The number of top-rated funds owning its shares rose from 98 in Sep '15 to 526 in Sep '18, a reassuring sign concerning the I criteria. Its current Up/Down Volume ratio of 1.0 is an unbiased indication its shares have been neutral concerning accumulation or distributional pressure over the past 50 days. The small supply of only 62.7 million shares outstanding (S criteria) can contribute to greater price volatility in the event of institutional buying or selling.
Charts courtesy www.stockcharts.com
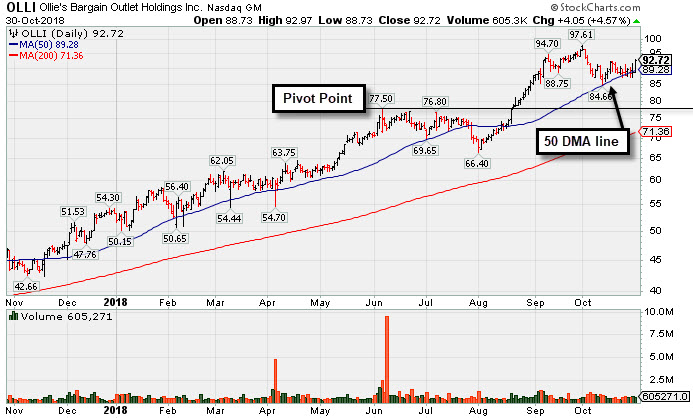
Finding Support Near its 50-Day Moving Average - Tuesday, October 30, 2018
Ollie's Bargain Outlet (OLLI +$4.05 or +4.57% to $92.72) found support recently near its 50-day moving average (DMA) line ($89.28). It has not formed a sound new base of sufficient length. Fundamentals remain strong. OLLI was last shown in this FSU section on 10/09/18 with an annotated graph under the headline, "Encountered Distributional Pressure After a Great Rally".
Recently it reported earnings +48% on +13% sales revenues for the Jul '18 quarter, continuing its strong earnings track record and meeting the +25% minimum earnings guideline (C criteria). It has earned a very strong 98 Earnings Per Share (EPS) rating.
The Retail - Discount & Variety firm traded up as much as +269.5% since highlighted in yellow with a pivot point based on its 4/28/16 high plus 10 cents in 7/19/16 mid-day report (read here). OLLI completed its $16 IPO on 7/16/15. It completed a Secondary Offerings on 6/06/16 and 2/18/16.
The number of top-rated funds owning its shares rose from 98 in Sep '15 to 510 in Sep '18, a reassuring sign concerning the I criteria. Its current Up/Down Volume ratio of 1.3 is an unbiased indication its shares have been neutral concerning accumulation or distributional pressure over the past 50 days. The small supply of only 62.7 million shares outstanding (S criteria) can contribute to greater price volatility in the event of institutional buying or selling.
Charts courtesy www.stockcharts.com
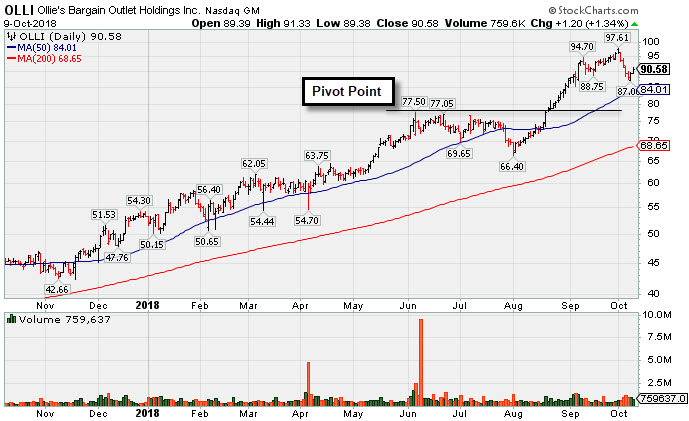
Encountered Distributional Pressure After a Great Rally - Tuesday, October 9, 2018
Ollie's Bargain Outlet (OLLI +$1.20 or +1.34% to $90.58) is extended from any sound base. Its 50-day moving average (DMA) line ($84.01) defines near-term support above prior highs in the $77 area.
Fundamentals remain strong. OLLI was last shown in this FSU section on 8/22/18 with an annotated graph under the headline, "Hitting New Highs With More Volume-Driven Gains". Recently it reported earnings +48% on +13% sales revenues for the Jul '18 quarter, continuing its strong earnings track record and meeting the +25% minimum earnings guideline (C criteria). It has earned a very strong 98 Earnings Per Share (EPS) rating.
The Retail - Discount & Variety firm traded up as much as +269.5% since highlighted in yellow with a pivot point based on its 4/28/16 high plus 10 cents in 7/19/16 mid-day report (read here). OLLI completed its $16 IPO on 7/16/15. It completed a Secondary Offerings on 6/06/16 and 2/18/16.
The number of top-rated funds owning its shares rose from 98 in Sep '15 to 504 in Sep '18, a reassuring sign concerning the I criteria. Its current Up/Down Volume ratio of 1.5 is an unbiased indication its shares have been neutral concerning accumulation or distributional pressure over the past 50 days. The small supply of only 62.7 million shares outstanding (S criteria) can contribute to greater price volatility in the event of institutional buying or selling.
Charts courtesy www.stockcharts.com
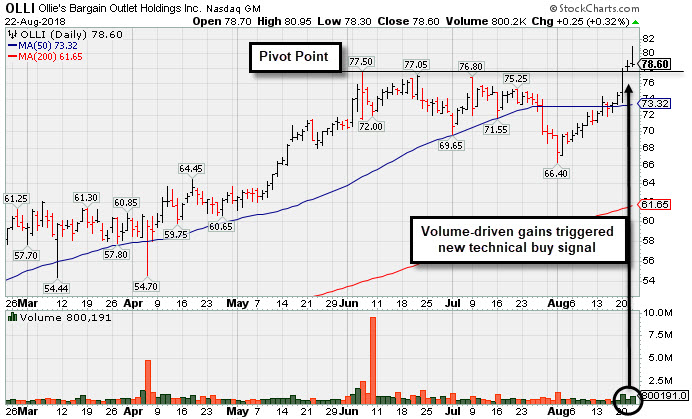
Hitting New Highs With More Volume-Driven Gains - Wednesday, August 22, 2018
Ollie's Bargain Outlet (OLLI +$0.25 or +0.32% to $78.60) recently rebounded above its 50-day moving average (DMA) line ($73.32) helping its outlook improve and its color code was changed to yellow. Subsequent volume-driven gains above the pivot point triggered a new (or add-on) technical buy signal.
Fundamentals remain strong. Keep in mind that earnings news is due on 8/29/18, and volume and volatility often increase near earnings news. OLLI was last shown in this FSU section on 7/05/18 with an annotated graph under the headline, "Found Recent Support at 50-Day Moving Average Line". Recently it reported earnings +64% on +21% sales revenues for the Apr '18 quarter, continuing its strong earnings track record and meeting the +25% minimum earnings guideline (C criteria). It has earned a very strong 97 Earnings Per Share (EPS) rating.
The Retail - Discount & Variety firm traded up as much as +206.4% since highlighted in yellow with a pivot point based on its 4/28/16 high plus 10 cents in 7/19/16 mid-day report (read here). OLLI completed its $16 IPO on 7/16/15. It completed a Secondary Offerings on 6/06/16 and 2/18/16.
The number of top-rated funds owning its shares rose from 98 in Sep '15 to 476 in Jun '18, a reassuring sign concerning the I criteria. Its current Up/Down Volume ratio of 1.0 is an unbiased indication its shares have been neutral concerning accumulation or distributional pressure over the past 50 days. The small supply of only 62.3 million shares outstanding (S criteria) can contribute to greater price volatility in the event of institutional buying or selling.
Charts courtesy www.stockcharts.com
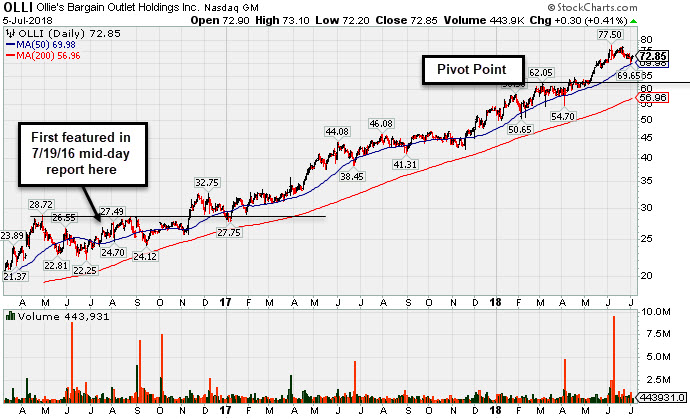
Found Recent Support at 50-Day Moving Average Line - Thursday, July 5, 2018
Ollie's Bargain Outlet (OLLI +$0.30 or +0.41% to $72.85) is very extended from any sound base. Its 50-day moving average (DMA) line ($69.98) defines important near-term support to watch on pullbacks.
OLLI was last shown in this FSU section on 5/17/18 with an annotated graph under the headline, " Extended From Prior Base After 8 Consecutive Gains". Fundamentals remain very strong. Recently it reported earnings +64% on +21% sales revenues for the Apr '18 quarter, continuing its strong earnings track record and meeting the +25% minimum earnings guideline (C criteria). It has earned a very strong 98 Earnings Per Share (EPS) rating.
The Retail - Discount & Variety firm traded up as much as +193.8% since highlighted in yellow with a pivot point based on its 4/28/16 high plus 10 cents in 7/19/16 mid-day report (read here). OLLI completed its $16 IPO on 7/16/15. It completed a Secondary Offerings on 6/06/16 and 2/18/16.
The number of top-rated funds owning its shares rose from 98 in Sep '15 to 438 in Mar '18, a reassuring sign concerning the I criteria. Its current Up/Down Volume ratio of 0.7 is an unbiased indication its shares have been under slight distributional pressure over the past 50 days. The small supply of only 62.3 million shares outstanding (S criteria) can contribute to greater price volatility in the event of institutional buying or selling.
Charts courtesy www.stockcharts.com
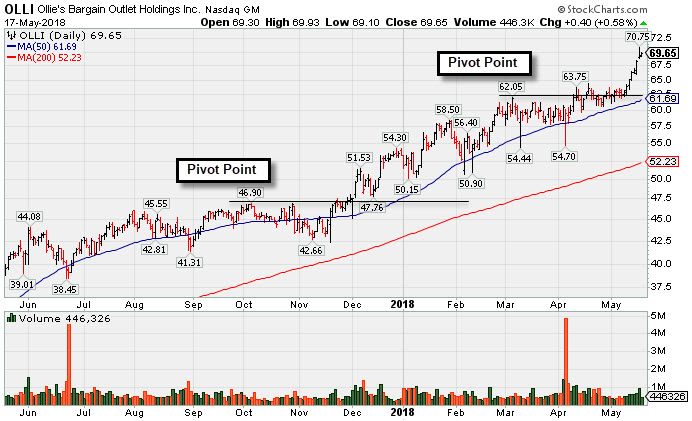
Extended From Prior Base After 8 Consecutive Gains - Thursday, May 17, 2018
Ollie's Bargain Outlet (OLLI +$0.40 or +0.58% to $69.65) is perched at its all-time high after 8 consecutive gains. No resistance remains due to overhead supply, but it is extended from any sound base. Its 50-day moving average (DMA) line defines near term support to watch.
OLLI was last shown in this FSU section on 4/11/18 with an annotated graph under the headline, "Encountered Distribution, Finished Below Pivot Point After Early Gain". It found prompt support on 4/05/18 after undercutting its 50-day moving average (DMA) line and nearly testing the prior low ($54.44 on 3/09/18). Fundamentals remain very strong. Recently it reported earnings +31% on +26% sales revenues for the Jan '18 quarter, continuing its strong earnings track record and meeting the +25% minimum earnings guideline (C criteria). It has earned a very strong 95 Earnings Per Share (EPS) rating.
The Retail - Discount & Variety firm traded up as much as +167.8% since highlighted in yellow with a pivot point based on its 4/28/16 high plus 10 cents in 7/19/16 mid-day report (read here). OLLI completed its $16 IPO on 7/16/15. It completed a Secondary Offerings on 6/06/16 and 2/18/16. The number of top-rated funds owning its shares rose from 98 in Sep '15 to 429 in Mar '18, a reassuring sign concerning the I criteria. Its current Up/Down Volume ratio of 1.1 is an unbiased indication its shares have been under slight accumulation over the past 50 days. The small supply of only 62.3 million shares outstanding (S criteria) can contribute to greater price volatility in the event of institutional buying or selling.
Charts courtesy www.stockcharts.com
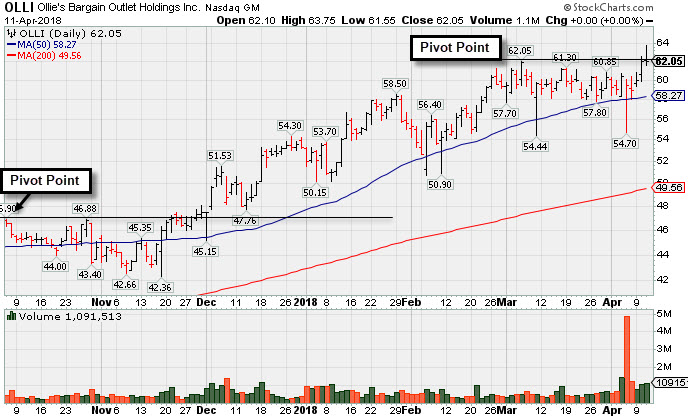
Encountered Distribution, Finished Below Pivot Point After Early Gain - Wednesday, April 11, 2018
Ollie's Bargain Outlet (OLLI +$62.05) encountered distributional pressure today and ended the session below the pivot point and unchanged after early gains helped it hit a new all-time high. It posted a big gain for a new high backed by +66% above average volume on the prior session. Still, confirming volume-driven gains above the pivot point are needed to clinch a convincing new technical buy signal.
Its color code was recently changed to yellow and a new pivot point was cited based on its 3/06/18 high. OLLI found prompt support on 4/05/18 after undercutting its 50-day moving average (DMA) line ($58.27) and nearly testing the prior low ($54.44 on 3/09/18). Fundamentals remain very strong. Recently it reported earnings +31% on +26% sales revenues for the Jan '18 quarter, continuing its strong earnings track record and meeting the +25% minimum earnings guideline (C criteria). It has earned a very strong 97 Earnings Per Share (EPS) rating.
OLLI was last shown in this FSU section on 3/13/18 with an annotated graph under the headline, "Bargain Outlet's Shares Perched Near All-Time Price High". The Retail - Discount & Variety firm traded up as much as +141.2% since highlighted in yellow with a pivot point based on its 4/28/16 high plus 10 cents in 7/19/16 mid-day report (read here).
OLLI completed its $16 IPO on 7/16/15. It completed a Secondary Offerings on 6/06/16 and 2/18/16. The number of top-rated funds owning its shares rose from 98 in Sep '15 to 417 in Mar '18, a reassuring sign concerning the I criteria. Its current Up/Down Volume ratio of 0.9 is an unbiased indication its shares have been under slight distributional pressure over the past 50 days. The small supply of only 62.2 million shares outstanding (S criteria) can contribute to greater price volatility in the event of institutional buying or selling.
Charts courtesy www.stockcharts.com
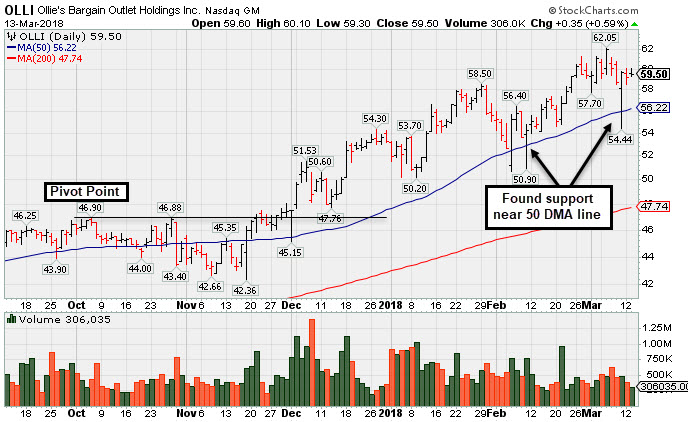
Bargain Outlet's Shares Perched Near All-Time Price High - Tuesday, March 13, 2018
Ollie's Bargain Outlet (OLLI +$0.35 or +0.59% to $59.50) remains perched near its all-time high after getting extended from any sound base. Support is defined by its 50-day moving average (DMA) line ($56.22) and prior low ($50.15 on 1/04/18). Damaging violations may trigger more worrisome technical sell signals.
Fundamentals remain very strong. Recently it reported earnings +29% on +18% sales revenues for the Oct '17 quarter, continuing its strong earnings track record and meeting the +25% minimum earnings guideline (C criteria). It has earned a very strong 97 Earnings Per Share (EPS) rating.
The Retail - Discount & Variety firm traded up as much as +135% since highlighted in yellow with a pivot point based on its 4/28/16 high plus 10 cents in 7/19/16 mid-day report (read here). OLLI was last shown in this FSU section on 1/18/18 with an annotated graph under the headline, "Bs".
OLLI completed its $16 IPO on 7/16/15. It completed a Secondary Offerings on 6/06/16 and 2/18/16. The number of top-rated funds owning its shares rose from 98 in Sep '15 to 430 in Dec '17, a reassuring sign concerning the I criteria. Its current Up/Down Volume ratio of 1.2 is an unbiased indication its shares have been under slight accumulation over the past 50 days. The small supply of only 61.7 million shares outstanding (S criteria) can contribute to greater price volatility in the event of institutional buying or selling.
Charts courtesy www.stockcharts.com
Consolidating Above 50-Day Moving Average Line - Tuesday, February 13, 2018
Ollie's Bargain Outlet (OLLI -$0.20 or -0.36% to $54.80) is extended from any sound base. Its 50-day moving average DMA line ($53.21) and recent low ($50.15 on 1/04/18) define important near-term support where damaging violations may trigger more worrisome technical sell signals.
Fundamentals remain very strong. Recently it reported earnings +29% on +18% sales revenues for the Oct '17 quarter, continuing its strong earnings track record and meeting the +25% minimum earnings guideline (C criteria). It has earned a very strong 97 Earnings Per Share (EPS) rating.
The Retail - Discount & Variety firm traded up as much as +121% since highlighted in yellow with a pivot point based on its 4/28/16 high plus 10 cents in 7/19/16 mid-day report (read here). OLLI was last shown in this FSU section on 1/18/18 with an annotated graph under the headline, "Bargain Outlet Looked Expensive Before +114% Rally in 18 Months".
OLLI completed its $16 IPO on 7/16/15. It completed a Secondary Offerings on 6/06/16 and 2/18/16. The number of top-rated funds owning its shares rose from 98 in Sep '15 to 436 in Dec '17, a reassuring sign concerning the I criteria. Its current Up/Down Volume ratio of 1.8 is an unbiased indication its shares have been under accumulation over the past 50 days. The small supply of only 61.7 million shares outstanding (S criteria) can contribute to greater price volatility in the event of institutional buying or selling.
Charts courtesy www.stockcharts.com

Bargain Outlet Looked Expensive Before +114% Rally in 18 Months - Thursday, January 18, 2018
Ollie's Bargain Outlet (OLLI +$0.45 and +0.82% to $55.05) is perched near its all-time high, extended from any sound base. Its recent low ($50.15 on 1/04/18) and the 50-day moving average DMA line ($49.51) define important near-term support above prior highs in the $46 area.
Fundamentals remain very strong. Recently it reported earnings +29% on +18% sales revenues for the Oct '17 quarter, continuing its strong earnings track record and meeting the +25% minimum earnings guideline (C criteria). It has earned a very strong 97 Earnings Per Share (EPS) rating.
The Retail - Discount & Variety firm traded up as much as +114.42% since highlighted in yellow with a pivot point based on its 4/28/16 high plus 10 cents in 7/19/16 mid-day report (read here). OLLI was last shown in this FSU section on 12/20/17 with an annotated graph under the headline, "Extended From Latest Base and Perched Near Record High".
OLLI completed its $16 IPO on 7/16/15. It completed a Secondary Offerings on 6/06/16 and 2/18/16. The number of top-rated funds owning its shares rose from 98 in Sep '15 to 425 in Dec '17, a reassuring sign concerning the I criteria. Its current Up/Down Volume ratio of 1.8 is an unbiased indication its shares have been under accumulation over the past 50 days. The small supply of only 61.7 million shares outstanding (S criteria) can contribute to greater price volatility in the event of institutional buying or selling.
Charts courtesy www.stockcharts.com

Extended From Latest Base and Perched Near Record High - Wednesday, December 20, 2017
Ollie's Bargain Outlet (OLLI +$0.25 or +0.48% to $52.60) is perched at its all-time high after additional volume-driven gains, getting more extended from its latest sound base. Its 50-day moving average (DMA) line ($46.59) defines important near-term support coinciding with prior highs in the $46 area.
Recently it reported earnings +29% on +18% sales revenues for the Oct '17 quarter, continuing its strong earnings track record and meeting the +25% minimum earnings guideline (C criteria). It has earned a very strong 97 Earnings Per Share (EPS) rating.
The Retail - Discount & Variety firm traded up as much as +101.5% since highlighted in yellow with a pivot point based on its 4/28/16 high plus 10 cents in 7/19/16 mid-day report (read here). OLLI was last shown in this FSU section on 11/27/17 with an annotated graph under the headline, "Recently Stalled After Reaching a New High".
OLLI completed its $16 IPO on 7/16/15. It completed a Secondary Offerings on 6/06/16 and 2/18/16. The number of top-rated funds owning its shares rose from 98 in Sep '15 to 423 in Sep '17, a reassuring sign concerning the I criteria. Its current Up/Down Volume ratio of 1.7 is an unbiased indication its shares have been under accumulation over the past 50 days. The small supply of only 61.7 million shares outstanding (S criteria) can contribute to greater price volatility in the event of institutional buying or selling.
Charts courtesy www.stockcharts.com

Recently Stalled After Reaching a New High - Monday, November 27, 2017
Ollie's Bargain Outlet (OLLI $46.40) recently stalled near the new pivot point cited based on its 10/05/17 high plus 10 cents. Subsequent gains above the pivot point backed by volume more than the minimum +40% above average volume threshold may clinch a proper new (or add-on) technical buy signal. A recent rebound above its 50-day moving average (DMA) line with convincing volume-driven gains helped its outlook to improve. Prior lows in the $41-42 define the next important support level where further deterioration would raise more serious concerns.
OLLI was last shown in this FSU section on 10/30/17 with an annotated graph under the headline, "Sell Signal Triggered by 50-Day Moving Average Violation on Higher Volume". After a new pivot point was cited based on its 8/01/17 high plus 10 cents, members were repeatedly reminded - "Recent gains above the latest pivot point did not meet the minimum +40% above average volume threshold necessary to trigger a proper new (or add-on) technical buy signal. Confirming volume-driven gains would be a reassuring sign of fresh institutional buying demand."
Fundamentals remain strong. Recently it reported earnings +29% on +21% sales revenues for the Jul '17 quarter, continuing its strong earnings track record and meeting the +25% minimum earnings guideline (C criteria). It has earned a very strong 97 Earnings Per Share (EPS) rating.
The Retail - Discount & Variety firm traded up as much as +79.8% since highlighted in yellow with a pivot point based on its 4/28/16 high plus 10 cents in 7/19/16 mid-day report (read here). OLLI completed its $16 IPO on 7/16/15. It completed a Secondary Offerings on 6/06/16 and 2/18/16. The number of top-rated funds owning its shares rose from 98 in Sep '15 to 417 in Sep '17, a reassuring sign concerning the I criteria. Its small supply of only 61.4 million shares outstanding (S criteria) can contribute to greater price volatility in the event of institutional buying or selling.
Charts courtesy www.stockcharts.com

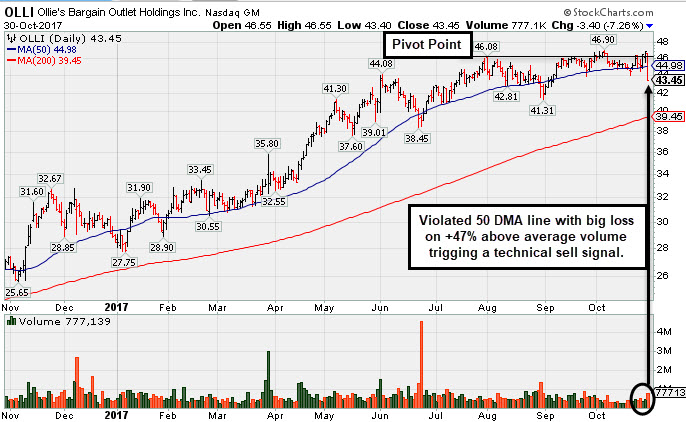
Sell Signal Triggered by 50-Day Moving Average Violation on Higher Volume - Monday, October 30, 2017
Ollie's Bargain Outlet (OLLI -$3.40 or -7.26% to $43.45) abruptly retreated from its all-time high with a big loss today, violating its 50 DMA line ($45.01) line and triggering a technical sell signal. Its color code was changed to green. Only a prompt rebound above the 50 DMA line would help its outlook improve. It may find support near recent lows in the $43-44 area, but further deterioration would raise more serious concerns.
OLLI was last shown in this FSU section on 10/03/17 with an annotated graph under the headline, "Quietly Hit New Highs Without Great Volume Conviction". After a new pivot point was cited based on its 8/01/17 high plus 10 cents, members were repeatedly reminded - "Recent gains above the latest pivot point did not meet the minimum +40% above average volume threshold necessary to trigger a proper new (or add-on) technical buy signal. Confirming volume-driven gains would be a reassuring sign of fresh institutional buying demand."
Fundamentals remain strong. Recently it reported earnings +29% on +21% sales revenues for the Jul '17 quarter, continuing its strong earnings track record and meeting the +25% minimum earnings guideline (C criteria). It has earned a very strong 97 Earnings Per Share (EPS) rating.
The Retail - Discount & Variety firm traded up as much as +77.4% since highlighted in yellow with a pivot point based on its 4/28/16 high plus 10 cents in 7/19/16 mid-day report (read here). OLLI completed its $16 IPO on 7/16/15. It completed a Secondary Offerings on 6/06/16 and 2/18/16. The number of top-rated funds owning its shares rose from 98 in Sep '15 to 405 in Sep '17, a reassuring sign concerning the I criteria. Its small supply of only 61.4 million shares outstanding (S criteria) can contribute to greater price volatility in the event of institutional buying or selling.
Charts courtesy www.stockcharts.com
Quietly Hit New Highs Without Great Volume Conviction - Tuesday, October 3, 2017
Ollie's Bargain Outlet (OLLI +$0.20 or +0.43% to $46.30) touched a new high today with a light volume gain. It found support at its 50-day moving average (DMA) line ($44.61) recently. A new pivot point was cited based on its 8/01/17 high plus 10 cents. Gains above the pivot point must have at least +40% above average volume to trigger a proper new (or add-on) technical buy signal. Any slump back below the 50 DMA line would raise concerns, and more damaging losses below the recent low ($41.31) would trigger a worrisome technical sell signal.
Fundamentals remain strong. Recently it reported earnings +29% on +21% sales revenues for the Jul '17 quarter, continuing its strong earnings track record and meeting the +25% minimum earnings guideline (C criteria). It has earned a very strong 97 Earnings Per Share (EPS) rating. OLLI was last shown in this FSU section on 9/08/17 with an annotated graph under the headline, "Qh".
The Retail - Discount & Variety firm traded up as much as +77.2% since highlighted in yellow with a pivot point based on its 4/28/16 high plus 10 cents in 7/19/16 mid-day report (read here). OLLI completed its $16 IPO on 7/16/15. It completed a Secondary Offerings on 6/06/16 and 2/18/16. The number of top-rated funds owning its shares rose from 98 in Sep '15 to 387 in Jun '17, a reassuring sign concerning the I criteria. Its small supply of only 61.4 million shares outstanding (S criteria) can contribute to greater price volatility in the event of institutional buying or selling.
Charts courtesy www.stockcharts.com

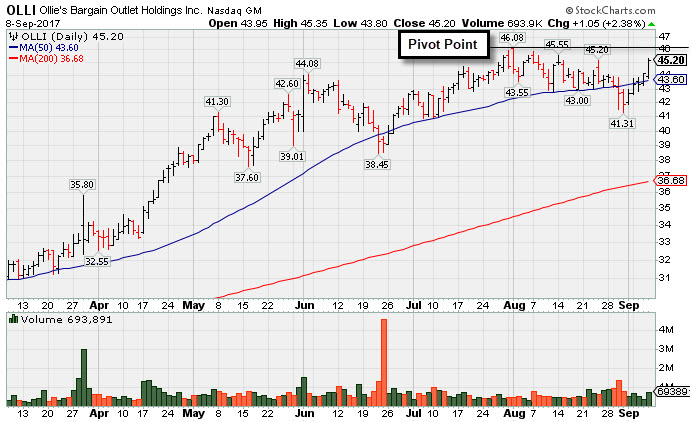
New Pivot Point Cited After Rebound From Below 50-Day Average - Friday, September 8, 2017
Ollie's Bargain Outlet (OLLI +$1.05 or +2.38% to $45.20) made progress back above its 50-day moving average (DMA) line ($43.60) this week helping its outlook to improve. A new pivot point was cited based on its 8/01/17 high plus 10 cents. Subsequent gains backed by at least the minimum +40% above average volume are needed to trigger a proper new (or add-on) technical buy signal. Any slump back below the 50 DMA line would raise concerns, and more damaging losses below the recent low ($41.31) would trigger a worrisome technical sell signal.
Recently it reported earnings +29% on +21% sales revenues for the Jul '17 quarter, continuing its strong earnings track record and meeting the +25% minimum earnings guideline (C criteria). It has earned a very strong 97 Earnings Per Share (EPS) rating. OLLI was last shown in this FSU section on 8/10/17 with an annotated graph under the headline, "Quietly Consolidating Above 50 Day Moving Average Near High". Fundamentals remain strong.
The Retail - Discount & Variety firm traded up as much as +40.5% since highlighted in yellow with new pivot point cited based on its 2/21/17 high plus 10 cents in the 3/27/17 mid-day report (read here). OLLI was first highlighted in yellow with a pivot point based on its 4/28/16 high plus 10 cents in 7/19/16 mid-day report (read here). OLLI completed its $16 IPO on 7/16/15. It completed a Secondary Offerings on 6/06/16 and 2/18/16. The number of top-rated funds owning its shares rose from 98 in Sep '15 to 383 in Jun '17, a reassuring sign concerning the I criteria. Its small supply of only 61.4 million shares outstanding (S criteria) can contribute to greater price volatility in the event of institutional buying or selling.
Charts courtesy www.stockcharts.com
Quietly Consolidating Above 50 Day Moving Average Near High - Thursday, August 10, 2017
Ollie's Bargain Outlet (OLLI -$0.75 or -1.70% to $43.45) fell for a 4th consecutive session, slumping near its 50-day moving average (DMA) line ($42.76). It recently has encountered distributional pressure after making limited headway above the latest pivot point with gains that lacked sufficient volume conviction to trigger a proper new (or add-on) technical buy signal. More damaging losses would raise concerns and trigger a technical sell signal.
OLLI was last shown in this FSU section on 6/29/17 with an annotated graph under the headline, "Recently Found Support Near 50-Day Moving Average". Fundamentals remain strong. Recently it reported Apr '17 quarterly earnings +25% on +17% sales revenues, meeting the +25% minimum earnings guideline (C criteria). It still has a very strong 96 Earnings Per Share (EPS) rating. The Retail - Discount & Variety firm traded up as much as +40.5% since highlighted in yellow with new pivot point cited based on its 2/21/17 high plus 10 cents in the 3/27/17 mid-day report (read here).
OLLI was first highlighted in yellow with a pivot point based on its 4/28/16 high plus 10 cents in 7/19/16 mid-day report (read here). OLLI completed its $16 IPO on 7/16/15. It completed a Secondary Offerings on 6/06/16 and 2/18/16. The number of top-rated funds owning its shares rose from 98 in Sep '15 to 372 in Jun '17, a reassuring sign concerning the I criteria. Its small supply of only 61.1 million shares outstanding (S criteria) can contribute to greater price volatility in the event of institutional buying or selling.
Charts courtesy www.stockcharts.com

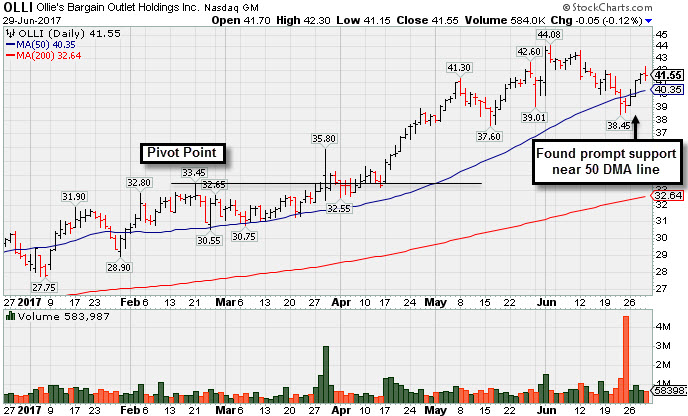
Recently Found Support Near 50-Day Moving Average - Thursday, June 29, 2017
Ollie's Bargain Outlet (OLLI -$0.05 or -0.12% to $41.55) recently rebounded above its 50-day moving average (DMA) line ($40.35) helping its outlook improve. Recent lows in the $37-38 area define near-term support to watch on pullbacks.
Fundamentals remain strong. Recently it reported Apr '17 quarterly earnings +25% on +17% sales revenues, meeting the +25% minimum earnings guideline (C criteria). It still has a very strong 96 Earnings Per Share (EPS) rating. The Retail - Discount & Variety firm traded up as much as +34.3% since highlighted in yellow with new pivot point cited based on its 2/21/17 high plus 10 cents in the 3/27/17 mid-day report (read here). OLLI was last shown in this FSU section on 5/19/17 with an annotated graph under the headline, "Retailer Rallied +25% in 2 Months Since Featured".
OLLI was first highlighted in yellow with a pivot point based on its 4/28/16 high plus 10 cents in 7/19/16 mid-day report (read here). OLLI completed its $16 IPO on 7/16/15. It completed a Secondary Offerings on 6/06/16 and 2/18/16. The number of top-rated funds owning its shares rose from 98 in Sep '15 to 355 in Mar '17, a reassuring sign concerning the I criteria. Its small supply of only 60.9 million shares outstanding (S criteria) can contribute to greater price volatility in the event of institutional buying or selling.
Charts courtesy www.stockcharts.com
Retailer Rallied +25% in 2 Months Since Featured - Friday, May 19, 2017
Ollie's Bargain Outlet (OLLI +$0.95 or +2.41% to $40.45) is challenging its all-time high. It is very extended from any sound base. Recently it reported earnings +22% on +16% sales revenues for the Jan '17 quarter, below the +25% minimum earnings guideline (C criteria), raising fundamental concerns. It still has a very strong 97 Earnings Per Share (EPS) rating. Results were above the +25% minimum earnings guideline for the prior 7 quarters. Its annual earnings (A criteria) history has been good.
Its 50 DMA line ($35.64) defines near-term support to watch. OLLI was last shown in this FSU section on 4/24/17 with an annotated graph under the headline, "Winning Streak Continues for Discount Retailer". The Retail - Discount & Variety firm traded up as much as +25.9% since highlighted in yellow with new pivot point cited based on its 2/21/17 high plus 10 cents in the 3/27/17 mid-day report (read here).
OLLI was first highlighted in yellow with a pivot point based on its 4/28/16 high plus 10 cents in 7/19/16 mid-day report (read here). OLLI completed its $16 IPO on 7/16/15. It completed a Secondary Offerings on 6/06/16 and 2/18/16. The number of top-rated funds owning its shares rose from 98 in Sep '15 to 355 in Mar '17, a reassuring sign concerning the I criteria. Its small supply of only 60.9 million shares outstanding (S criteria) can contribute to greater price volatility in the event of institutional buying or selling.
Charts courtesy www.stockcharts.com

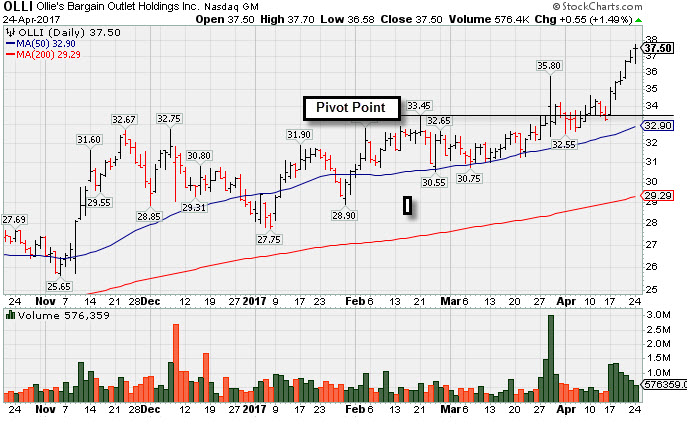
Winning Streak Continues for Discount Retailer - Monday, April 24, 2017
Ollie's Bargain Outlet (OLLI +$0.55 or +1.49% to $37.50) rallied further above its "max buy" level for a new all-time high with today's 6th consecutive gain. Bullish action has continued since reporting earnings +22% on +16% sales revenues for the Jan '17 quarter, below the +25% minimum earnings guideline (C criteria).
The Retail - Discount & Variety industry group has seen its Group Relative Strength Rating improve from 13 to 44 since OLLI was last shown in this FSU section on 3/27/16 with an annotated graph under the headline, "No Resistance Remains and Earnings News is Due".It was highlighted in yellow with new pivot point cited based on its 2/21/17 high plus 10 cents in the 3/27/17 mid-day report (read here).
Fundamentally, it has a very strong 97 Earnings Per Share (EPS) rating. It reported earnings +55% on +16% sales revenues for the Oct '16 quarter, continuing its strong earnings track record with results above the +25% minimum earnings guideline (C criteria) for a 7th consecutive quarter. Its annual earnings (A criteria) history has been good.
OLLI was first highlighted in yellow with a pivot point based on its 4/28/16 high plus 10 cents in 7/19/16 mid-day report (read here). OLLI completed its $16 IPO on 7/16/15. It completed a Secondary Offerings on 6/06/16 and 2/18/16. The number of top-rated funds owning its shares rose from 98 in Sep '15 to 344 in Mar '17, a reassuring sign concerning the I criteria. Its small supply of only 60.9 million shares outstanding (S criteria) can contribute to greater price volatility in the event of institutional buying or selling.
Charts courtesy www.stockcharts.com
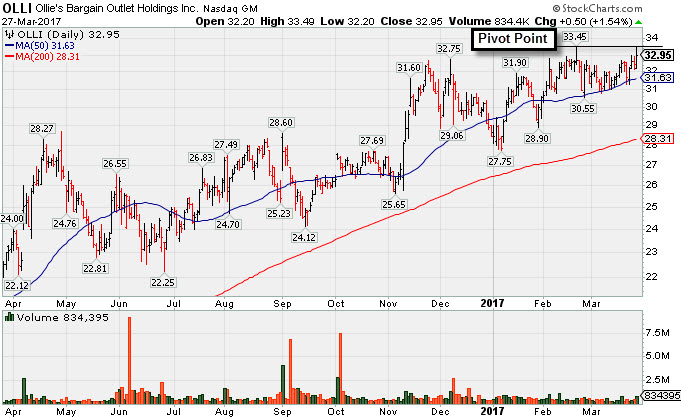
No Resistance Remains and Earnings News is Due - Monday, March 27, 2017
Ollie's Bargain Outlet (OLLI +$0.50 or +1.54% to $32.95) was highlighted in yellow with new pivot point cited based on its 2/21/17 high plus 10 cents in the earlier mid-day report (read here). It was noted - "A volume-driven gain for new highs may trigger a technical buy signal. Due to report Jan '17 quarterly results on Tuesday, March 28, 2017 after the market closes. Volume and volatility often increase near earnings news. Found support near its 50 DMA line ($31.63) during its orderly consolidation. Fundamentals remain strong and its Relative Strength rating has improved to 85, above the 80+ guideline for buy candidates, up from 72 when last noted and dropped from the Featured Stocks list on 1/05/17."
OLLI was last shown in this FSU section on 12/29/16 with an annotated graph under the headline, "Distributional Action Plus Slump Below 50-Day Moving Average". In the interim it rebounded above its 50-day moving average (DMA) line, helping its outlook improve, then made gradual progress marked by occasional volume-driven gains.
The Retail - Discount & Variety industry group has been lagging (L criteria) and currently has a very low Group Relative Strength Rating of only 13. Disciplined investors might look to find more favorable odds by choosing a leader in a high-ranked industry group. Fundamentally, it has a very strong 98 Earnings Per Share (EPS) rating. It reported earnings +55% on +16% sales revenues for the Oct '16 quarter, continuing its strong earnings track record with results above the +25% minimum earnings guideline (C criteria) for a 7th consecutive quarter. Its annual earnings (A criteria) history has been good.
OLLI was first highlighted in yellow with a pivot point based on its 4/28/16 high plus 10 cents in 7/19/16 mid-day report (read here). OLLI completed its $16 IPO on 7/16/15. It completed a Secondary Offerings on 6/06/16 and 2/18/16. The number of top-rated funds owning its shares rose from 98 in Sep '15 to 334 in Dec '16, a reassuring sign concerning the I criteria. Its small supply of only 60.6 million shares outstanding (S criteria) can contribute to greater price volatility in the event of institutional buying or selling.
Charts courtesy www.stockcharts.com
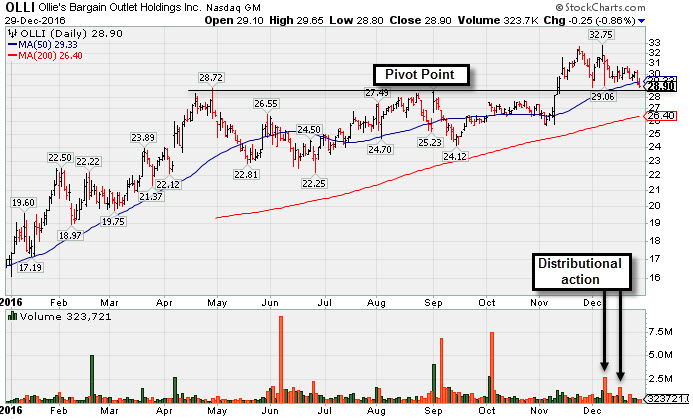
Distributional Action Plus Slump Below 50-Day Moving Average - Thursday, December 29, 2016
Ollie's Bargain Outlet (OLLI -$0.25 or -0.86% to $28.90) slumped further below its 50-day moving average (DMA) line ($29.33) with today's loss on light volume. Only a prompt rebound above the 50 DMA line would help its outlook improve. Its color code was changed to green as it was noted - "Further deterioration would raise greater concerns. Prior highs in the $28 area define important support to watch below its 50 DMA line." Some insider buying was reported in recent weeks after rallying to new highs, an encouraging sign.
The Retail-Discount and Variety firm was last shown in this FSU section on 11/28/16 with an annotated graph under the headline, "Pulling Back After Getting Extended More Than +5% Above Prior Highs". Recent weeks have shown distributional action, and few gains above the pivot point, when it rallied, were backed by significant volume beyond the +40% above average volume needed to trigger a proper technical buy signal. OLLI was first highlighted in yellow with a pivot point based on its 9/01/16 high plus 10 cents in 10/04/16 mid-day report (read here).
The Retail - Discount & Variety industry group has also been lagging (L criteria) and currently has a very low Group Relative Strength Rating of only 11. Disciplined investors might look to find more favorable odds by choosing a leader in a high-ranked industry group. Fundamentally, it has a very strong 98 Earnings Per Share (EPS) rating. It reported earnings +55% on +16% sales revenues for the Oct '16 quarter, continuing its strong earnings track record with results above the +25% minimum earnings guideline (C criteria) for a 7th consecutive quarter. Its annual earnings (A criteria) history has been good.
OLLI completed its $16 IPO on 7/16/15. It completed a Secondary Offerings on 6/06/16 and 2/18/16. The number of top-rated funds owning its shares rose from 98 in Sep '15 to 255 in Sep '16, a reassuring sign concerning the I criteria. Its small supply of only 60.6 million shares outstanding (S criteria) can contribute to greater price volatility in the event of institutional buying or selling.
Charts courtesy www.stockcharts.com
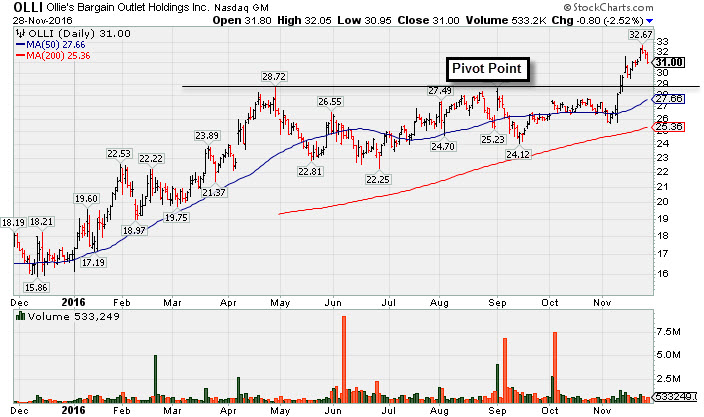
Pulling Back After Getting Extended More Than +5% Above Prior Highs - Monday, November 28, 2016
Ollie's Bargain Outlet (OLLI -$0.80 or -2.52% to $31.00) pulled back today for a 3rd consecutive loss on lighter than average volume since hitting a new all-time high last week. It is still above its "max buy" level. Recent gains above the pivot point lacked the +40% above average volume needed to trigger a proper technical buy signal. The Retail-Discount and Variety firm was last shown in this FSU section on 11/10/16 with an annotated graph under the headline, "Hit New High With Gain Lacking Great Volume Conviction". It was first highlighted in yellow with a pivot point based on its 9/01/16 high plus 10 cents in 10/04/16 mid-day report (read here).
The Retail - Discount & Variety industry group has also been lagging (L criteria) and currently has a very low Group Relative Strength Rating of only 13. Disciplined investors might look to find more favorable odds by choosing a leader in a high-ranked industry group. Fundamentally, it has a very strong 97 Earnings Per Share (EPS) rating. It reported earnings +50% on +16% sales revenues for the Jul '16 quarter, continuing its strong earnings track record with results above the +25% minimum earnings guideline (C criteria) for a 6th consecutive quarter. Its annual earnings (A criteria) history has been good.
OLLI completed its $16 IPO on 7/16/15. It completed a Secondary Offerings on 6/06/16 and 2/18/16. The number of top-rated funds owning its shares rose from 98 in Sep '15 to 249 in Sep '16, a reassuring sign concerning the I criteria. Its small supply of only 60.2 million shares outstanding (S criteria) can contribute to greater price volatility in the event of institutional buying or selling.
Charts courtesy www.stockcharts.com
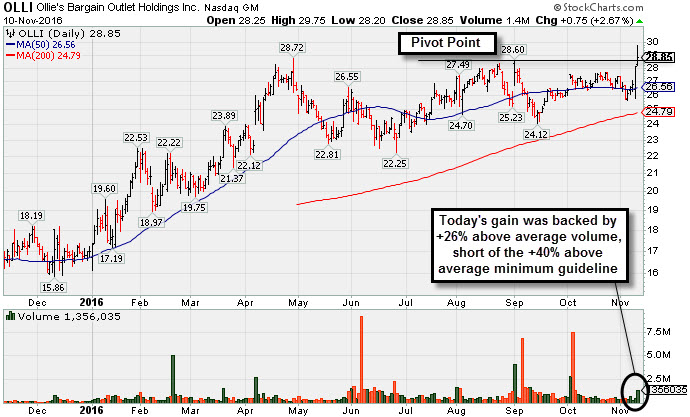
Hit New High With Gain Lacking Great Volume Conviction - Thursday, November 10, 2016
Ollie's Bargain Outlet (OLLI +$0.75 or +2.67% to $28.85) hit a new high with today's big gain backed by +26% above average volume. Gains above a stock's pivot point must have at least +40% above average volume to trigger a proper technical buy signal.
It reported earnings +50% on +16% sales revenues for the Jul '16 quarter, continuing its strong earnings track record with results above the +25% minimum earnings guideline (C criteria) for a 6th consecutive quarter. Its annual earnings (A criteria) history has been good. OLLI was last shown in this FSU section on 10/04/16 with an annotated graph under the headline, "Gapped Up on News Being Added to S&P 600 Small Cap Index", after a new pivot point was cited based on its 9/01/16 high plus 10 cents in the mid-day report (read here).
OLLI completed its $16 IPO on 7/16/15. The Retail-Discount and Variety firm completed a Secondary Offerings on 6/06/16 and 2/18/16. The number of top-rated funds owning its shares rose from 98 in Sep '15 to 235 in Sep '16, a reassuring sign concerning the I criteria. Its small supply of only 60.2 million shares outstanding (S criteria) can contribute to greater price volatility in the event of institutional buying or selling.
Charts courtesy www.stockcharts.com
Gapped Up on News Being Added to S&P 600 Small Cap Index - Tuesday, October 4, 2016
Ollie's Bargain Outlet (OLLI +$1.01 or +3.84% to $27.33) was highlighted in yellow with new pivot point cited based on its 9/01/16 high plus 10 cents in the earlier mid-day report (read here). It gapped up today rebounding well above its 50-day moving average (DMA) line with a considerable volume-driven gain on news it will replace Parkway Properties Inc. (PKY) in the S&P SmallCap 600 after the close on Wednesday, October 5th. OLLI was dropped from the Featured Stocks list on 9/14/16, and the rebound helped its outlook to improve. Members a reminded again - "Volume-driven gains above the pivot point are still needed to trigger a convincing technical buy signal."
The Retail-Discount and Variety firm completed a Secondary Offerings on 6/06/16 and 2/18/16. It reported earnings +50% on +16% sales revenues for the Jul '16 quarter, continuing its strong earnings track record with results above the +25% minimum earnings guideline (C criteria) for a 6th consecutive quarter. Its annual earnings (A criteria) history has been good.
It was last shown in this FSU section on 8/24/16 with an annotated graph under the headline, "Near High Awaiting Volume-Driven Gain to Trigger Technical Buy Signal".It was highlighted in yellow with pivot point cited based on its 4/28/16 high plus 10 cents in the 7/19/16 mid-day report (read here), but subsequent weakness led to it being dropped from the Featured Stocks list.
OLLI completed its $16 IPO on 7/16/15. The number of top-rated funds owning its shares rose from 98 in Sep '15 to 216 in Jun '16, a reassuring sign concerning the I criteria. Its small supply of only 60 million shares outstanding (S criteria) can contribute to greater price volatility in the event of institutional buying or selling.

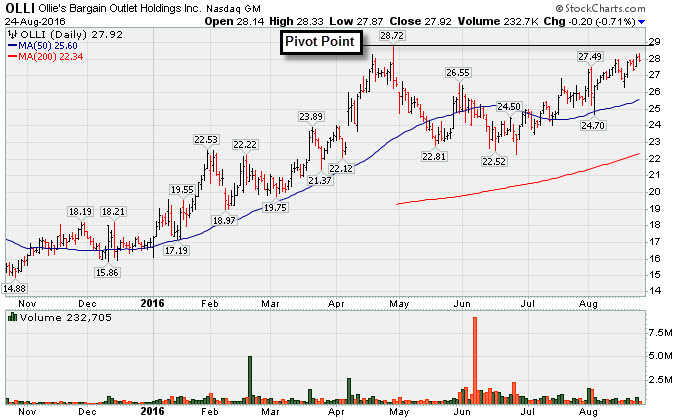
Near High Awaiting Volume-Driven Gain to Trigger Technical Buy Signal - Wednesday, August 24, 2016
Ollie's Bargain Outlet (OLLI +$0.20 or -0.71% to $27.92) pulled back today with very light volume. It managed its best-ever close with the prior gain backed by near average volume while rising within close striking distance of all-time highs. It was last shown in this FSU section on 7/19/16 with an annotated graph under the headline, "Retail Firm Approaching Pivot Point".It was highlighted in yellow with pivot point cited based on its 4/28/16 high plus 10 cents in the 7/19/16 mid-day report (read here) and members have been repeatedly reminded - "Volume-driven gains for new highs (N criteria) are still needed to trigger a technical buy signal."
It reported earnings +82% on +19% sales revenues for the Apr '16 quarter, continuing its strong earnings track record with results above the +25% minimum earnings guideline (C criteria) for a 5th consecutive quarter. Its annual earnings (A criteria) history has been good.
The Retail-Discount and Variety firm's shares have been consolidating in a tight trading range since it completed another Secondary Offering on 6/06/16. Such offerings often hinder upward price progress for the short term, yet they also help to attract more institutional sponsorship. It completed a Secondary Offering on 2/18/16, and it completed its $16 IPO on 7/16/15. The number of top-rated funds owning its shares rose from 98 in Sep '15 to 206 in Jun '16, a reassuring sign concerning the I criteria. Its small supply of only 60 million shares outstanding (S criteria) can contribute to greater price volatility in the event of institutional buying or selling.
Charts courtesy www.stockcharts.com
Retail Firm Approaching Pivot Point - Tuesday, July 19, 2016
Ollie's Bargain Outlet (OLLI +$0.45 or +1.75% to $26.15) was highlighted in yellow with pivot point cited based on its 4/28/16 high plus 10 cents in the earlier mid-day report (read here). Subsequent volume-driven gains for new highs (N criteria) are still needed to trigger a technical buy signal.
It reported earnings +82% on +19% sales revenues for the Apr '16 quarter, continuing its strong earnings track record with results above the +25% minimum earnings guideline (C criteria) for a 5th consecutive quarter. Its annual earnings (A criteria) history has been good.
The Retail-Discount and Variety firm's shares have been consolidating in a tight trading range since it completed another Secondary Offering on 6/06/16. Such offerings often hinder upward price progress for the short term, yet they also help to attract more institutional sponsorship. It completed a Secondary Offering on 2/18/16, and it completed its $16 IPO on 7/16/15. The number of top-rated funds owning its shares rose from 98 in Sep '15 to 179 in Jun '16, a reassuring sign concerning the I criteria. Its small supply of only 60 million shares outstanding (S criteria) can contribute to greater price volatility in the event of institutional buying or selling.
Charts courtesy www.stockcharts.com
