Hit New High but Ended Session Below the New Pivot Point Cited - Monday, January 27, 2025
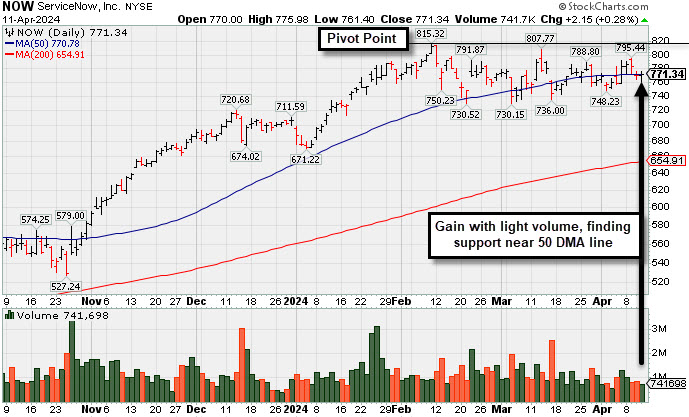
Quietly Consolidating Near 50-Day Moving Average Line - Thursday, April 11, 2024
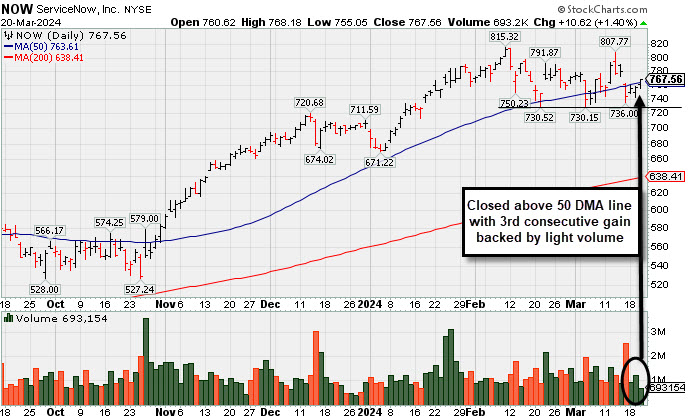
NOW Quietly Rebounded Above 50-Day Moving Average Line - Wednesday, March 20, 2024
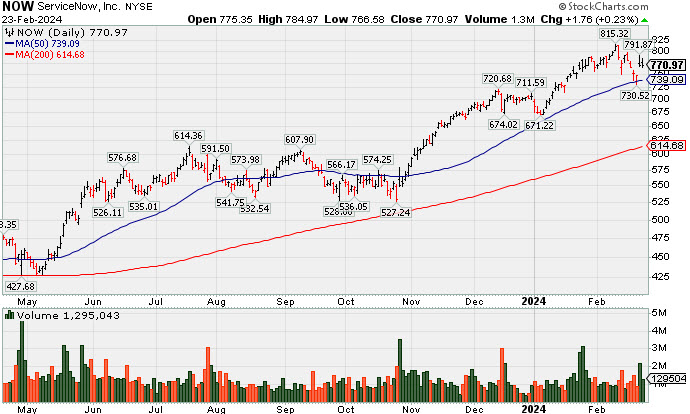
Found Support With a Solid Gap Up from 10-Week Moving Average - Friday, February 23, 2024
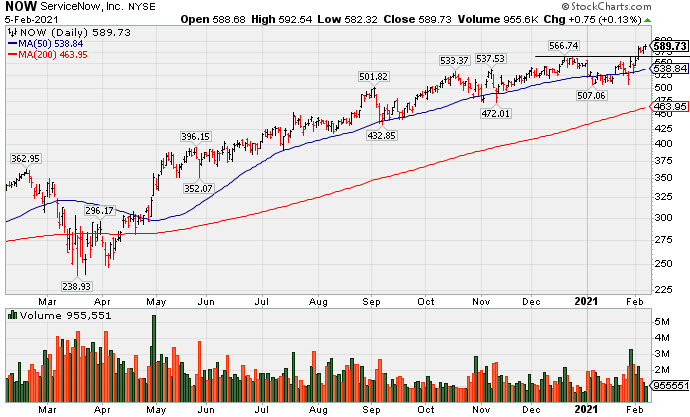
Hit New Highs With Latest Gains Backed by Light Volume - Friday, February 5, 2021
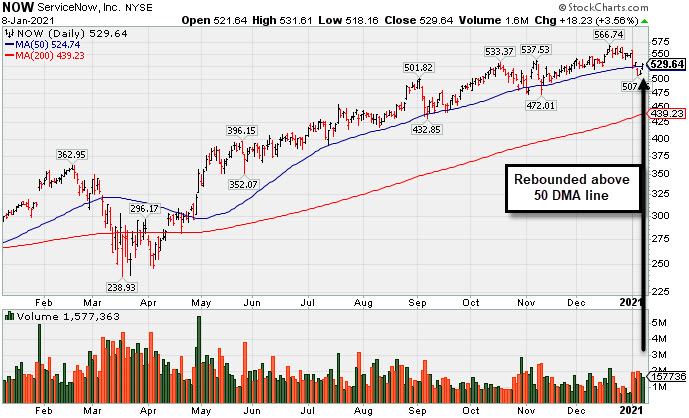
Gain Today and Rebound Above 50-Day Moving Average Line - Friday, January 8, 2021
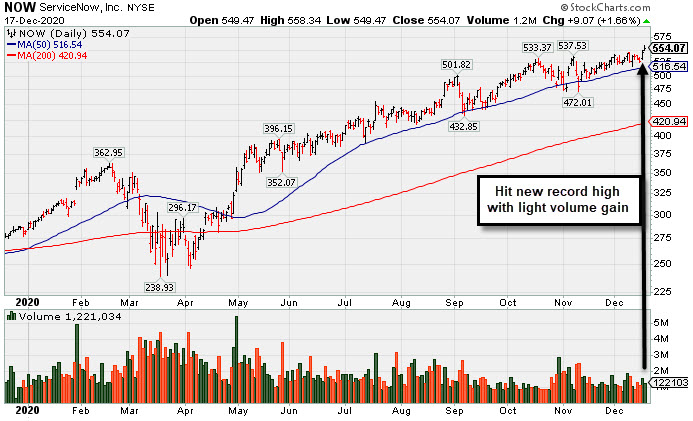
Hit New Record High With Light Volume Behind Gain - Thursday, December 17, 2020
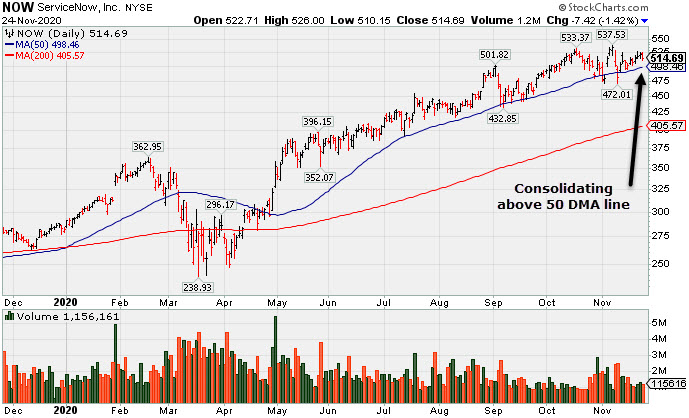
Consolidating Above 50-Day Average Still Perched Near All-Time High - Tuesday, November 24, 2020
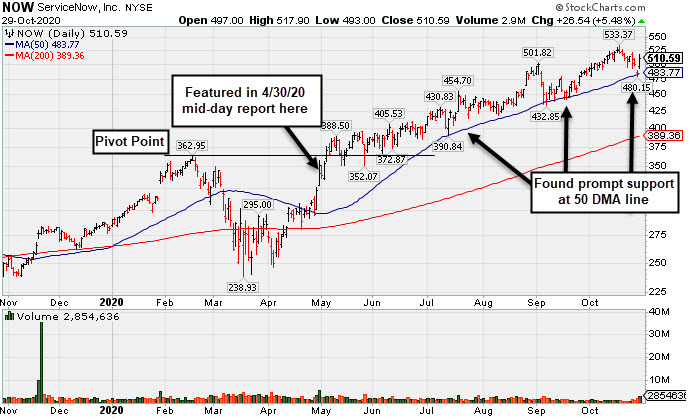
Found Prompt Support at 50 DMA Line After Earnings News - Thursday, October 29, 2020
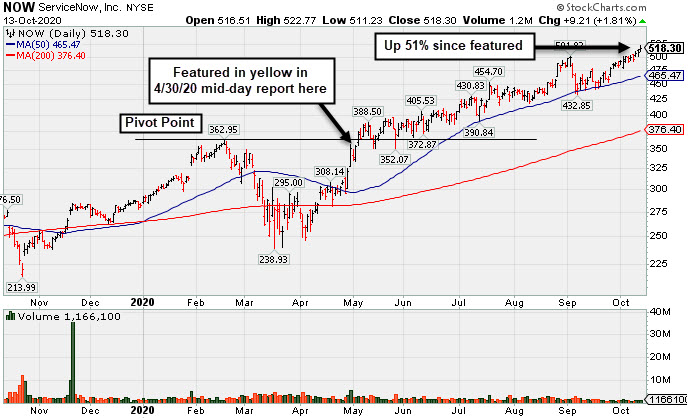
Record High With Light Volume Behind 3rd Consecutive Gain - Tuesday, October 13, 2020
Gain Back Above "Max Buy" Level for ServiceNow - Friday, September 25, 2020
Tested Support at 50-Day Moving Average Line - Monday, September 14, 2020
Quiet Gain to New High for Computer Software Firm - Friday, August 28, 2020
Consolidating Above 50-Day Average After Another Strong Quarter - Thursday, August 13, 2020
Perched Near All-Time High With Earnings News Due Next Week - Wednesday, July 22, 2020
Hovering Near All-Time High With Volume Totals Cooling - Thursday, June 25, 2020
Quiet Pullback Below "Max Buy" Level for NOW - Thursday, June 4, 2020
Consolidating Near Prior High After Wedging Into New High Ground - Thursday, May 14, 2020
Fundamental Strength Continues; Volume Heavy Behind Big Gain - Thursday, April 30, 2020
Slumped Below 50-Day Average With Loss on Higher Volume - Wednesday, July 31, 2019
Pulling Back After Wedging to New Highs - Wednesday, June 26, 2019
Leader Consolidating Above 50-Day Moving Average Line - Wednesday, May 29, 2019
Found Recent Support at 50-Day Moving Average - Monday, April 15, 2019
Pulling Back After 6 Straight Weekly Gains - Wednesday, March 6, 2019
Breakaway Gap Followed Strong Earnings Report - Friday, February 1, 2019
Found Support at 50-Day Average After Slump Into Prior Base - Wednesday, October 3, 2018
Slump Below 50-Day Average Line Raises Concerns - Friday, August 17, 2018
Recent Slump Below 50-Day Average Hurt Outlook - Tuesday, June 26, 2018
High-Ranked Software - Enterprise Firm is Near Pivot Point - Tuesday, May 8, 2018
There is 1 more featured stock write-up on since to 3/3/2025
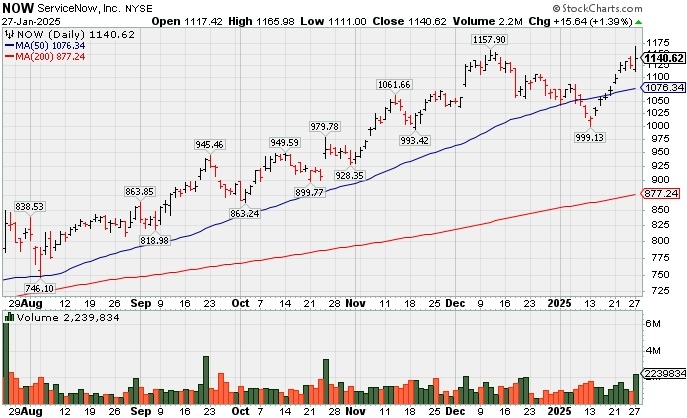
Hit New High but Ended Session Below the New Pivot Point Cited - Monday, January 27, 2025
ServiceNow Inc (NOW +$15.64 or +1.39% to $1,140.62) hit yet another new all-time high with today's gain backed by +84% above average volume, but it ended the session near the middle of its intra-day range and below the new pivot point. Its color code was changed to yellow when highlighted in the earlier mid-day report (read here) with new pivot point cited based on its 12/04/24 high plus 10 cents after a short flat base. NOW found prompt support after briefly undercutting its 50-day moving average (DMA) line ($1,076). A subsequent gain and strong close above the pivot point backed by at least +40% above average volume may clinch a proper new (or add-on) technical buy signal.
It has an Earnings oper Share Rating of 99 and fundamentals remain strong after it reported Sep '24 quarterly earnings +27% on +22% sales revenues versus the year-ago period. Annual earnings growth has been strong and steady. It was last shown in this FSU section on 4/11/24 with an annotated graph under the headline, "Quietly Consolidating Near 50-Day Moving Average Line", and it was dropped from the Featured Stocks list on 4/19/24. It repaired a 200 DMA line violation quickly and gradually rebounded and climbed into new high territory.
The Computer Software - Enterprise group is currently ranked 16th on the 197 Industry Groups list with a Group Relative Strength Rating of A+ (92). The number of top-rated funds owning its shares rose from 3,287 in Mar '23 to 4.327 in Dec '24, a reassuring sign concerning the I criteria. It has a Timeliness Rating of A and a Sponsorship Rating of A. Its current Up/Down Volume Ratio of 1.3 is an unbiased indication its shares have been under slight accumulation over the past 50 days.
Charts courtesy www.stockcharts.com
Symbol/Exchange
Company Name
Industry Group | PRICE | CHANGE
(%Change) | Day High | Volume
(% DAV)
(% 50 day avg vol) | 52 Wk Hi
% From Hi | Featured
Date | Price
Featured | Pivot Featured |
| Max Buy |
 GVA - NYSE GVA - NYSE
Granite Construction
Bldg-Heavy Construction | $86.23 | -5.26
-5.75% | $90.10 | 930,705
177.96% of 50 DAV
50 DAV is 523,000 | $105.20
-18.03%
| 6/11/2024 | $59.76 | PP = $64.33 |
| MB = $67.55 |
 Most Recent Note - 1/27/2025 6:36:42 PM Most Recent Note - 1/27/2025 6:36:42 PM
It will be dropped from the Featured Stocks list tonight. Volume was above average behind today''s big 4th consecutive loss while slumping well below its 50 DMA line ($93.62), testing near the prior low ($85.56 on 1/13/25) which defines the next important support. A "negative reversal" was noted on 12/05/24 back at its all-time high. Reported Sep ''24 quarterly earnings +19% on +14% sales revenues versus the year-ago period, repeatedly noted as "below the +25% minimum guideline (C criteria) of the fact-based investment system."
>>> FEATURED STOCK ARTICLE : Negative Reversal After Hitting New All-Time High - 12/6/2024 | View all notes | Set NEW NOTE alert | Company Profile | SEC News | Chart | Request a new note C A S I |
TXRH - NASDAQ
Texas Roadhouse Inc
LEISURE - Restaurants | $181.19 | +2.64
1.48% | $182.37 | 947,077
134.47% of 50 DAV
50 DAV is 704,300 | $206.04
-12.06%
| 7/26/2024 | $173.08 | PP = $175.82 |
| MB = $184.61 |
Most Recent Note - 1/27/2025 6:43:10 PM
G - Posted again today with +34% above average volume, finding support above its 200 DMA line ($174.70). Lingering below its 50 DMA line ($188) in recent weeks, a rebound above that important short-term average is needed for its outlook to improve.
>>> FEATURED STOCK ARTICLE : Lingering Below 50-Day Moving Average Line - 1/23/2025 | View all notes | Set NEW NOTE alert | Company Profile | SEC News | Chart | Request a new note C A S I |
HWM - NYSE
Howmet Aerospace
Aerospace/Defense | $122.08 | -4.95
-3.90% | $124.72 | 3,447,591
141.29% of 50 DAV
50 DAV is 2,440,000 | $129.10
-5.44%
| 1/8/2025 | $115.05 | PP = $120.81 |
| MB = $126.85 |
Most Recent Note - 1/27/2025 6:45:41 PM
Y - Gapped down today suffering a big volume-driven loss, retreating from its all-time high. Recent volume-driven gains above the pivot point triggered a new (or add-on) technical buy signal. Near-term support to watch is the prior high ($120.71 on 1/06/25) and its 50 DMA line ($116). Fundamentals remain strong.
>>> FEATURED STOCK ARTICLE : Extended From Prior Base and Perched at High - 12/5/2024 | View all notes | Set NEW NOTE alert | Company Profile | SEC News | Chart | Request a new note C A S I |
NGVC - NYSE
Natural Grocers
Retail-Super/Mini Mkts | $41.69 | +0.19
0.46% | $42.60 | 96,937
84.29% of 50 DAV
50 DAV is 115,000 | $47.57
-12.36%
| 11/5/2024 | $30.57 | PP = $30.42 |
| MB = $31.94 |
Most Recent Note - 1/27/2025 6:54:15 PM
G - Posted a gain today with below average volume, and it has been finding support recently at its 50 DMA line ($40.51). More damaging losses would raise serious concerns and trigger a worrisome technical sell signal. Reported Sep ''24 quarterly earnings +50% on +9% sales revenues versus the year-ago period.
>>> FEATURED STOCK ARTICLE : Consolidating After Considerable Rally to New Highs - 12/16/2024 | View all notes | Set NEW NOTE alert | Company Profile | SEC News | Chart | Request a new note C A S I |
CLS - NYSE
Celestica
Elec-Contract Mfg | $87.36 | -34.33
-28.21% | $107.73 | 16,968,609
751.49% of 50 DAV
50 DAV is 2,258,000 | $131.23
-33.43%
| 10/11/2024 | $57.62 | PP = $63.59 |
| MB = $66.77 |
Most Recent Note - 1/27/2025 6:32:28 PM
G - Gapped down today and abruptly retreated from its all-time high, violating its 50 DMA line ($95) with a damaging loss on heavy volume triggering a technical sell signal.
>>> FEATURED STOCK ARTICLE : New High After 6th Consecutive Gain - 1/22/2025 | View all notes | Set NEW NOTE alert | Company Profile | SEC News | Chart | Request a new note C A S I |
Symbol/Exchange
Company Name
Industry Group | PRICE | CHANGE
(%Change) | Day High | Volume
(% DAV)
(% 50 day avg vol) | 52 Wk Hi
% From Hi | Featured
Date | Price
Featured | Pivot Featured |
| Max Buy |
PAY - NYSE
Paymentus Holdings
Finance-CrdtCard/PmtPr | $29.90 | -0.49
-1.61% | $30.36 | 303,540
56.42% of 50 DAV
50 DAV is 538,000 | $38.94
-23.22%
| 1/3/2025 | $34.21 | PP = $38.94 |
| MB = $40.89 |
Most Recent Note - 1/27/2025 6:48:18 PM
It will be dropped from the Featured Stocks list tonight. Suffered a 4th consecutive loss today, slumping well below its 50 DMA line toward the prior low ($29.11 on 1/13/25). A rebound above the 50 DMA line is needed for its outlook to improve.
>>> FEATURED STOCK ARTICLE : Losses Below 50-Day Moving Average Hurt Outlook - 1/8/2025 | View all notes | Set NEW NOTE alert | Company Profile | SEC News | Chart | Request a new note C A S I |
RMD - NYSE
Resmed Inc
HEALTH SERVICES - Medical Appliances and Equipment | $254.70 | +4.19
1.67% | $258.70 | 1,252,848
162.12% of 50 DAV
50 DAV is 772,800 | $260.49
-2.22%
| 10/25/2024 | $256.64 | PP = $255.28 |
| MB = $268.04 |
Most Recent Note - 1/27/2025 6:49:51 PM
Y - Posted a solid volume-driven gain today nearly challenging its 52-week high. Faces very little near-term resistance due to overhead supply up to the $260 level. Its Relative Strength Rating is 82, above the 80+ minimum guideline for buy candidates.
>>> FEATURED STOCK ARTICLE : Recent Slump Below 50-Day Moving Average Raised Concerns - 11/18/2024 | View all notes | Set NEW NOTE alert | Company Profile | SEC News | Chart | Request a new note C A S I |
ATGE - NYSE
Adtalem Global Education
Consumer Svcs-Education | $97.20 | -2.42
-2.43% | $99.76 | 331,146
88.07% of 50 DAV
50 DAV is 376,000 | $100.54
-3.32%
| 12/31/2024 | $91.50 | PP = $93.03 |
| MB = $97.68 |
Most Recent Note - 1/27/2025 6:30:50 PM
G - Pulled back today with near average volume, retreating after wedging to new all-time highs above its "max buy" level. It did not produce gains above its pivot point with heavy enough volume to trigger a proper new (or add-on) technical buy signal. Its 50 DMA line ($91.72) defines initial support to watch. Fundamentals remain strong.
>>> FEATURED STOCK ARTICLE : Hovering Near High With Volume Totals Cooling - 12/4/2024 | View all notes | Set NEW NOTE alert | Company Profile | SEC News | Chart | Request a new note C A S I |
TW - NASDAQ
Tradeweb Markets
Financial Svcs-Specialty | $128.14 | -2.86
-2.18% | $130.00 | 807,354
94.54% of 50 DAV
50 DAV is 854,000 | $141.69
-9.56%
| 11/19/2024 | $134.41 | PP = $136.23 |
| MB = $143.04 |
Most Recent Note - 1/27/2025 6:41:16 PM
Gapped down today and it will be dropped from the Featured Stocks list tonight. It has been lingering below its 50 DMA line which has acted as resistance. Its Relative Strength Rating is 80, right at the 80+ minimum guideline for buy candidates. Prior lows in the $125 area define the next very important support level to watch. More damaging losses would raise serious concerns. A rebound above the 50 DMA line ($132) is needed for its outlook to improvE.
>>> FEATURED STOCK ARTICLE : Tradeweb Markets Perched Near High - 11/19/2024 | View all notes | Set NEW NOTE alert | Company Profile | SEC News | Chart | Request a new note C A S I |
ATAT - NASDAQ
Atour Lifestyle Hldgs ADR
Leisure-Lodging | $27.09 | -0.22
-0.81% | $27.63 | 859,907
69.52% of 50 DAV
50 DAV is 1,237,000 | $29.90
-9.40%
| 12/9/2024 | $29.34 | PP = $29.25 |
| MB = $30.71 |
Most Recent Note - 1/24/2025 11:56:09 PM
Y - Color code is changed to yellow after a solid rebound above its 50 DMA line helped its outlook to improve.
>>> FEATURED STOCK ARTICLE : Volume Above Average Behind Breakout Gain - 12/9/2024 | View all notes | Set NEW NOTE alert | Company Profile | SEC News | Chart | Request a new note C A S I |
Symbol/Exchange
Company Name
Industry Group | PRICE | CHANGE
(%Change) | Day High | Volume
(% DAV)
(% 50 day avg vol) | 52 Wk Hi
% From Hi | Featured
Date | Price
Featured | Pivot Featured |
| Max Buy |
CRAI - NASDAQ
CRA International
Comml Svcs-Consulting | $182.96 | -5.50
-2.92% | $187.97 | 31,791
93.50% of 50 DAV
50 DAV is 34,000 | $210.70
-13.17%
| 12/17/2024 | $208.34 | PP = $208.48 |
| MB = $218.90 |
Most Recent Note - 1/27/2025 6:38:49 PM
Still sputtering below its 50 DMA line which has acted as resistance, and it will be dropped from the Featured Stocks list tonight. A rebound above the 50 DMA line ($189) is needed for its outlook to improve. Its 200 DMA line ($174.74) and prior low define important near-term support. Fundamentals remain strong.
>>> FEATURED STOCK ARTICLE : Volume-Driven Gain for New High Triggered Technical Buy Signal - 12/17/2024 | View all notes | Set NEW NOTE alert | Company Profile | SEC News | Chart | Request a new note C A S I |
LRN - NYSE
Stride
Consumer Svcs-Education | $118.91 | -0.47
-0.39% | $120.86 | 960,176
138.75% of 50 DAV
50 DAV is 692,000 | $120.60
-1.40%
| 1/10/2025 | $114.31 | PP = $112.90 |
| MB = $118.55 |
Most Recent Note - 1/27/2025 6:53:09 PM
G - Color code is changed to green after it pulled back today with +39% above average volume following a streak of 7 consecutive gains with lackluster volume. It wedged above the pivot point cited based on its 12/04/24 high and hitting new all-time highs. Fundamentals remain strong. Prior high ($112.80 on 12/04/24) defines near-term support above its 50 DMA line ($107.73.
>>> FEATURED STOCK ARTICLE : Encountered Distributional Pressure Amid Broader Weakness - 1/10/2025 | View all notes | Set NEW NOTE alert | Company Profile | SEC News | Chart | Request a new note C A S I |
HUBS - NYSE
HubSpot
Comp Sftwr-Spec Enterprs | $758.43 | +31.82
4.38% | $779.73 | 892,884
202.47% of 50 DAV
50 DAV is 441,000 | $762.47
-0.53%
| 1/27/2025 | $768.96 | PP = $762.57 |
| MB = $800.70 |
Most Recent Note - 1/27/2025 1:12:53 PM
Y - Color code is changed to yellow with new pivot point cited based on its 12/04/24 high plus 10 cents. Rallying from support near its 50 DMA line ($716) and hitting a new 52-week high with today's big volume-driven gain. A gain and strong close above the pivot point may clinch a technical buy signal. Fundamentals remain strong. It went through a deep consolidation and rebounded since dropped from the Featured Stocks list when last noted on 5/02/24.
>>> FEATURED STOCK ARTICLE : HUBS Testing 50-day Moving Average Line Again - 4/25/2024 | View all notes | Set NEW NOTE alert | Company Profile | SEC News | Chart | Request a new note C A S I |
NOW - NYSE
ServiceNow
Computer Sftwr-Enterprse | $1,140.62 | +15.64
1.39% | $1,165.98 | 2,239,778
184.50% of 50 DAV
50 DAV is 1,214,000 | $1,157.90
-1.49%
| 1/27/2025 | $771.75 | PP = $1,158.00 |
| MB = $1,215.90 |
Most Recent Note - 1/27/2025 1:25:30 PM
Y - Hitting yet another new all-time high with today's volume-driven gain. Color code is changed to yellow with new pivot point cited based on its 12/04/24 high plus 10 cents after a short flat base. Found prompt support after briefly undercutting its 50 DMA line ($1,076). A gain and strong close above the pivot point backed by at least +40% above average volume may clinch a new (or add-on) technical buy signal. Fundamentals remain strong after it reported Sep '24 quarterly earnings +27% on +22% sales revenues versus the year-ago period. It was dropped from the Featured Stocks list on 4/19/24.
>>> FEATURED STOCK ARTICLE : Hit New High but Ended Session Below the New Pivot Point Cited - 1/27/2025 | View all notes | Set NEW NOTE alert | Company Profile | SEC News | Chart | Request a new note C A S I |
Quietly Consolidating Near 50-Day Moving Average Line - Thursday, April 11, 2024
ServiceNow Inc (NOW +$2.15 or +0.28% to $771.34) posted a small gain with light volume, finding support near its 50-day moving average (DMA) line. It remains perched within striking distance of its pivot point cited based on its 2/09/24 high. Recent lows define important near-term support to watch where more damaging losses would raise greater concerns.
The Computer Software - Enterprise group is currently ranked 61st on the 197 Industry Groups list with a Group Relative Strength Rating of B+ (69). NOW was highlighted in yellow in the 2/22/24 mid-day report (read here). It was last shown in this FSU section on 3/20/24 with an annotated graph under the headline, "NOW Quietly Rebounded Above 50-Day Moving Average Line".
NOW has a 99 Earnings Per Share Rating. It reported Dec '23 quarterly earnings +36% on +26% sales revenues versus the year-ago period, its 6th quarterly comparison above the +25% minimum guideline (C criteria) of the fact-based investment system. Annual earnings growth has been strong and steady.
The number of top-rated funds owning its shares rose from 3,287 in Mar '23 to 3,864 in Mar '24, a reassuring sign concerning the I criteria. It has a Timeliness Rating of A and a Sponsorship Rating of B. Its current Up/Down Volume Ratio of 1.2 is an unbiased indication its shares have been under slight accumulation over the past 50 days.
NOW Quietly Rebounded Above 50-Day Moving Average Line - Wednesday, March 20, 2024
ServiceNow Inc (NOW +$9.97 or +1.32% to $766.91) rebounded and closed back above its 50-day moving average (DMA) line with light volume behind today's 3rd consecutive gain. It found support above prior lows in the $730 area. It faces some near-term resistance due to overhead supply up to the $815 level.
The Computer Software - Enterprise group is currently ranked 41st on the 197 Industry Groups list with a Group Relative Strength Rating of A- (79). NOW was highlighted in yellow in the 2/22/24 mid-day report (read here). It was last shown in this FSU section on 2/23/24 with an annotated graph under the headline, "Found Support With a Solid Gap Up from 10-Week Moving Average".
NOW has a 99 Earnings Per Share Rating. It reported Dec '23 quarterly earnings +36% on +26% sales revenues versus the year-ago period, its 6th quarterly comparison above the +25% minimum guideline (C criteria) of the fact-based investment system. Annual earnings growth has been strong and steady.
The number of top-rated funds owning its shares rose from 3,287 in Mar '23 to 3,739 in Dec '23, a reassuring sign concerning the I criteria. It has a Timeliness Rating of A and a Sponsorship Rating of B. Its current Up/Down Volume Ratio of 1.8 is an unbiased indication its shares have been under slight accumulation over the past 50 days.
Charts courtesy www.stockcharts.com
Symbol/Exchange
Company Name
Industry Group | PRICE | CHANGE
(%Change) | Day High | Volume
(% DAV)
(% 50 day avg vol) | 52 Wk Hi
% From Hi | Featured
Date | Price
Featured | Pivot Featured |
| Max Buy |
ANET - N
Arista Networks
Computer-Networking | $296.58 | +9.66
3.37% | $296.76 | 3,276,200
127.03% of 50 DAV
50 DAV is 2,579,000 | $292.66
1.34%
| 3/18/2024 | $188.84 | PP = $292.76 |
| MB = $307.40 |
Most Recent Note - 3/19/2024 12:08:07 PM
Y - Slumping toward its 50 DMA line after a gap down today, abruptly retreating following a solid volume-driven gain on the prior session for a best-ever close. Color code was changed to yellow after forming a new flat base. Found support at its 50 DMA line ($268.66) during its ongoing ascent. Recently noted with caution - "It may be considered a riskier late-stage base, however, a gain above the pivot point backed by at least +80% above average volume may trigger a new technical buy signal."
>>> FEATURED STOCK ARTICLE : Best Ever Close for Arista Networks - 3/1/2024 | View all notes | Set NEW NOTE alert | Company Profile | SEC News | Chart | Request a new note C A S I |
NVO - N
Novo Nordisk ADR
Medical-Ethical Drugs | $130.36 | -1.01
-0.77% | $131.43 | 4,374,691
81.00% of 50 DAV
50 DAV is 5,401,000 | $138.28
-5.73%
| 3/1/2024 | $124.23 | PP = $124.97 |
| MB = $131.22 |
Most Recent Note - 3/19/2024 11:24:40 AM
G - Volume totals have been cooling while stubbornly holding its ground after rallying from a noted new advanced "3-weeks tight" base with big volume-driven gains. Recent lows in the $118 area define important support to watch coinciding with its 50 DMA line ($118.76).
>>> FEATURED STOCK ARTICLE : Perched at All-Time High After Rallying from Advanced "3-Weeks Tight" - 3/12/2024 | View all notes | Set NEW NOTE alert | Company Profile | SEC News | Chart | Request a new note C A S I |
AXON - N
Axon Enterprise
Security/Sfty | $314.35 | +2.22
0.71% | $314.51 | 298,448
60.29% of 50 DAV
50 DAV is 495,000 | $325.63
-3.46%
| 11/8/2023 | $127.84 | PP = $223.30 |
| MB = $234.47 |
Most Recent Note - 3/20/2024 5:06:33 PM
G - Posted a 4th consecutive small gain today with lighter volume, still hovering near its all-time high. Bullish action came after it reported Dec ''23 quarterly earnings +60% on +29% sales revenues versus the year-ago period. Its 50-day moving average (DMA) line ($276) defines near-term support to watch.
>>> FEATURED STOCK ARTICLE : Hovering Near All-Time High; Spiked Higher Following Earnings - 3/14/2024 | View all notes | Set NEW NOTE alert | Company Profile | SEC News | Chart | Request a new note C A S I |
TDG - N
TransDigm Group
Aerospace/Defense | $1,214.98 | +14.06
1.17% | $1,217.00 | 203,293
91.99% of 50 DAV
50 DAV is 221,000 | $1,207.58
0.61%
| 12/12/2023 | $1,000.39 | PP = $1,013.18 |
| MB = $1,063.84 |
Most Recent Note - 3/20/2024 5:05:42 PM
G - Posted a 3rd consecutive gain today back by light volume, wedging to a new all-time high after 3 weeks of tight closes. Its 50 DMA line ($1,127) defines near-term support to watch.
>>> FEATURED STOCK ARTICLE : Perched in Tight Range Encountering Distribtion Near All-Time High - 3/15/2024 | View all notes | Set NEW NOTE alert | Company Profile | SEC News | Chart | Request a new note C A S I |
CRWD - N
CrowdStrike Holdings
Computer Sftwr-Security | $326.87 | +6.01
1.87% | $328.47 | 2,505,474
58.53% of 50 DAV
50 DAV is 4,281,000 | $365.00
-10.45%
| 1/2/2024 | $246.42 | PP = $261.91 |
| MB = $275.01 |
Most Recent Note - 3/19/2024 11:22:46 AM
G - Pulling back toward its 50 DMA ($308) which recently acted as support. It has not formed a sound base of sufficient length. Fundamentals remain strong after it reported Jan ''24 quarterly earnings +102% on +33% sales revenues versus the year-ago period.
>>> FEATURED STOCK ARTICLE : Encountered Distributional Pressure After Spiking to New High - 3/11/2024 | View all notes | Set NEW NOTE alert | Company Profile | SEC News | Chart | Request a new note C A S I |
Symbol/Exchange
Company Name
Industry Group | PRICE | CHANGE
(%Change) | Day High | Volume
(% DAV)
(% 50 day avg vol) | 52 Wk Hi
% From Hi | Featured
Date | Price
Featured | Pivot Featured |
| Max Buy |
ELF - N
e.l.f. Beauty
Cosmetics/Personal Care | $200.54 | +9.87
5.18% | $201.41 | 1,091,304
69.78% of 50 DAV
50 DAV is 1,564,000 | $221.83
-9.60%
| 1/2/2024 | $138.23 | PP = $153.63 |
| MB = $161.31 |
Most Recent Note - 3/19/2024 11:21:25 AM
G - Gapped down today, on track for a 4th consecutive loss after getting very extended from any sound base. Its 50 DMA line ($177.69) defines important near-term support to watch. Fundamentals remain strong.
>>> FEATURED STOCK ARTICLE : Encountering Distributional Pressure Near All-Time High - 3/8/2024 | View all notes | Set NEW NOTE alert | Company Profile | SEC News | Chart | Request a new note C A S I |
PCAR - N
Paccar
Trucks and Parts-Hvy Duty | $121.42 | +0.42
0.35% | $121.88 | 2,534,448
107.67% of 50 DAV
50 DAV is 2,354,000 | $121.23
0.16%
| 1/23/2024 | $100.35 | PP = $98.57 |
| MB = $103.50 |
Most Recent Note - 3/20/2024 5:03:43 PM
G - Hit yet another new all-time high with today's 4th consecutive gain. Its 50 DMA line ($106.73) defines near-term support to watch on pullbacks. Fundamentals remain strong.
>>> FEATURED STOCK ARTICLE : Extended From Any Sound Base After 7 Weekly Gains - 2/26/2024 | View all notes | Set NEW NOTE alert | Company Profile | SEC News | Chart | Request a new note C A S I |
HUBB - N
Hubbell
Electrical-Power/Equipmt | $406.65 | +9.94
2.51% | $408.08 | 388,419
89.70% of 50 DAV
50 DAV is 433,000 | $404.15
0.62%
| 1/30/2024 | $343.26 | PP = $336.83 |
| MB = $353.67 |
Most Recent Note - 3/18/2024 5:07:24 PM
G - Perched at its all-time high, very extended from the previously noted base. Its 50 DMA line ($356.47) defines important support to watch on pullbacks.
>>> FEATURED STOCK ARTICLE : Inched to New Highs With Average Volume - 2/28/2024 | View all notes | Set NEW NOTE alert | Company Profile | SEC News | Chart | Request a new note C A S I |
MANH - N
Manhattan Associates
Computer Sftwr-Enterprse | $251.14 | +3.54
1.43% | $251.30 | 433,785
116.61% of 50 DAV
50 DAV is 372,000 | $266.94
-5.92%
| 1/31/2024 | $240.57 | PP = $230.71 |
| MB = $242.25 |
Most Recent Note - 3/18/2024 5:08:57 PM
G - Halted its slide with a small gain today on light volume following 3 straight losses marked by above-average volume. It is extended from the previously noted base. Its 50 DMA line ($238) defines near-term support to watch above prior highs in the $230 area.
>>> FEATURED STOCK ARTICLE : Hovering Near All-Time High After Streak of Small Gains - 2/29/2024 | View all notes | Set NEW NOTE alert | Company Profile | SEC News | Chart | Request a new note C A S I |
USLM - N
U.S. Lime & Minerals
Bldg-Cement/Concrt/Ag | $300.26 | -0.97
-0.32% | $303.16 | 20,422
92.83% of 50 DAV
50 DAV is 22,000 | $302.72
-0.81%
| 2/9/2024 | $254.68 | PP = $265.09 |
| MB = $278.34 |
Most Recent Note - 3/19/2024 6:59:14 PM
G - Big gain today for a new all-time high was backed by +55% above average volume, getting more extended from the previously noted base. Prior highs in the $265-266 area define initial near-term support to watch on pullbacks.
>>> FEATURED STOCK ARTICLE : Hit New All Time High With Light Volume Behind 5th Straight Gain - 3/13/2024 | View all notes | Set NEW NOTE alert | Company Profile | SEC News | Chart | Request a new note C A S I |
Symbol/Exchange
Company Name
Industry Group | PRICE | CHANGE
(%Change) | Day High | Volume
(% DAV)
(% 50 day avg vol) | 52 Wk Hi
% From Hi | Featured
Date | Price
Featured | Pivot Featured |
| Max Buy |
NOW - N
ServiceNow
Computer Sftwr-Enterprse | $767.56 | +10.62
1.40% | $768.18 | 698,118
53.95% of 50 DAV
50 DAV is 1,294,000 | $815.32
-5.86%
| 2/22/2024 | $771.75 | PP = $815.32 |
| MB = $856.09 |
Most Recent Note - 3/20/2024 5:02:22 PM
Y - Rebounded and closed above its 50 DMA line ($763.61) helping its outlook improve with today''s 3rd consecutive gain backed by light volume and its color code is changed to yellow. Prior lows in the $730 area define the next important near-term support to watch. See the latest FSU analysis for more details and a new annotated graph.
>>> FEATURED STOCK ARTICLE : NOW Quietly Rebounded Above 50-Day Moving Average Line - 3/20/2024 | View all notes | Set NEW NOTE alert | Company Profile | SEC News | Chart | Request a new note C A S I |
SNPS - N
Synopsys
Computer Sftwr-Design | $590.03 | +5.32
0.91% | $598.00 | 1,129,091
85.21% of 50 DAV
50 DAV is 1,325,000 | $629.38
-6.25%
| 2/22/2024 | $600.65 | PP = $582.85 |
| MB = $611.99 |
Most Recent Note - 3/19/2024 6:57:33 PM
Y - Posted a big gain today with +14% above-average volume, finding support above its 50 DMA line ($550). Volume totals had cooled in recent weeks while consolidating. Previously noted - " A strong volume-driven gain and close above the pivot point is needed to clinch a proper technical buy signal. See the latest FSU analysis for more details and a new annotated graph.
>>> FEATURED STOCK ARTICLE : Rallying From Support at 50-Day Moving Average Line - 3/19/2024 | View all notes | Set NEW NOTE alert | Company Profile | SEC News | Chart | Request a new note C A S I |
PAY - N
Paymentus Holdings
Finance-CrdtCard/PmtPr | $24.13 | +1.74
7.77% | $24.39 | 616,246
207.49% of 50 DAV
50 DAV is 297,000 | $24.99
-3.44%
| 3/5/2024 | $19.97 | PP = $18.89 |
| MB = $19.83 |
Most Recent Note - 3/20/2024 12:44:21 PM
G - Posting a volume-driven gain today rebounding near its 52-week high. Very extended from the previously noted base. Prior highs in the $18 range define important initial support to watch on pullbacks.
>>> FEATURED STOCK ARTICLE : Big Gap Up Gain Triggered Technical Buy Signal - 3/5/2024 | View all notes | Set NEW NOTE alert | Company Profile | SEC News | Chart | Request a new note C A S I |
Found Support With a Solid Gap Up from 10-Week Moving Average - Friday, February 23, 2024
ServiceNow Inc (NOW +$1.76 or +0.23% to $770.97) was highlighted in yellow in the 2/22/24 mid-day report (read here) as it was noted that a valid secondary buy point exists up to +5% above the latest high after finding support at its 10 WMA line following an earlier breakout.
NOW has a 99 Earnings Per Share Rating. It reported Dec '23 quarterly earnings +36% on +26% sales revenues versus the year-ago period, its 6th quarterly comparison above the +25% minimum guideline (C criteria) of the fact-based investment system. Annual earnings growth has been strong and steady.
The number of top-rated funds owning its shares rose from 3,287 in Mar '23 to 3,721 in Dec '23, a reassuring sign concerning the I criteria. It has a Timeliness Rating of A and a Sponsorship Rating of B. Its current Up/Down Volume Ratio of 1.7 is an unbiased indication its shares have been under slight accumulation over the past 50 days.
Hit New Highs With Latest Gains Backed by Light Volume - Friday, February 5, 2021
ServiceNow Inc (NOW +$0.75 or +0.13% to $589.73) hit new 52-week and all-time highs with today's quiet gain. Gains this week cleared a new 6-week flat base. A new pivot point was not cited due to fundamental concerns noted as its impressive rally has continued. It gapped up on 1/28/21 promptly rebounding above its 50-day moving average (DMA) line ($538.84). But fundamental concerns remain after it reported Dec '20 quarterly earnings +22% on +31% sales revenues versus the year ago period, its 2nd consecutive comparison below the +25% minimum guideline (C criteria) of the fact-based investment system.
A slump in the group has raised some concerns regarding the L criteria. The Computer Software - Enterprise group currently has a Group Relative Strength Rating of B- (52). It was last shown in this FSU section on 1/08/21 with an annotated graph under the headline, "Gain Today and Rebound Above 50-Day Moving Average Line"
It reported Jun '20 quarterly earnings +73% on +28% sales revenues versus the year ago period and prior results had been routinely above the +25% minimum earnings guideline (C criteria). It has an Earnings Per Share Rating of 97. NOW has a new CEO as of 1/01/20.
NOW traded up as much as +65.2% since first highlighted in yellow in the 4/30/20 mid-day report with a pivot point based on its 2/19/20 high plus 10 cents (read here). The number of top-rated funds owning its shares rose from 1,030 in Jun '17 to 2.509 in Dec '20, a reassuring sign concerning the I criteria. It has a Timeliness Rating of B and a Sponsorship Rating of B. Its current Up/Down Volume Ratio of 1.2 is an unbiased indication its shares have been under slight accumulation over the past 50 days.
Gain Today and Rebound Above 50-Day Moving Average Line - Friday, January 8, 2021
ServiceNow Inc (NOW +$18.23 or +3.56% to $529.64) volume was near average behind today's big gain as it rebounded above its 50-day moving average (DMA) line ($524) helping its outlook improve. Recently it reported Sep '20 quarterly earnings +22% on +30% sales revenues versus the year ago period, below the +25% minimum guideline (C criteria) of the fact-based investment system, raising fundamental concerns.
A slump in the group has raised some concerns regarding the L criteria. The Computer Software - Enterprise group currently has a Group Relative Strength Rating of D+ (24), down from B- (52) when last shown in this FSU section on 12/17/20 with an annotated graph under the headline, "Hit New Record High With Light Volume Behind Gain".
It reported Jun '20 quarterly earnings +73% on +28% sales revenues versus the year ago period and prior results had been routinely above the +25% minimum earnings guideline (C criteria). It has an Earnings Per Share Rating of 98. NOW has a new CEO as of 1/01/20.
NOW traded up as much as +65.2% since first highlighted in yellow in the 4/30/20 mid-day report with a pivot point based on its 2/19/20 high plus 10 cents (read here). The number of top-rated funds owning its shares rose from 1,030 in Jun '17 to 2.470 in Sep '20, a reassuring sign concerning the I criteria. It has a Timeliness Rating of B and a Sponsorship Rating of A. Its current Up/Down Volume Ratio of 1.2 is an unbiased indication its shares have been under slight accumulation over the past 50 days.
Hit New Record High With Light Volume Behind Gain - Thursday, December 17, 2020
ServiceNow Inc (NOW +$9.07 or +1.66% to $554.07) posted a gain today with light volume for a new all-time high. It found prompt support near its 50-day moving average (DMA) line ($516.52) and stubbornly held its ground in recent weeks. Recently it reported Sep '20 quarterly earnings +22% on +30% sales revenues versus the year ago period, below the +25% minimum guideline (C criteria) of the fact-based investment system.
It reported Jun '20 quarterly earnings +73% on +28% sales revenues versus the year ago period and prior results had been routinely above the +25% minimum earnings guideline (C criteria). It has an Earnings Per Share Rating of 98. The Computer Software - Enterprise group has a Group Relative Strength Rating of B- (52). NOW has a new CEO as of 1/01/20.
NOW traded up as much as +61.5% since first highlighted in yellow in the 4/30/20 mid-day report with a pivot point based on its 2/19/20 high plus 10 cents (read here). It was last shown in this FSU section on 11/24/20 with an annotated graph under the headline, ""Consolidating Above 50-Day Average Still Perched Near All-Time High". The number of top-rated funds owning its shares rose from 1,030 in Jun '17 to 2.489 in Sep '20, a reassuring sign concerning the I criteria. It has a Timeliness Rating of B and a Sponsorship Rating of A. Its current Up/Down Volume Ratio of 1.1 is an unbiased indication its shares have been under slight accumulation over the past 50 days.
Consolidating Above 50-Day Average Still Perched Near All-Time High - Tuesday, November 24, 2020
ServiceNow Inc (NOW -$7.42 or -1.42% to $514.69) is consolidating above its 50-day moving average (DMA) line ($498.46) while still hovering near its all-time high. It recently retested the prior low ($472 on 11/03/20) noted as important support where a damaging violation raises greater concerns.
Recently it reported Sep '20 quarterly earnings +22% on +30% sales revenues versus the year ago period, below the +25% minimum guideline (C criteria) of the fact-based investment system. It reported Jun '20 quarterly earnings +73% on +28% sales revenues versus the year ago period and prior results had been routinely above the +25% minimum earnings guideline (C criteria). It has an Earnings Per Share Rating of 98. The Computer Software - Enterprise group has a Group Relative Strength Rating of 71, a reassuring sign concerning the L criteria. NOW has a new CEO as of 1/01/20.
NOW traded up as much as +56.7% since first highlighted in yellow in the 4/30/20 mid-day report with a pivot point based on its 2/19/20 high plus 10 cents (read here). It was last shown in this FSU section on 10/29/20 with an annotated graph under the headline, "Found Prompt Support at 50 DMA Line After Earnings News". The number of top-rated funds owning its shares rose from 1,030 in Jun '17 to 2.455 in Sep '20, a reassuring sign concerning the I criteria. It has a Timeliness Rating of B and a Sponsorship Rating of A. Its current Up/Down Volume Ratio of 1.1 is an unbiased indication its shares have been under slight accumulation over the past 50 days.
Found Prompt Support at 50 DMA Line After Earnings News - Thursday, October 29, 2020
ServiceNow Inc (NOW +$26.54 or +5.48% to $510.59) posted a solid volume-driven gain today. It reported Sep '20 quarterly earnings +22% on +30% sales revenues versus the year ago period, below the +25% minimum guideline (C criteria) of the fact-based investment system. It gapped up after testing and finding prompt support at its 50-day moving average (DMA) line ($483.77) with 3 consecutive volume-driven losses. Subsequent losses below the 50 DMA line and prior low ($432.85 on 9/08/20) would raise concerns and trigger technical sell signals.
It reported Jun '20 quarterly earnings +73% on +28% sales revenues versus the year ago period prior results had been routinely above the +25% minimum earnings guideline (C criteria). It has an Earnings Per Share Rating of 99. The Computer Software - Enterprise group has a Group Relative Strength Rating of 96, a reassuring sign concerning the L criteria. NOW has a new CEO as of 1/01/20.
NOW traded up as much as +55.4% since first highlighted in yellow in the 4/30/20 mid-day report with a pivot point based on its 2/19/20 high plus 10 cents (read here). It was last shown in this FSU section on 10/13/20 with an annotated graph under the headline, "Record High With Light Volume Behind 3rd Consecutive Gain". The number of top-rated funds owning its shares rose from 1,030 in Jun '17 to 2.396 in Sep '20, a reassuring sign concerning the I criteria. It has a Timeliness Rating of A and a Sponsorship Rating of A. Its current Up/Down Volume Ratio of 0.8 is an unbiased indication its shares have been under distributional pressure over the past 50 days.
Record High With Light Volume Behind 3rd Consecutive Gain - Tuesday, October 13, 2020
ServiceNow Inc (NOW +$9.21 or +1.81% to $518.30) posted a gain 3rd consecutive today with below average volume for yet another new all-time high. Found support at its 50-day moving average (DMA) line ($465.49) during the recent consolidation but did not form a new base of sufficient length. Fundamentals remain strong. Any losses below the 50 DMA line and prior low ($432.85 on 9/08/20) would raise concerns and trigger technical sell signals.
Keep in mind it is due to report Sep '20 quarterly results on 10/28/20. It reported Jun '20 quarterly earnings +73% on +28% sales revenues versus the year ago period. Results have been routinely above the +25% minimum earnings guideline (C criteria). It has an Earnings Per Share Rating of 99. The Computer Software - Enterprise group has a Group Relative Strength Rating of 93, a reassuring sign concerning the L criteria. NOW has a new CEO as of 1/01/20.
NOW is up+51% since first highlighted in yellow in the 4/30/20 mid-day report with a pivot point based on its 2/19/20 high plus 10 cents (read here). It was last shown in this FSU section on 9/25/20 with an annotated graph under the headline, "Gain Back Above "Max Buy" Level for ServiceNow". The number of top-rated funds owning its shares rose from 1,030 in Jun '17 to 2.382 in Jun '20, a reassuring sign concerning the I criteria. It has a Timeliness Rating of A and a Sponsorship Rating of A. Its current Up/Down Volume Ratio of 1.0 is an unbiased indication its shares have been neutral concerning accumulation/distribution over the past 50 days.
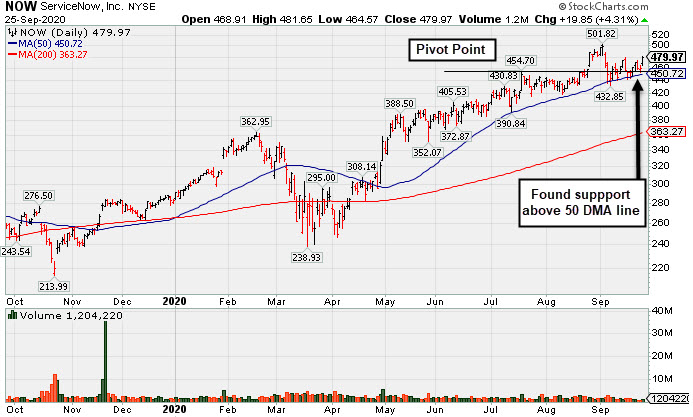
Gain Back Above "Max Buy" Level for ServiceNow - Friday, September 25, 2020
ServiceNow Inc (NOW +$19.85 or +4.31% to $479.97) posted a big gain with below average volume, rallying back above its "max buy" level, and its color code was changed to green. Volume totals have generally been cooling while showing resilience and finding support above its 50-day moving average (DMA) line ($450.72). Any damaging losses below the 50 DMA line and prior low ($432.85 on 9/08/20) may raise concerns and trigger a technical sell signal.
Fundamentals remain strong. Recently it reported Jun '20 quarterly earnings +73% on +28% sales revenues versus the year ago period. Results have been routinely above the +25% minimum earnings guideline (C criteria). It has an Earnings Per Share Rating of 99. The Computer Software - Enterprise group has a Group Relative Strength Rating of 90, a reassuring sign concerning the L criteria. NOW has a new CEO as of 1/01/20.
NOW has traded up as much as +46.28% since first highlighted in yellow in the 4/30/20 mid-day report with a pivot point based on its 2/19/20 high plus 10 cents (read here). It was last shown in this FSU section on 9/14/20 with an annotated graph under the headline, "Tested Support at 50-Day Moving Average Line". The number of top-rated funds owning its shares rose from 1,030 in Jun '17 to 2.295 in Jun '20, a reassuring sign concerning the I criteria. It has a Timeliness Rating of A and a Sponsorship Rating of A. Its current Up/Down Volume Ratio of 0.9 is an unbiased indication its shares have been under slight distributional pressure over the past 50 days.
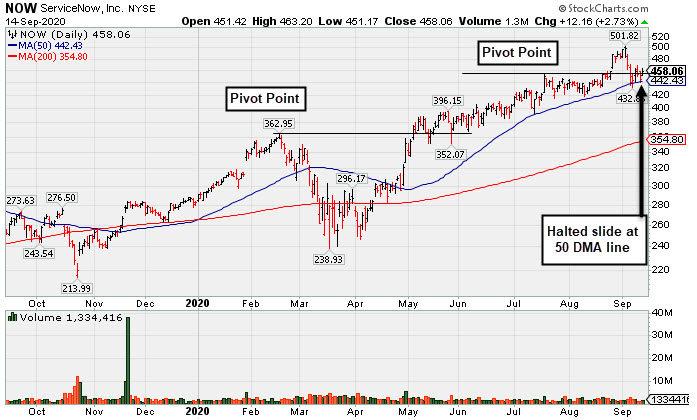
Tested Support at 50-Day Moving Average Line - Monday, September 14, 2020
ServiceNow Inc (NOW +$12.16 or +2.73% to $458.06) found prompt support after briefly undercutting the prior high ($454) and testing support at its 50-day moving average (DMA) line ($442.42). More damaging losses may raise concerns and trigger a technical sell signal.
Fundamentals remain strong. Recently it reported Jun '20 quarterly earnings +73% on +28% sales revenues versus the year ago period. Results have been routinely above the +25% minimum earnings guideline (C criteria). It has an Earnings Per Share Rating of 99. The Computer Software - Enterprise group has a Group Relative Strength Rating of 92, a reassuring sign concerning the L criteria. NOW has a new CEO as of 1/01/20.
NOW has traded up as much as +46.28% since first highlighted in yellow in the 4/30/20 mid-day report with a pivot point based on its 2/19/20 high plus 10 cents (read here). It was last shown in this FSU section on 8/28/20 with an annotated graph under the headline, "Quiet Gain to New High for Computer Software Firm". The number of top-rated funds owning its shares rose from 1,030 in Jun '17 to 2.285 in Jun '20, a reassuring sign concerning the I criteria. It has a Timeliness Rating of A and a Sponsorship Rating of A. Its current Up/Down Volume Ratio of 1.0 is an unbiased indication its shares have been neutral concerning accumulation/distribution over the past 50 days.
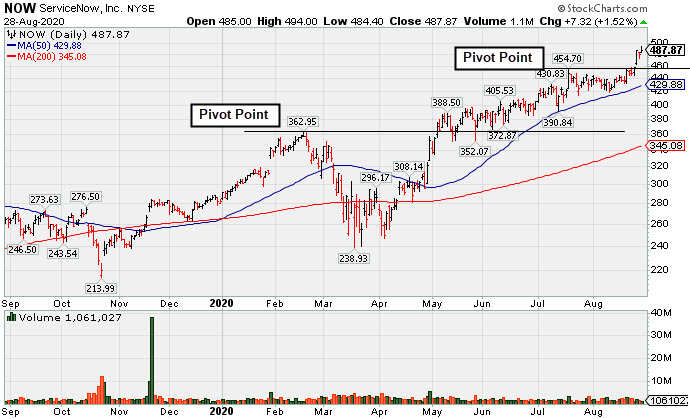
Quiet Gain to New High for Computer Software Firm - Friday, August 28, 2020
ServiceNow Inc (NOW +$7.32 or +1.52% to $487.87) hit another new all-time high today with light volume behind its gain, getting more extended from the latest base noted. On pullbacks, the prior high ($454) defines initial support to watch above its 50 DMA line ($429.88).Subsequent losses leading to violations may trigger technical sell signals.
Fundamentals remain strong. Recently it reported Jun '20 quarterly earnings +73% on +28% sales revenues versus the year ago period. Results have been routinely above the +25% minimum earnings guideline (C criteria). It has an Earnings Per Share Rating of 99. The Computer Software - Enterprise group has a Group Relative Strength Rating of 96, a reassuring sign concerning the L criteria. NOW has a new CEO as of 1/01/20.
NOW is up +42.2 from when it was highlighted in yellow in the 4/30/20 mid-day report with a pivot point based on its 2/19/20 high plus 10 cents (read here). It was last shown in this FSU section on 8/13/20 with an annotated graph under the headline, "Consolidating Above 50-Day Average After Another Strong Quarter". The number of top-rated funds owning its shares rose from 1,030 in Jun '17 to 2.254 in Jun '20, a reassuring sign concerning the I criteria. It has a Timeliness Rating of A and a Sponsorship Rating of A. Its current Up/Down Volume Ratio of 1.1 is an unbiased indication its shares have been under slight accumulation over the past 50 days.
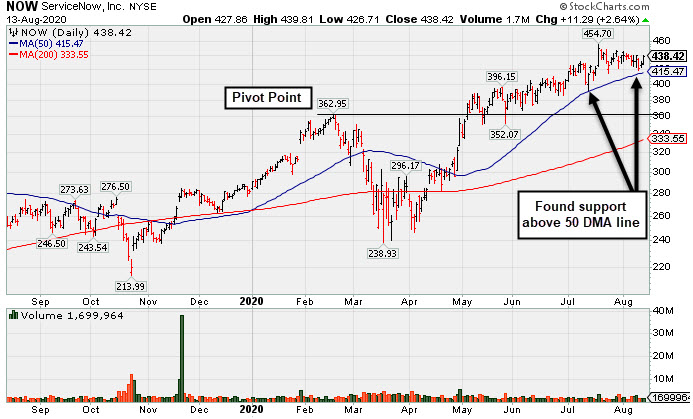
Consolidating Above 50-Day Average After Another Strong Quarter - Thursday, August 13, 2020
ServiceNow Inc (NOW +$11.29 or +2.64% to $438.42) is consolidating above its 50-day moving average (DMA) line ($413.78) which defines important near-term support to watch. Subsequent losses leading to a violation may trigger a technical sell signal.
Recently it reported Jun '20 quarterly earnings +73% on +28% sales revenues versus the year ago period. Results have been routinely above the +25% minimum earnings guideline (C criteria). It has an Earnings Per Share Rating of 99. The Computer Software - Enterprise group has a Group Relative Strength Rating of 96, a reassuring sign concerning the L criteria. NOW has a new CEO as of 1/01/20.
NOW is up +28.7% from when it was highlighted in yellow in the 4/30/20 mid-day report with a pivot point based on its 2/19/20 high plus 10 cents (read here). It was last shown in this FSU section on 7/22/20 with an annotated graph under the headline, "Perched Near All-Time High With Earnings News Due Next Week". The number of top-rated funds owning its shares rose from 1,030 in Jun '17 to 2.244 in Jun '20, a reassuring sign concerning the I criteria. It has a Timeliness Rating of A and a Sponsorship Rating of A. Its current Up/Down Volume Ratio of 1.3 is an unbiased indication its shares have been under accumulation over the past 50 days.
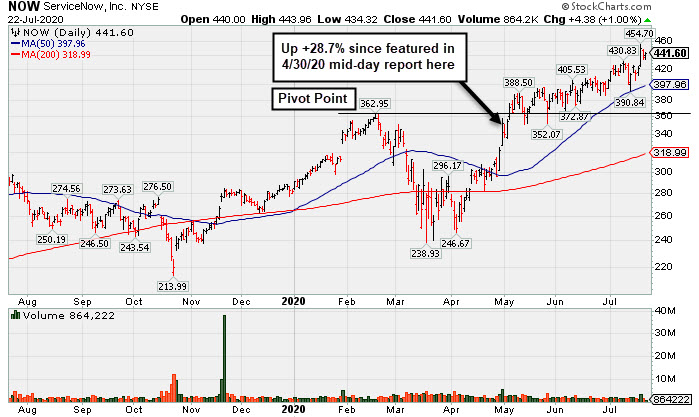
Perched Near All-Time High With Earnings News Due Next Week - Wednesday, July 22, 2020
ServiceNow Inc (NOW +$4.38 or +1.00% to $441.60) is perched near its all-time high. On 7/20/20 it posted a big gain for a new high backed by +72% above average volume. It has not formed a sound base. Its 50-day moving average (DMA) line ($398) defines important near-term support to watch where a violation may trigger a technical sell signal.
Keep in mind that the company is due to report earnings results for the Jun '20 quarter on 7/29/20. Volume and volatility often increase near earnings news. NOW is up +28.7% from when it was highlighted in yellow in the 4/30/20 mid-day report with a pivot point based on its 2/19/20 high plus 10 cents (read here). It was last shown in this FSU section on 6/25/20 with an annotated graph under the headline, "Hovering Near All-Time High With Volume Totals Cooling".
Annual earnings (A criteria) growth has been strong since FY '15. Quarterly comparisons through Mar '20 versus the year ago periods have been routinely above the +25% minimum earnings guideline (C criteria). It has an Earnings Per Share Rating of 98. The Computer Software - Enterprise group has a Group Relative Strength Rating of 99, a reassuring sign concerning the L criteria. NOW has a new CEO as of 1/01/20.
The number of top-rated funds owning its shares rose from 1,030 in Jun '17 to 2.188 in Jun '20, a reassuring sign concerning the I criteria. It has a Timeliness Rating of A and a Sponsorship Rating of A. Its current Up/Down Volume Ratio of 1.3 is an unbiased indication its shares have been under accumulation over the past 50 days.
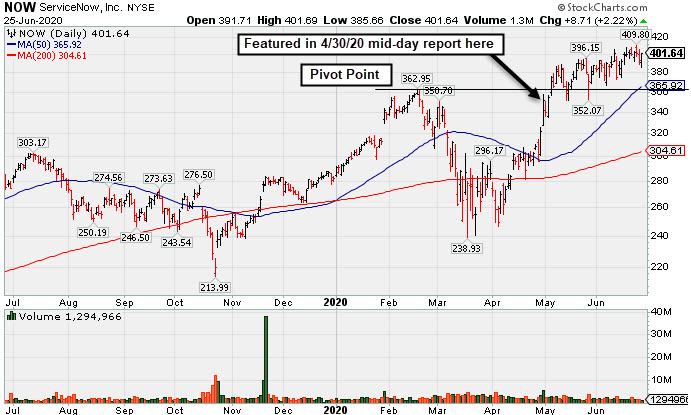
Hovering Near All-Time High With Volume Totals Cooling - Thursday, June 25, 2020
ServiceNow Inc (NOW +$8.71 or +2.22% to $401.64) posted a gain today with light volume. Volume totals have generally been cooling while hovering in a tight trading range perched near its all-time high, stubbornly holding its ground. It is extended from any sound base. Its 50-day moving average (DMA) line ($365.92) and prior highs in the $362 area define important near-term support to watch on pullbacks. See the latest FSU analysis for more details and a new annotated graph.
NOW was highlighted in yellow with new pivot point cited based on its 2/19/20 high plus 10 cents in the 4/30/20 mid-day report (read here). It was last shown in this FSU section on 6/04/20 with an annotated graph under the headline, "Quiet Pullback Below "Max Buy" Level for NOW".
Annual earnings (A criteria) growth has been strong since FY '15. Quarterly comparisons through Mar '20 versus the year ago periods have been routinely above the +25% minimum earnings guideline (C criteria). It has an Earnings Per Share Rating of 98. The Computer Software - Enterprise group has a Group Relative Strength Rating of 99, a reassuring sign concerning the L criteria. NOW has a new CEO as of 1/01/20.
The number of top-rated funds owning its shares rose from 1,030 in Jun '17 to 2.100 in Mar '20, a reassuring sign concerning the I criteria. It has a Timeliness Rating of A and a Sponsorship Rating of B. Its current Up/Down Volume Ratio of 1.3 is an unbiased indication its shares have been under accumulation over the past 50 days.
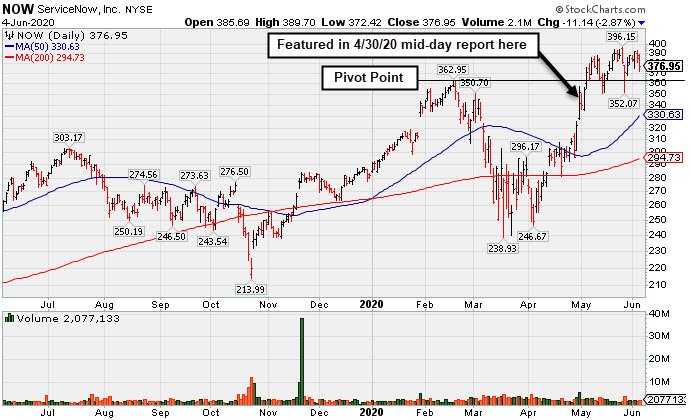
Quiet Pullback Below "Max Buy" Level for NOW - Thursday, June 4, 2020
ServiceNow Inc's (NOW -$11.14 or -2.87% to $376.95) color code was changed to yellow after pulling back below the "max buy" level with today's loss on below average volume. Recent gains above the pivot point were not backed by volume. Prior highs in the $362 area define initial support to watch on pullbacks. Disciplined investors know that gains above the pivot point should be backed by at least +40% above average volume to clinch a proper technical buy signal. Subsequent volume-driven gains would be a reassuring sign of fresh institutional buying demand which could lead to a sustained and meaningful price advance.
NOW was highlighted in yellow with new pivot point cited based on its 2/19/20 high plus 10 cents in the 4/30/20 mid-day report (read here). It was last shown in this FSU section on 5/14/20 with an annotated graph under the headline, "Consolidating Near Prior High After Wedging Into New High Ground". It went through some choppy consolidations yet has maintained its strong fundamentals since dropped from the Featured Stocks list on 8/02/19.
Annual earnings (A criteria) growth has been strong since FY '15. Quarterly comparisons through Mar '20 versus the year ago periods have been routinely above the +25% minimum earnings guideline (C criteria). It has an Earnings Per Share Rating of 97. The Computer Software - Enterprise group has a Group Relative Strength Rating of 99, a reassuring sign concerning the L criteria. NOW has a new CEO as of 1/01/20.
The number of top-rated funds owning its shares rose from 1,030 in Jun '17 to 2.095 in Mar '20, a reassuring sign concerning the I criteria. It has a Timeliness Rating of A and a Sponsorship Rating of B. Its current Up/Down Volume Ratio of 1.3 is an unbiased indication its shares have been under accumulation over the past 50 days.
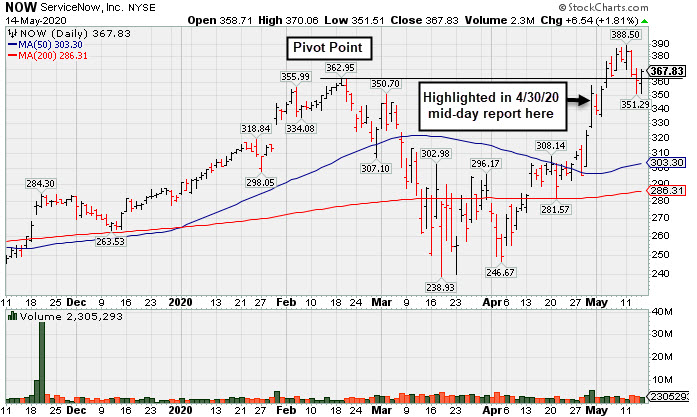
Consolidating Near Prior High After Wedging Into New High Ground - Thursday, May 14, 2020
ServiceNow Inc (NOW +$6.54 or +1.81% to $367.83) posted a gain today with light volume. It recently pulled back from its all-time high and briefly undercut the prior high. It had wedged into new high territory with gains lacking great volume conviction. Disciplined investors know that gains above the pivot point should be backed by at least +40% above average volume to clinch a proper technical buy signal. Subsequent volume-driven gains would be a reassuring sign of fresh institutional buying demand which could lead to a sustained and meaningful price advance.
NOW was highlighted in yellow with new pivot point cited based on its 2/19/20 high plus 10 cents in the 4/30/20 mid-day report (read here). It rebounded toward its high with a gap up and big volume-driven gain, working on the right side of an 11-week cup-shaped base. It was last shown in this FSU section on 7/31/19 with an annotated graph under the headline, "Slumped Below 50-Day Average With Loss on Higher Volume". It went through some choppy consolidations yet has maintained its strong fundamentals since dropped from the Featured Stocks list on 8/02/19.
Annual earnings (A criteria) growth has been strong since FY '15. Quarterly comparisons through Mar '20 versus the year ago periods have been routinely above the +25% minimum earnings guideline (C criteria). It has an Earnings Per Share Rating of 97. The Computer Software - Enterprise group has a Group Relative Strength Rating of 99, a reassuring sign concerning the L criteria. NOW has a new CEO as of 1/01/20.
The number of top-rated funds owning its shares rose from 1,030 in Jun '17 to 2.041 in Mar '20, a reassuring sign concerning the I criteria. It has a Timeliness Rating of A and a Sponsorship Rating of A. However, its current Up/Down Volume Ratio of 0.9 is an unbiased indication its shares have faced slight distributional pressure over the past 50 days.
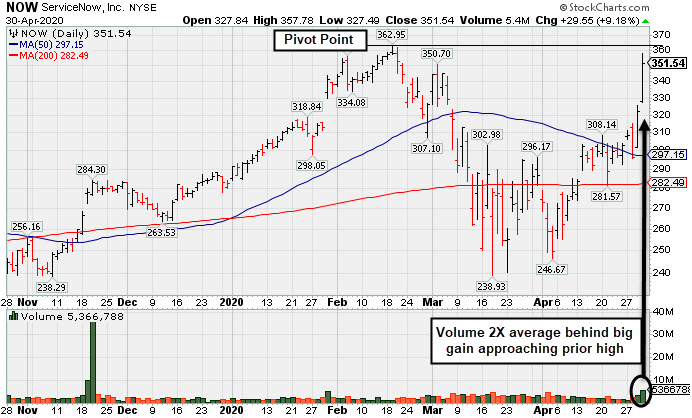
Fundamental Strength Continues; Volume Heavy Behind Big Gain - Thursday, April 30, 2020
ServiceNow Inc (NOW +$29.55 or +9.18% to $351.54) was highlighted in yellow with new pivot point cited based on its 2/19/20 high plus 10 cents in the earlier mid-day repot (read here). It rebounded toward its all-time high with today's gap up and big volume-driven gain, working on the right side of an 11-week cup-shaped base. Subsequent gains above the pivot point backed by at least +40% above average volume are needed to trigger a proper technical buy signal.
NOW has a new CEO as of 1/01/20. It was last shown in this FSU section on 7/31/19 with an annotated graph under the headline, "Slumped Below 50-Day Average With Loss on Higher Volume". It went through some choppy consolidations yet has maintained its strong fundamentals since dropped from the Featured Stocks list on 8/02/19.
Annual earnings (A criteria) growth has been strong since FY '15. It has an Earnings Per Share Rating of 97. The Computer Software - Enterprise group has a Group Relative Strength Rating of 96, a reassuring sign concerning the L criteria.
The number of top-rated funds owning its shares rose from 1,030 in Jun '17 to 1,975 in Mar '20, a reassuring sign concerning the I criteria. It has a Timeliness Rating of A and a Sponsorship Rating of B. However, its current Up/Down Volume Ratio of 0.8 is an unbiased indication its shares have faced distributional pressure over the past 50 days.
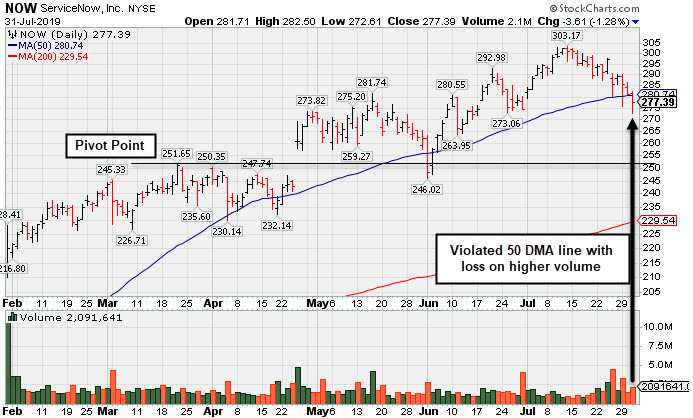
Slumped Below 50-Day Average With Loss on Higher Volume - Wednesday, July 31, 2019
ServiceNow Inc (NOW -$3.61 or -1.28% to $277.39) slumped to a close below its 50-day moving average (DMA) line ($280) with today's loss on higher volume raising concerns. It also undercut its 7/29/19 low ($275.59) yet rebounded to end the session in the middle of its intra-day range.
Last week it reported earnings +45% on +32% sales revenues for the Jun '19 quarter, above the +25% minimum earnings guideline (C criteria). That was a welcome improvement after earnings rose +20% on +34% sales revenues for the Mar '19 quarter..
NOW was last shown in this FSU section on 6/26/19 with an annotated graph under the headline, "Pulling Back After Wedging to New Highs". It was highlighted in yellow with pivot point cited based on its 9/13/18 high plus 10 cents when highlighted in the 1/31/19 mid-day report (read here) as it triggered a technical buy signal with a big "breakaway gap". Bullish action came after it reported earnings +79% on +30% sales revenues for the Dec '18 quarter. Prior quarterly comparisons were above the +25% minimum earnings guideline.
Annual earnings (A criteria) growth has been strong since FY '15. It has an Earnings Per Share Rating of 97. The Computer Software - Enterprise group has a Group Relative Strength Rating of 98, a reassuring sign concerning the L criteria.
The number of top-rated funds owning its shares rose from 1,030 in Jun '17 to 1,637 in Mar '19, a reassuring sign concerning the I criteria. It has a Timeliness Rating of A and a Sponsorship Rating of B. However, its current Up/Down Volume Ratio of 0.9 is an unbiased indication its shares have faced mild distributional pressure over the past 50 days.
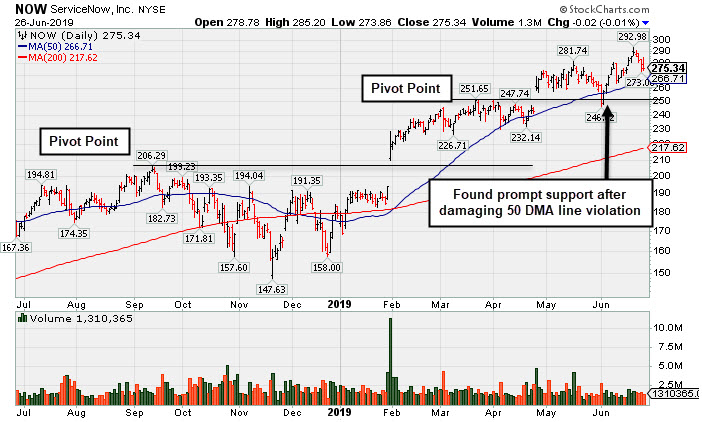
Pulling Back After Wedging to New Highs - Wednesday, June 26, 2019
ServiceNow Inc (NOW -$0.02 or -0.01% to $275.34) is extended from any sound base and recently wedged into new high territory with gains lacking great volume-conviction. It has pulled back from its all-time high with 4 consecutive losses. Its 50-day moving average (DMA) line ($266) and recent low ($246.02 on 6/03/19) define near-term support to watch. Recently it reported earnings +20% on +34% sales revenues for the Mar '19 quarter, below the +25% minimum earnings guideline (C criteria), raising fundamental concerns.
NOW was last shown in this FSU section on 5/29/19 with an annotated graph under the headline, "Leader Consolidating Above 50-Day Moving Average Line". It was highlighted in yellow with pivot point cited based on its 9/13/18 high plus 10 cents when highlighted in the 1/31/19 mid-day report (read here) as it triggered a technical buy signal with a big "breakaway gap". Bullish action came after it reported earnings +79% on +30% sales revenues for the Dec '18 quarter. Prior quarterly comparisons were above the +25% minimum earnings guideline (C criteria).
Annual earnings (A criteria) growth has been strong since FY '15. It has an Earnings Per Share Rating of 97. The Computer Software - Enterprise group has a Group Relative Strength Rating of 99, a reassuring sign concerning the L criteria.
The number of top-rated funds owning its shares rose from 1,030 in Jun '17 to 1,619 in Mar '19, a reassuring sign concerning the I criteria. It has a Timeliness Rating of A and a Sponsorship Rating of B.
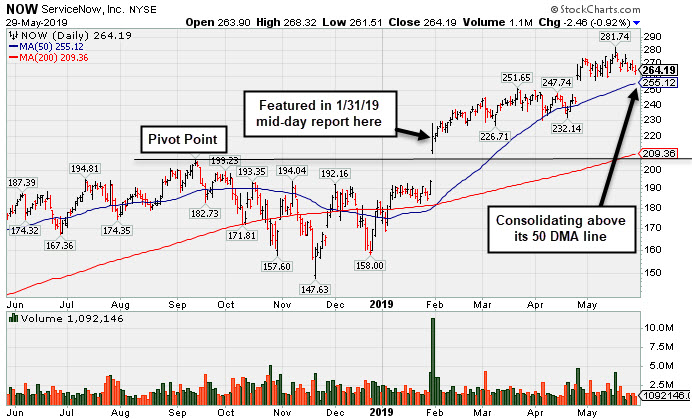
Leader Consolidating Above 50-Day Moving Average Line - Wednesday, May 29, 2019
ServiceNow Inc (NOW -$2.46 or -0.92% to $264.19) is consolidating near its all-time high. It remains perched well above its 50-day moving average (DMA) line ($255.12) and prior high ($251.65 on 3/21/19) which define important near-term support to watch on pullbacks. More damaging losses would raise concerns and trigger technical sell signals. Recently it reported earnings +20% on +34% sales revenues for the Mar '19 quarter, below the +25% minimum earnings guideline (C criteria), raising fundamental concerns.
NOW was last shown in this FSU section on 4/15/19 with an annotated graph under the headline, "Found Recent Support at 50-Day Moving Average". It was highlighted in yellow with pivot point cited based on its 9/13/18 high plus 10 cents when highlighted in the 1/31/19 mid-day report (read here) as it triggered a technical buy signal with a big "breakaway gap". Bullish action came after it reported earnings +79% on +30% sales revenues for the Dec '18 quarter. Prior quarterly comparisons were above the +25% minimum earnings guideline (C criteria).
Annual earnings (A criteria) growth has been strong since FY '15. It has an Earnings Per Share Rating of 97. The Computer Software - Enterprise group has a Group Relative Strength Rating of 99, a reassuring sign concerning the L criteria.
The number of top-rated funds owning its shares rose from 1,030 in Jun '17 to 1,563 in Mar '19, a reassuring sign concerning the I criteria. It has a Timeliness Rating of A and a Sponsorship Rating of B.
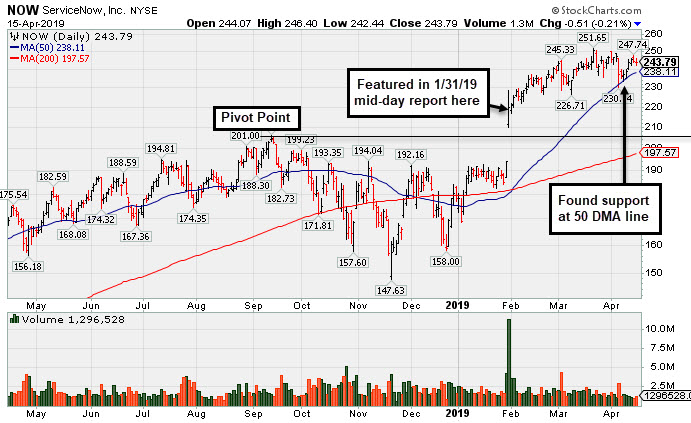
Found Recent Support at 50-Day Moving Average - Monday, April 15, 2019
ServiceNow Inc (NOW -$0.51 or -0.21% to $243.79) is extended from any sound base, finding support at its 50-day moving average (DMA) line ($238) recently. Below that important short-term average the recent low ($226.71 on 3/08/19) defines near-term support to watch. More damaging losses would raise concerns and trigger technical sell signals.
It was last shown in this FSU section on 3/06/19 with an annotated graph under the headline, "Pulling Back After 6 Straight Weekly Gains". It was highlighted in yellow with pivot point cited based on its 9/13/18 high plus 10 cents when highlighted in the 1/31/19 mid-day report (read here) as it triggered a technical buy signal with a big "breakaway gap". Bullish action came after it reported earnings +79% on +30% sales revenues for the Dec '18 quarter, continuing its strong earnings track record. Prior quarterly comparisons were above the +25% minimum earnings guideline (C criteria).
Annual earnings (A criteria) growth has been strong since FY '15. It has the highest possible Earnings Per Share Rating of 99. The Computer Software - Enterprise group has a Group Relative Strength Rating of 97, a reassuring sign concerning the L criteria.
The number of top-rated funds owning its shares rose from 1,030 in Jun '17 to 1,488 in Dec '18, a reassuring sign concerning the I criteria. It has a Timeliness Rating of A and a Sponsorship Rating of B.
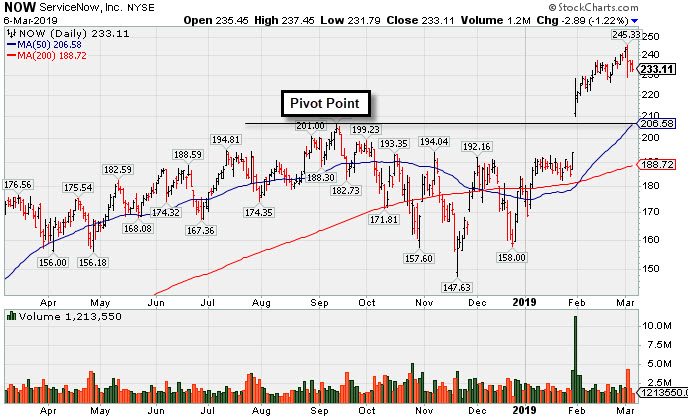
Pulling Back After 6 Straight Weekly Gains - Wednesday, March 6, 2019
ServiceNow Inc (NOW -$2.89 or -1.22% to $233.11) reversed into the red on Monday for a loss on higher volume after wedging to new all-time highs with recent gains lacking great volume. The prior high ($206) defines initial support to watch on pullbacks.
It was highlighted in yellow with pivot point cited based on its 9/13/18 high plus 10 cents when highlighted in the 1/31/19 mid-day report (read here) as it triggered a technical buy signal with a big "breakaway gap". Bullish action came after it reported earnings +79% on +30% sales revenues for the Dec '18 quarter, continuing its strong earnings track record. Prior quarterly comparisons were above the +25% minimum earnings guideline (C criteria). Annual earnings (A criteria) growth has been strong since FY '15. It has the highest possible Earnings Per Share Rating of 99. The Computer Software - Enterprise group has a Group Relative Strength Rating of 97, a reassuring sign concerning the L criteria.
It went through a deep consolidation since last shown in this FSU section on 2/01/19 with an annotated graph under the headline, "Breakaway Gap Followed Strong Earnings Report".The number of top-rated funds owning its shares rose from 1,030 in Jun '17 to 1,431 in Dec '18, a reassuring sign concerning the I criteria. It has a Timeliness Rating of A and a Sponsorship Rating of B.
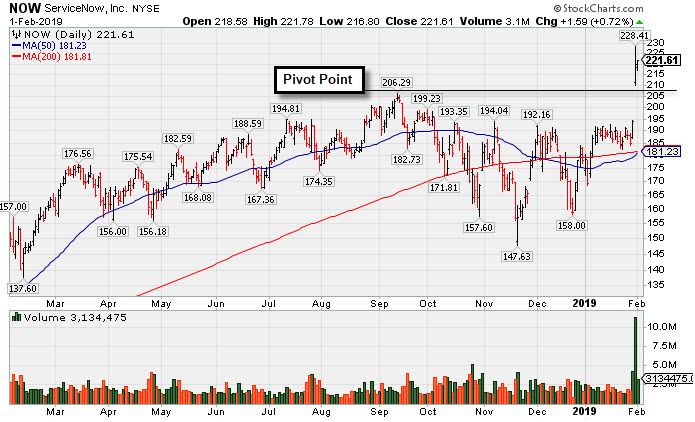
Breakaway Gap Followed Strong Earnings Report - Friday, February 1, 2019
ServiceNow Inc (NOW +$1.49 or +0.68% to $221.51) posted another gain today and its color code was changed to green after rising above its "max buy" level. It was highlighted in yellow with pivot point cited based on its 9/13/18 high plus 10 cents when highlighted in the 1/31/19 mid-day report (read here) as it triggered a technical buy signal with a big "breakaway gap".
Bullish action came after it reported earnings +79% on +30% sales revenues for the Dec '18 quarter, continuing its strong earnings track record. Volume and volatility often increase near earnings news. Fundamentals remain strong.Prior quarterly comparisons were above the +25% minimum earnings guideline (C criteria). Annual earnings (A criteria) growth has been strong since FY '15 and it has an Earnings Per Share Rating of 98. The Computer Software - Enterprise group has a Group Relative Strength Rating of 98, a reassuring sign concerning the L criteria.
The number of top-rated funds owning its shares rose from 1,030 in Jun '17 to 1,420 in Dec '18, a reassuring sign concerning the I criteria. It has a Timeliness Rating of A and a Sponsorship Rating of B.
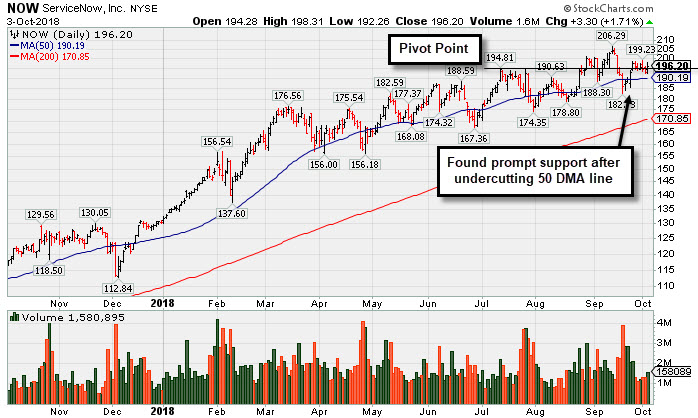
Found Support at 50-Day Average After Slump Into Prior Base - Wednesday, October 3, 2018
ServiceNow Inc's (NOW +$3.30 or +1.71% to $196.20) volume totals have been cooling while consolidating above its 50-day moving average (DMA) line ($190.19). The recent low ($182.73 on 9/19/18) defines additional near-term support above prior lows and its 200 DMA line.
It was last shown in this FSU section on 8/17/18 with an annotated graph under the headline, "Slump Below 50-Day Average Line Raises Concerns". NOW was first highlighted in yellow with pivot point cited based on its 3/14/18 high plus 10 cents in the earlier mid-day report (read here).
Fundamentals remain strong. Recently it reported earnings +123% on +41% sales revenues for the Jun '18 quarter, and prior quarterly comparisons were above the +25% minimum earnings guideline (C criteria). Annual earnings (A criteria) growth has been strong since FY '15 and it has an Earnings Per Share Rating of 99. The Computer Software - Enterprise group has a Group Relative Strength Rating of 98, a reassuring sign concerning the L criteria.
The number of top-rated funds owning its shares rose from 1,030 in Jun '17 to 1,309 in Jun '18, a reassuring sign concerning the I criteria. It has a Timeliness Rating of A and a Sponsorship Rating of B.
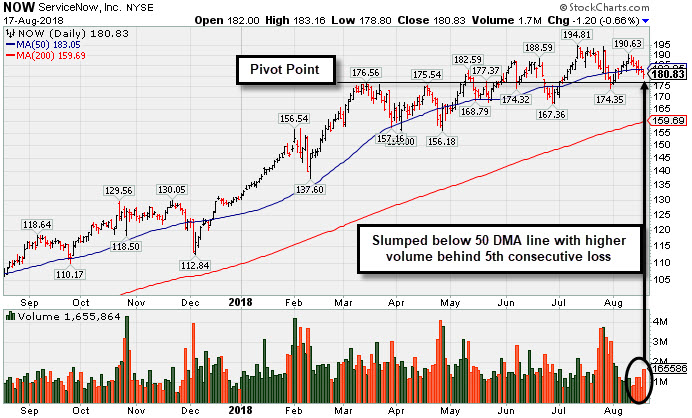
Slump Below 50-Day Average Line Raises Concerns - Friday, August 17, 2018
ServiceNow Inc (NOW -$1.20 or -0.66% to $180.83) slumped below its 50-day moving average (DMA) line ($183.05) with higher (near average) volume behind today's 5th consecutive loss. Only a prompt rebound above the 50 DMA line would help its outlook improve. The prior low ($174.35 on 7/31/18) defines the next important support level where any violation would raise more serious concerns.
It was last shown in this FSU section on 6/26/18 with an annotated graph under the headline, "Recent Slump Below 50-Day Average Hurt Outlook".
NOW was first highlighted in yellow with pivot point cited based on its 3/14/18 high plus 10 cents in the earlier mid-day report (read here).
Recently it reported earnings +123% on +41% sales revenues for the Jun '18 quarter, and prior quarterly comparisons were above the +25% minimum earnings guideline (C criteria). Annual earnings (A criteria) growth has been strong since FY '15 and it has an Earnings Per Share Rating of 99. The Computer Software - Enterprise group has a Group Relative Strength Rating of 98, a reassuring sign concerning the L criteria.
The number of top-rated funds owning its shares rose from 1,030 in Jun '17 to 1,276 in Jun '18, a reassuring sign concerning the I criteria. It has a Timeliness Rating of A and a Sponsorship Rating of B.
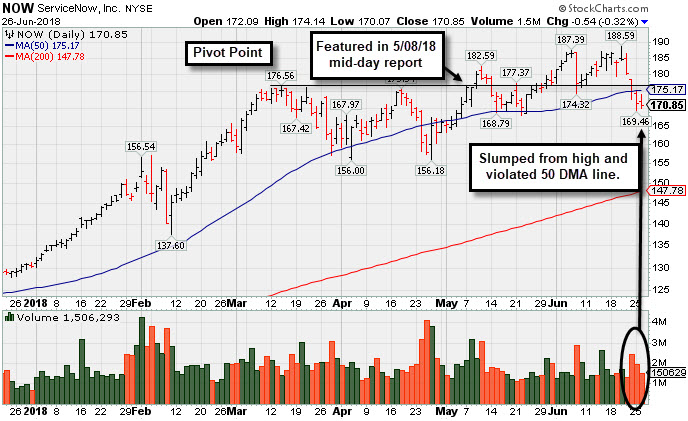
Recent Slump Below 50-Day Average Hurt Outlook - Tuesday, June 26, 2018
ServiceNow Inc (NOW -$0.54 or -0.32% to $170.85) recently slumped below its 50-day moving average (DMA) line ($175) raising concerns and triggering a technical sell signal. Only a prompt rebound above the 50 DMA line would help its outlook improve.
Recently it reported earnings +81% on +37% sales revenues for the Mar '18 quarter, and prior quarterly comparisons were above the +25% minimum earnings guideline (C criteria). Annual earnings (A criteria) growth has been strong since FY '15 and it has an Earnings Per Share Rating of 98. The Computer Software - Enterprise group has a Group Relative Strength Rating of 98, a reassuring sign concerning the L criteria.
The number of top-rated funds owning its shares rose from 1,030 in Jun '17 to 1,172 in Mar '18, a reassuring sign concerning the I criteria. It has a Timeliness Rating of A and a Sponsorship Rating of B.
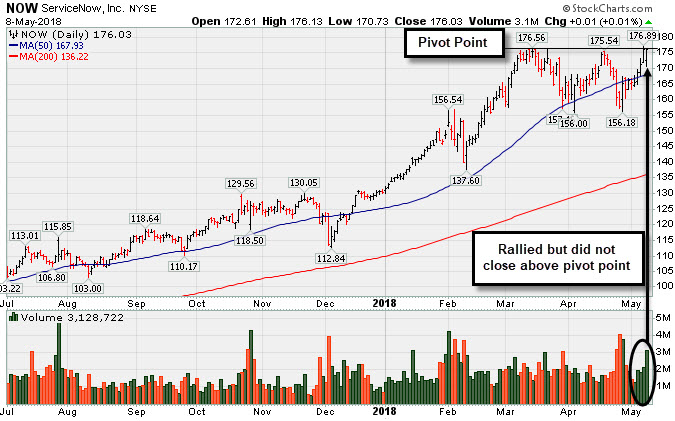
High-Ranked Software - Enterprise Firm is Near Pivot Point - Tuesday, May 8, 2018
ServiceNow Inc (NOW +$0.01 or +0.01% to $176.03) ended little changed after highlighted in yellow with pivot point cited based on its 3/14/18 high plus 10 cents in the earlier mid-day report (read here). Gains backed by at least +40% above average volume while rising above the pivot point may trigger a technical buy signal. It rebounded above its 50-day moving average (DMA) line recently, and touched a new all-time high with a quiet gain on the prior session.
Recently it reported earnings +81% on +37% sales revenues for the Mar '18 quarter, and prior quarterly comparisons were above the +25% minimum earnings guideline (C criteria). Annual earnings (A criteria) growth has been strong since FY '15 and it has an Earnings Per Share Rating of 98. The Computer Software - Enterprise group has a Group Relative Strength Rating of 99, a reassuring sign concerning the L criteria.
The number of top-rated funds owning its shares rose from 1,030 in Jun '17 to 1,132 in Mar '18, a reassuring sign concerning the I criteria. It has a Timeliness Rating of A and a Sponsorship Rating of B..