You are not logged in.
This means you
CAN ONLY VIEW reports that were published prior to Thursday, April 3, 2025.
You
MUST UPGRADE YOUR MEMBERSHIP if you want to see any current reports.
AFTER MARKET UPDATE - THURSDAY, MAY 14TH, 2020
Previous After Market Report Next After Market Report >>>
|
|
|
|
DOW |
+377.37 |
23,625.34 |
+1.62% |
|
Volume |
1,063,996,872 |
-5% |
|
Volume |
3,917,427,800 |
-7% |
|
NASDAQ |
+80.55 |
8,943.72 |
+0.91% |
|
Advancers |
1,585 |
55% |
|
Advancers |
1,605 |
49% |
|
S&P 500 |
+32.50 |
2,852.50 |
+1.15% |
|
Decliners |
1,309 |
45% |
|
Decliners |
1,658 |
51% |
|
Russell 2000 |
+4.30 |
1,237.56 |
+0.35% |
|
52 Wk Highs |
15 |
|
|
52 Wk Highs |
22 |
|
|
S&P 600 |
+2.58 |
703.17 |
+0.37% |
|
52 Wk Lows |
104 |
|
|
52 Wk Lows |
114 |
|
|
 |
Major Indices Overcame Weak Start to Finish Higher
Kenneth J. Gruneisen - Passed the CAN SLIM® Master's Exam
The Dow reversed a more than 450 point drop to end 377 points higher. The S&P 500 gained 1.2%, but still remains on pace to notch its worst weekly performance since late March. The Nasdaq Composite added 0.9%, advancing for the first time in three sessions. Breadth was mixed as advancers led decliners by an 8-7 margin on the NYSE and decliners narrowly outnumbered advancers on the Nasdaq exchange. The reported volume totals were lighter than the prior session on the NYSE and on the Nasdaq exchange. There were 9 high-ranked companies from the Leaders List that hit new 52-week highs and were listed on the BreakOuts Page, versus 14 on the prior session. New 52-week lows totals expanded and solidly outnumbered new 52-week highs totals on the NYSE and on the Nasdaq exchange. The major indices are in a confirmed uptrend (M criteria). Any sustainable rally requires a healthy crop of new leaders, so shrinking new highs totals this week are a worrisome sign. Charts used courtesy of www.stockcharts.com
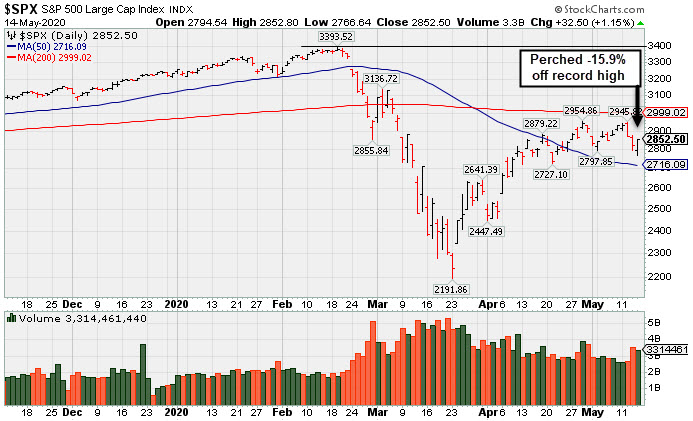
PICTURED: The S&P 500 Index is consolidating above its 50-day moving average (DMA) line The benchmark index is -15.9% off its record high.
Stocks U.S. equities finished near their best levels during a volatile session, as a rally in bank stocks and a boost in oil prices helped to overshadow dismal economic data and renewed U.S.-China trade tensions.
Comments from President Trump that he was not currently interested in speaking with Chinese President Xi was a headwind early in the session. Meanwhile, the latest update on the weekly initial jobless claims showed nearly 3 million Americans filed for unemployment benefits during the week ending May 9. The figure was slightly above forecasts but eased from the prior 3.1 million reading. Treasuries advanced, with the yield on the benchmark 10-year note down two basis points to 0.63%. In commodities, WTI crude rallied 8.7% to $27.49/barrel after the International Energy Agency noted global demand for crude was improving.
Ten of 11 S&P 500 sectors ended in positive territory, with Consumer Staples bucking the uptrend. The Financials group paced the gains, with JP Morgan Chase & Co (JPM +4.15%) and Bank of America (BAC +4.02%) both advancing. In earnings, Cisco Systems (CSCO +4.53%) rose after exceeding consensus profit and revenue expectations and providing positive current-quarter guidance as the networking equipment maker has benefited from more employees working remotely. Norwegian Cruise Line Holdings (NCLH +4.36%) rose as investors focused on consumer bookings rather than the company posting a larger-than-anticipated quarterly loss. |
 Kenneth J. Gruneisen started out as a licensed stockbroker in August 1987, a couple of months prior to the historic stock market crash that took the Dow Jones Industrial Average down -22.6% in a single day. He has published daily fact-based fundamental and technical analysis on high-ranked stocks online for two decades. Through FACTBASEDINVESTING.COM, Kenneth provides educational articles, news, market commentary, and other information regarding proven investment systems that work in good times and bad.
Comments contained in the body of this report are technical opinions only and are not necessarily those of Gruneisen Growth Corp. The material herein has been obtained from sources believed to be reliable and accurate, however, its accuracy and completeness cannot be guaranteed. Our firm, employees, and customers may effect transactions, including transactions contrary to any recommendation herein, or have positions in the securities mentioned herein or options with respect thereto. Any recommendation contained in this report may not be suitable for all investors and it is not to be deemed an offer or solicitation on our part with respect to the purchase or sale of any securities. |
|
 |
Financial, Retail, Semiconductor, and Commodity-Linked Groups Rose
Kenneth J. Gruneisen - Passed the CAN SLIM® Master's Exam
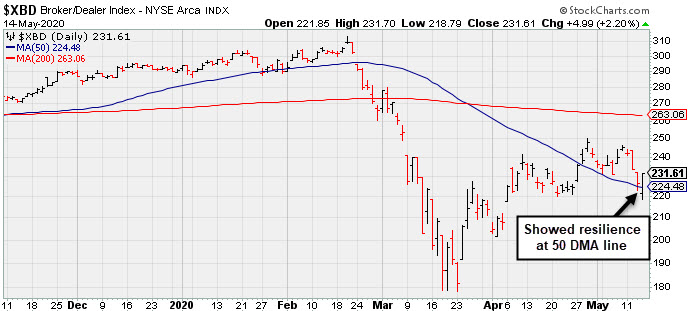
The Bank Index ($BKX +3.92%) and the Broker/Dealer Index ($XBD +2.20%) both gained ground and the Retail Index ($RLX +1.06%) also helped lift the major indices. The tech sector was mixed as the Networking Index ($NWX -0.47%) and the Biotech Index ($BTK -0.98%) both edged lower while the Semiconductor Index ($SOX +2.81%) notched a solid gain. Commodity-linked groups had a positive bias as the Oil Services Index ($OSX +1.49%), Integrated Oil Index ($XOI +0.41%) and the Gold & Silver Index ($XAU +2.77%) each posted gains. PICTURED: The Broker/Dealer Index ($XBD +2.20%) showed resilience and overcame weakness on Thursday to close above its downward sloping 50-day moving average (DMA) line. After rebounding impressively from the March low, any further deterioration could be an ominous sign, since the financial indices are reliable "leading indicators".
| Oil Services |
$OSX |
27.76 |
+0.40 |
+1.46% |
-64.54% |
| Integrated Oil |
$XOI |
733.78 |
+3.01 |
+0.41% |
-42.25% |
| Semiconductor |
$SOX |
1,739.05 |
+47.48 |
+2.81% |
-5.98% |
| Networking |
$NWX |
494.57 |
-2.36 |
-0.47% |
-15.23% |
| Broker/Dealer |
$XBD |
231.61 |
+4.99 |
+2.20% |
-20.24% |
| Retail |
$RLX |
2,643.99 |
+27.85 |
+1.06% |
+7.95% |
| Gold & Silver |
$XAU |
121.25 |
+3.27 |
+2.77% |
+13.40% |
| Bank |
$BKX |
65.20 |
+2.46 |
+3.92% |
-42.48% |
| Biotech |
$BTK |
5,351.51 |
-52.82 |
-0.98% |
+5.61% |
|
|
|
 |
Consolidating Near Prior High After Wedging Into New High Ground
Kenneth J. Gruneisen - Passed the CAN SLIM® Master's Exam
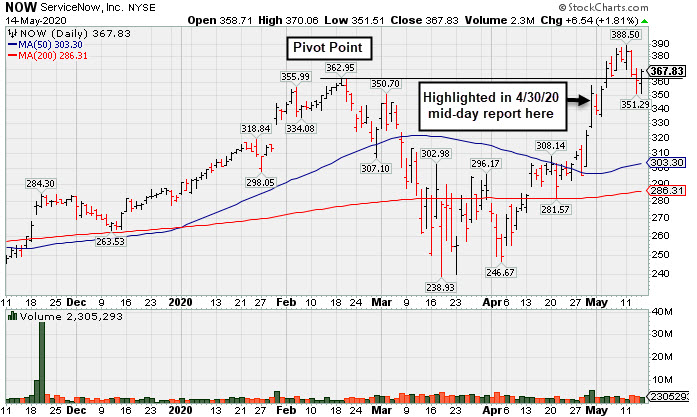
ServiceNow Inc (NOW +$6.54 or +1.81% to $367.83) posted a gain today with light volume. It recently pulled back from its all-time high and briefly undercut the prior high. It had wedged into new high territory with gains lacking great volume conviction. Disciplined investors know that gains above the pivot point should be backed by at least +40% above average volume to clinch a proper technical buy signal. Subsequent volume-driven gains would be a reassuring sign of fresh institutional buying demand which could lead to a sustained and meaningful price advance.
NOW was highlighted in yellow with new pivot point cited based on its 2/19/20 high plus 10 cents in the 4/30/20 mid-day report (read here). It rebounded toward its high with a gap up and big volume-driven gain, working on the right side of an 11-week cup-shaped base. It was last shown in this FSU section on 7/31/19 with an annotated graph under the headline, "Slumped Below 50-Day Average With Loss on Higher Volume". It went through some choppy consolidations yet has maintained its strong fundamentals since dropped from the Featured Stocks list on 8/02/19.
Annual earnings (A criteria) growth has been strong since FY '15. Quarterly comparisons through Mar '20 versus the year ago periods have been routinely above the +25% minimum earnings guideline (C criteria). It has an Earnings Per Share Rating of 97. The Computer Software - Enterprise group has a Group Relative Strength Rating of 99, a reassuring sign concerning the L criteria. NOW has a new CEO as of 1/01/20.
The number of top-rated funds owning its shares rose from 1,030 in Jun '17 to 2.041 in Mar '20, a reassuring sign concerning the I criteria. It has a Timeliness Rating of A and a Sponsorship Rating of A. However, its current Up/Down Volume Ratio of 0.9 is an unbiased indication its shares have faced slight distributional pressure over the past 50 days. |
|
|
Color Codes Explained :
Y - Better candidates highlighted by our
staff of experts.
G - Previously featured
in past reports as yellow but may no longer be buyable under the
guidelines.
***Last / Change / Volume data in this table is the closing quote data***
Symbol/Exchange
Company Name
Industry Group |
PRICE |
CHANGE
(%Change) |
Day High |
Volume
(% DAV)
(% 50 day avg vol) |
52 Wk Hi
% From Hi |
Featured
Date |
Price
Featured |
Pivot Featured |
|
Max Buy |
 FTNT
-
NASDAQ
FTNT
-
NASDAQ
Fortinet Inc
Computer Sftwr-Security
|
$138.06
|
+0.90
0.66% |
$138.44
|
1,433,208
57.40% of 50 DAV
50 DAV is 2,497,000
|
$143.41
-3.73%
|
5/7/2020
|
$134.40
|
PP = $121.92
|
|
MB = $128.02
|
Most Recent Note - 5/11/2020 5:28:24 PM
G - Color code was changed to green after quickly rallying well above its "max buy" level and getting extended from the prior base. Prior highs in the $121 area define initial support to watch on pullbacks. Finished strong after highlighted in yellow in the 5/07/20 mid-day report. Fundamentals remain strong. See the latest FSU analysis for more details and an annotated graph.
>>> FEATURED STOCK ARTICLE : Gap Up and Big Volume-Driven Gain for Computer Security Firm - 5/7/2020 |
View all notes |
Set NEW NOTE alert |
Company Profile |
SEC
News |
Chart |
Request a new note
C
A
S
I |
SPNS
-
NASDAQ
Sapiens Intl Corp
COMPUTER SOFTWARE and SERVICES - Technical and System Software
|
$24.07
|
-0.36
-1.47% |
$24.46
|
396,007
271.24% of 50 DAV
50 DAV is 146,000
|
$29.24
-17.68%
|
5/11/2020
|
$27.80
|
PP = $26.96
|
|
MB = $28.31
|
 Most Recent Note - 5/14/2020 11:22:59 AM
G - Color code is changed to green after it reported Mar '20 quarterly earnings +18% on +18% sales revenues versus the year ago period, below the +25% minimum guideline (C criteria), raising fundamental concerns. Volume and volatility often increase near earnings news. Today's 3rd consecutive loss with above average volume raises more concerns, technically. Finished weak after highlighted in yellow in the 5/11/20 mid-day report with pivot point cited based on its 1/24/20 high plus 10 cents.
>>> FEATURED STOCK ARTICLE : Encountered Distributional Pressure After Hitting New High - 5/11/2020 |
View all notes |
Set NEW NOTE alert |
Company Profile |
SEC
News |
Chart |
Request a new note
C
A
S
I |
EBS
-
NYSE
Emergent Biosolutions
DRUGS - Biotechnology
|
$80.84
|
-0.30
-0.37% |
$80.90
|
393,857
67.67% of 50 DAV
50 DAV is 582,000
|
$90.00
-10.18%
|
4/24/2020
|
$72.10
|
PP = $73.99
|
|
MB = $77.69
|
Most Recent Note - 5/12/2020 6:26:57 PM
G - There was a "negative reversal" after early gains today for a new all-time high, ending with a loss on above average volume indicative of distributional pressure. It is extended from the previously noted base. Prior highs in the $71-73 area define initial support to watch on pullbacks. Fundamentals remain strong.
>>> FEATURED STOCK ARTICLE : Light Volume Gain for New High Close Caps 7th Straight Weekly Gain - 5/8/2020 |
View all notes |
Set NEW NOTE alert |
Company Profile |
SEC
News |
Chart |
Request a new note
C
A
S
I |
TREX
-
NYSE
Trex Company Inc
MATERIALS and CONSTRUCTION - General Building Materials
|
$112.27
|
-1.65
-1.45% |
$112.87
|
693,961
63.84% of 50 DAV
50 DAV is 1,087,000
|
$118.72
-5.43%
|
5/5/2020
|
$109.05
|
PP = $111.95
|
|
MB = $117.55
|
Most Recent Note - 5/12/2020 6:30:01 PM
Y - Pulled back today for a loss with below average volume after touching a new all-time high. Prior highs in the $111 area define initial support to watch. Has a new CEO as of 4/29/20. Fundamentals remain strong.
>>> FEATURED STOCK ARTICLE : Gapped Up for Volume-Driven Gain and Hit a New All-Time High - 5/5/2020 |
View all notes |
Set NEW NOTE alert |
Company Profile |
SEC
News |
Chart |
Request a new note
C
A
S
I |
NFLX
-
NASDAQ
Netflix Inc
SPECIALTY RETAIL - Music and Video Stores
|
$441.95
|
+3.68
0.84% |
$452.38
|
8,960,031
95.61% of 50 DAV
50 DAV is 9,371,000
|
$449.52
-1.68%
|
5/14/2020
|
$441.95
|
PP = $449.62
|
|
MB = $472.10
|
Most Recent Note - 5/14/2020 5:33:08 PM
Y - Color code is changed to yellow with new pivot point cited based on its 4/16/20 high plus 10 cents. It recently formed an advanced "3-weeks tight" base or may also be considered a 4-week "square box" base. Subsequent gains above the pivot point backed by at least +40% above average volume may trigger a new (or add-on) technical buy signal. Touched a new all-time high today and finished at a best-ever close with a gain on average volume. Prior highs in the $393 area acted as support following the recent breakout. Fundamentals remain strong.
>>> FEATURED STOCK ARTICLE : Prior Highs Acted as Support Following Recent Breakout - 5/6/2020 |
View all notes |
Set NEW NOTE alert |
Company Profile |
SEC
News |
Chart |
Request a new note
C
A
S
I |
Symbol/Exchange
Company Name
Industry Group |
PRICE |
CHANGE
(%Change) |
Day High |
Volume
(% DAV)
(% 50 day avg vol) |
52 Wk Hi
% From Hi |
Featured
Date |
Price
Featured |
Pivot Featured |
|
Max Buy |
NOW
-
NYSE
Servicenow Inc
Computer Sftwr-Enterprse
|
$367.83
|
+6.54
1.81% |
$370.06
|
2,303,784
81.99% of 50 DAV
50 DAV is 2,810,000
|
$388.50
-5.32%
|
4/30/2020
|
$343.05
|
PP = $363.05
|
|
MB = $381.20
|
Most Recent Note - 5/14/2020 5:34:51 PM
Y - Posted a gain today after briefly undercutting the prior high. Subsequent gains above the pivot point should be backed by at least +40% above average volume to help clinch a proper technical buy signal. See the latest FSU analysis for more details and a new annotated graph.
>>> FEATURED STOCK ARTICLE : Consolidating Near Prior High After Wedging Into New High Ground - 5/14/2020 |
View all notes |
Set NEW NOTE alert |
Company Profile |
SEC
News |
Chart |
Request a new note
C
A
S
I |
QLYS
-
NASDAQ
Qualys Inc
Computer Sftwr-Security
|
$104.59
|
+2.82
2.77% |
$104.64
|
564,421
97.99% of 50 DAV
50 DAV is 576,000
|
$111.79
-6.44%
|
4/9/2020
|
$100.44
|
PP = $97.22
|
|
MB = $102.08
|
Most Recent Note - 5/14/2020 6:02:33 PM
G - Color code is changed to green again after a "positive reversal" today and gain back above its "max buy" level. Reported Mar '20 quarterly earnings +33% on +14% sales revenues versus the year ago period, its 12th consecutive quarterly earnings increase above the +25% minimum guideline (C criteria). Prior highs in the $97 area recently acted as support. See the latest FSU analysis for more details and an annotated graph.
>>> FEATURED STOCK ARTICLE : Quiet Pullback Just Below "Max Buy" Level - 5/13/2020 |
View all notes |
Set NEW NOTE alert |
Company Profile |
SEC
News |
Chart |
Request a new note
C
A
S
I |
TEAM
-
NASDAQ
Atlassian Corp Plc Cl A
Comp Sftwr-Spec Enterprs
|
$179.79
|
+4.03
2.29% |
$180.44
|
1,397,300
68.16% of 50 DAV
50 DAV is 2,050,000
|
$182.60
-1.54%
|
5/4/2020
|
$159.70
|
PP = $156.22
|
|
MB = $164.03
|
Most Recent Note - 5/14/2020 5:14:19 PM
G - Posted a gain today with light volume for a best-ever close. Extended from the previously noted base. Prior highs in the $156 area define initial support to watch on pullbacks.
>>> FEATURED STOCK ARTICLE : Volume-Driven Gain For New All-Time High - 5/4/2020 |
View all notes |
Set NEW NOTE alert |
Company Profile |
SEC
News |
Chart |
Request a new note
C
A
S
I |
AAXN
-
NASDAQ
Axon Enterprise Inc
Security/Sfty
|
$75.60
|
-4.57
-5.70% |
$79.08
|
851,497
99.47% of 50 DAV
50 DAV is 856,000
|
$90.10
-16.09%
|
5/8/2020
|
$84.86
|
PP = $90.20
|
|
MB = $94.71
|
Most Recent Note - 5/14/2020 5:15:27 PM
Y - Pulled back for a 4th consecutive loss with near average volume. A rebound and subsequent volume-driven gains above the pivot point are needed to trigger a technical buy signal.
>>> FEATURED STOCK ARTICLE : Security/Safety Firm Perched Near 52-Week High After Gap Up - 5/12/2020 |
View all notes |
Set NEW NOTE alert |
Company Profile |
SEC
News |
Chart |
Request a new note
C
A
S
I |
|
|
|
THESE ARE NOT BUY RECOMMENDATIONS!
Comments contained in the body of this report are technical
opinions only. The material herein has been obtained
from sources believed to be reliable and accurate, however,
its accuracy and completeness cannot be guaranteed.
This site is not an investment advisor, hence it does
not endorse or recommend any securities or other investments.
Any recommendation contained in this report may not
be suitable for all investors and it is not to be deemed
an offer or solicitation on our part with respect to
the purchase or sale of any securities. All trademarks,
service marks and trade names appearing in this report
are the property of their respective owners, and are
likewise used for identification purposes only.
This report is a service available
only to active Paid Premium Members.
You may opt-out of receiving report notifications
at any time. Questions or comments may be submitted
by writing to Premium Membership Services 665 S.E. 10 Street, Suite 201 Deerfield Beach, FL 33441-5634 or by calling 1-800-965-8307
or 954-785-1121.
|
|
|