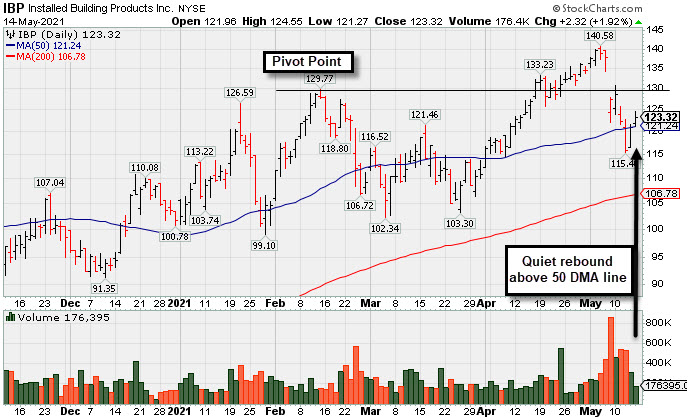
Rebound Above 50-Day Moving Average Helped Technical Stance - Friday, May 14, 2021
Installed Building Products (IBP +$2.32 or +1.92% to $123.32) showed resilience this week, quietly rebounding above its 50-day moving average (DMA) line ($121.27), helping its outlook improve. More damaging losses below the recent low ($115.46) would raise serious concerns, technically.
Weak action came after it reported Mar '21 quarterly earnings +15% on +10% sales revenues versus the year ago period, below the +25% minimum earnings guideline (C criteria) raising fundamental concerns. IBP currently has an Earnings Per Share Rating of 94. Two of the past 4 consecutive quarterly comparisons were below the +25% minimum earnings guideline (C criteria). Its annual earnings (A criteria) history has been strong.
IBP was highlighted in yellow with new pivot point cited based on its 2/12/21 high plus 10 cents in the mid-day report (read here ). It was last shown in this FSU section on 4/19/21 with an annotated graph under the headline, "Steady Streak of Gains Into New High Territory".
Its current Up/Down Volume Ratio of 1.8 is an unbiased neutral indication with regard to accumulation/distribution over the past 50 days. The high-ranked Building - Maintenance & Service firm has seen the number of top-rated funds owning its shares rose from 226 in Mar '16 to 411 in Mar '21, a reassuring sign concerning the I criteria. Its small supply of only 29.7 million shares outstanding (S criteria) can contribute to greater price volatility in the event of institutional buying or selling. It currently has a Timeliness Rating of B and a Sponsorship Rating of C.
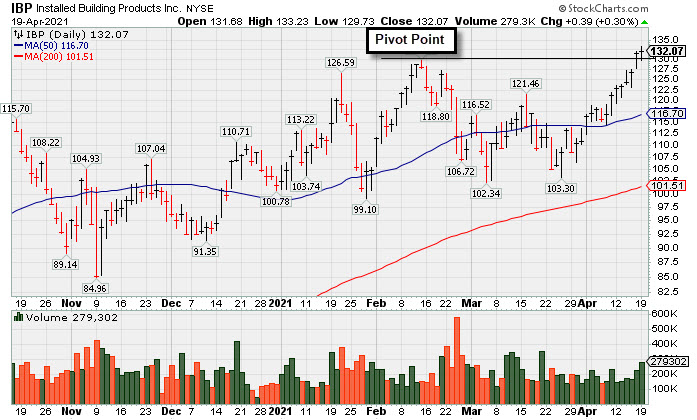
Steady Streak of Gains Into New High Territory - Monday, April 19, 2021
Installed Building Products (IBP +$0.39 or +0.30% to $132.07) was highlighted in yellow with new pivot point cited based on its 2/12/21 high plus 10 cents in the mid-day report (read here ). It is perched at its all-time high after 8 consecutive small gains lacking great volume conviction. Subsequent gains and strong close above its pivot point backed by at least +40% above average volume may trigger a proper technical buy signal.
IBP currently has an Earnings Per Share Rating of 97. It reported earnings +34% on +10% sales revenues for the Dec '20 quarter versus the year-ago period. Three of the past 4 consecutive quarterly comparisons were above the +25% minimum earnings guideline (C criteria). Its annual earnings (A criteria) history has been strong.
IBP was dropped from the Featured Stocks list and went through some choppy consolidations since last shown in this FSU section on 1/25/18 with an annotated graph under the headline, "Quietly Consolidating Near 50-Day Moving Average Line". IBP had traded up as much as +77.3% since first highlighted in the 2/27/17 mid-day report in yellow with pivot point cited based on its 12/08/16 high plus 10 cents (read here).
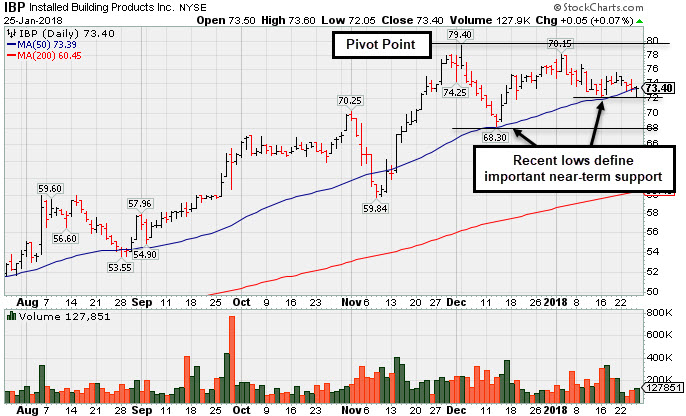
Quietly Consolidating Near 50-Day Moving Average Line - Thursday, January 25, 2018
Installed Building Products (IBP +$0.05 or +0.07% to $73.40) has been quietly consolidating near its 50-day moving average (DMA) line ($73.39). Recent lows ($72.30 on 1/16/18 and $68.30 on 12/13/17) define the next important support levels where violations may trigger more worrisome technical sell signals.
Subsequent volume-driven gains for new highs, meanwhile, may trigger a new (or add-on) technical buy signal. A new pivot point was cited based on its 12/04/17 high plus 10 cents. IBP was last shown in this FSU section on 12/26/17 with an annotated graph under the headline, "Building on an Advanced Ascending Base Pattern".
IBP traded up as much as +77.3% since first highlighted in the 2/27/17 mid-day report in yellow with pivot point cited based on its 12/08/16 high plus 10 cents (read here). Fundamentals remain strong after reporting earnings +30% on +31% sales revenues for the Sep '17 quarter, continuing its strong track record of quarterly comparisons with earnings increases well above the +25% minimum guideline (C criteria). Its annual earnings (A criteria) history has been strong since its $11 IPO on 2/13/14.
Its current Up/Down Volume Ratio of 1.0 is an unbiased neutral indication with regard to accumulation/distribution over the past 50 days. The high-ranked Building - Maintenance & Service firm has seen the number of top-rated funds owning its shares rose from 226 in Mar '16 to 300 in Dec '17, a reassuring sign concerning the I criteria. Its small supply of only 31.9 million shares outstanding (S criteria) can contribute to greater price volatility in the event of institutional buying or selling. It currently has a Timeliness Rating of B and a Sponsorship Rating of B.
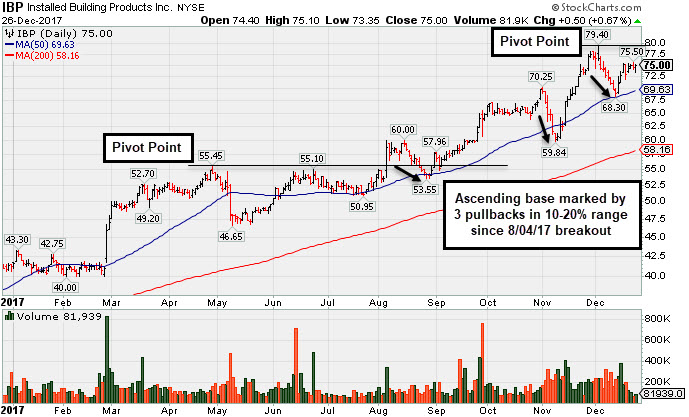
Building on an Advanced Ascending Base Pattern - Tuesday, December 26, 2017
Installed Building Products' (IBP +$0.50 or +0.67% to $75.00) recently found support at its 50-day moving average (DMA) line ($69.63). A new pivot point is cited based on its 12/04/17 high plus 10 cents and its color code is changed to yellow. There have been 3 pullbacks of 10-20% during its ongoing ascent since its 8/04/17 breakout, thus it has formed an advanced ascending base.
Subsequent volume-driven gains into new high territory may trigger a new (or add-on) technical buy signal. Any damaging losses leading to a violation of the 50 DMA line or recent low ($68.30 on 12/13/17) may trigger technical sell signals. Fundamentals remain strong. IBP was last shown in this FSU section on 12/01/17 with an annotated graph under the headline, "Extended From Any Sound Base After Impressive Rebound and Rally".
Subsequent volume-driven gains into new high territory may trigger a new (or add-on) technical buy signal. Any damaging losses leading to a violation of the 50 DMA line or recent low ($68.30 on 12/13/17) may trigger technical sell signals. Fundamentals remain strong. IBP was last shown in this FSU section on 12/01/17 with an annotated graph under the headline, "Extended From Any Sound Base After Impressive Rebound and Rally".
IBP traded up as much as +77.3% since first highlighted in the 2/27/17 mid-day report in yellow with pivot point cited based on its 12/08/16 high plus 10 cents (read here). Fundamentals remain strong after reporting earnings +30% on +31% sales revenues for the Sep '17 quarter, continuing its strong track record of quarterly comparisons with earnings increases well above the +25% minimum guideline (C criteria). Its annual earnings (A criteria) history has been strong since its $11 IPO on 2/13/14.
The high-ranked Building - Maintenance & Service firm has seen the number of top-rated funds owning its shares rose from 226 in Mar '16 to 295 in Sep '17, a reassuring sign concerning the I criteria. Its small supply of only 31.9 million shares outstanding (S criteria) can contribute to greater price volatility in the event of institutional buying or selling. It currently has a Timeliness Rating of A and a Sponsorship Rating of B.
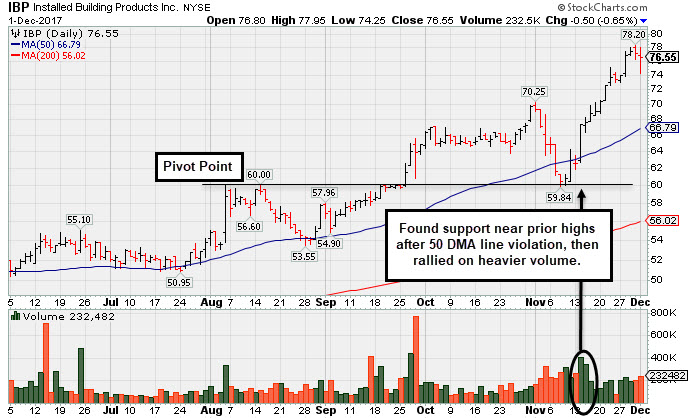
Extended From Any Sound Base After Impressive Rebound and Rally - Friday, December 1, 2017
Installed Building Products' (IBP -$0.50 or -0.65% to $76.55) is quietly perched near its all-time high, extended from any sound base. The 50-day moving average (DMA) line ($65) and recent low ($59.84 on 11/08/17) define important near-term support to watch on pullbacks.
IBP was last shown in this FSU section on 11/07/17 with an annotated graph under the headline, "50-Day Moving Average Violation Triggered Technical Sell Signal". It found support near the prior high in the $60 area, an old resistance level, then it rallied with even heavier volume and made it into new high territory without forming a sound base pattern.
IBP traded up as much as +74.4% since first highlighted in the 2/27/17 mid-day report in yellow with pivot point cited based on its 12/08/16 high plus 10 cents (read here). Fundamentals remain strong after reporting earnings +30% on +31% sales revenues for the Sep '17 quarter, continuing its strong track record of quarterly comparisons with earnings increases well above the +25% minimum guideline (C criteria). Its annual earnings (A criteria) history has been strong since its $11 IPO on 2/13/14.
The high-ranked Building - Maintenance & Service firm has seen the number of top-rated funds owning its shares rose from 226 in Mar '16 to 296 in Sep '17, a reassuring sign concerning the I criteria. Its small supply of only 31.9 million shares outstanding (S criteria) can contribute to greater price volatility in the event of institutional buying or selling. It currently has a Timeliness Rating of A and a Sponsorship Rating of B.
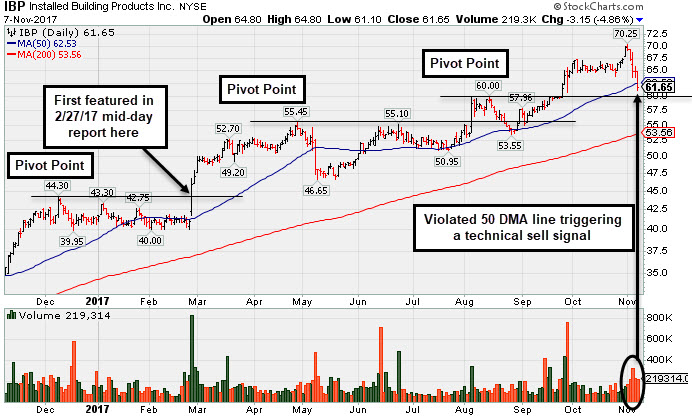
50-Day Moving Average Violation Triggered Technical Sell Signal - Tuesday, November 7, 2017
Installed Building Products' (IBP -$3.15 or -4.86% to $61.65) raised concerns and triggered a technical sell signal with today's 5th consecutive volume-driven loss leading to a 50-day moving average (DMA) line ($62.53) violation. Only a prompt rebound above the 50 DMA line would help its outlook improve. Prior highs in the $60 area also define important near-term support to watch.
IBP was last shown in this FSU section on 10/09/17 with an annotated graph under the headline, "Building - Maintenance & Service Firm Extended From Latest Base". It traded up as much as +56.7% since first highlighted in the 2/27/17 mid-day report in yellow with pivot point cited based on its 12/08/16 high plus 10 cents (read here).
Fundamentals remain strong after reporting earnings +30% on +31% sales revenues for the Sep '17 quarter, continuing its strong track record of quarterly comparisons with earnings increases well above the +25% minimum guideline (C criteria). Its annual earnings (A criteria) history has been strong since its $11 IPO on 2/13/14.
The high-ranked Building - Maintenance & Service firm has seen the number of top-rated funds owning its shares rose from 226 in Mar '16 to 299 in Sep '17, a reassuring sign concerning the I criteria. Its small supply of only 31.9 million shares outstanding (S criteria) can contribute to greater price volatility in the event of institutional buying or selling. It currently has a Timeliness Rating of B and a Sponsorship Rating of B.
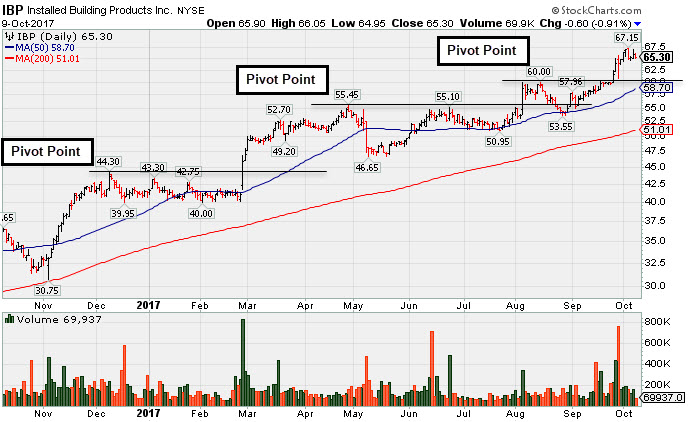
Building - Maintenance & Service Firm Extended From Latest Base - Monday, October 9, 2017
Installed Building Products' (IBP -$0.60 or -0.91% to $65.30) is slightly extended from its latest base. Prior highs in the $60 area define initial support above its 50-day moving average DMA line ($58.70) after the 9/26/17 gain and technical breakout backed by 71% above average volume.
IBP was last shown in this FSU section on 9/13/17 with an annotated graph under the headline, "Found Prompt Support Near Prior Highs and 50 Day Average". It traded up as much as +49.8% since first highlighted in the 2/27/17 mid-day report in yellow with pivot point cited based on its 12/08/16 high plus 10 cents (read here).
Fundamentals remain strong after reporting earnings +48% on +33% sales revenues for the Jun '17 quarter. The 3 latest quarterly comparisons had earnings increases well above the +25% minimum guideline (C criteria). Its annual earnings (A criteria) history has been strong since its $11 IPO on 2/13/14.
The high-ranked Building - Maintenance & Service firm has seen the number of top-rated funds owning its shares rose from 226 in Mar '16 to 290 in Jun '17, a reassuring sign concerning the I criteria. Its small supply of only 31.9 million shares outstanding (S criteria) can contribute to greater price volatility in the event of institutional buying or selling. It currently has a Timeliness Rating of A and a Sponsorship Rating of B.
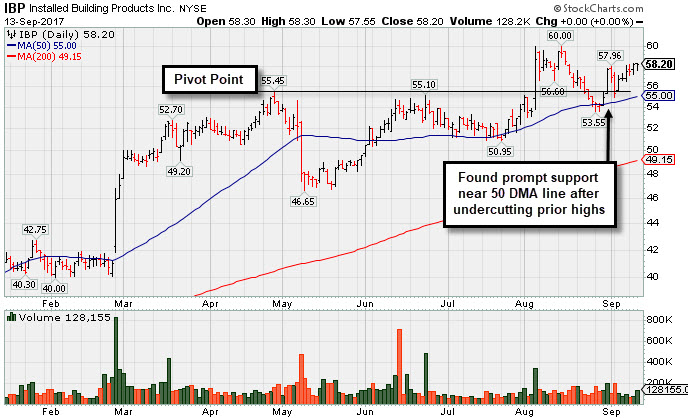
Found Prompt Support Near Prior Highs and 50 Day Average - Wednesday, September 13, 2017
Installed Building Products' (IBP $58.20) remains perched near its "max buy" level and within close striking distance of its all-time high. During its recent consolidation it found support near its 50-day moving average (DMA) line ($55) and prior highs. More damaging losses would raise greater concerns. IBP was last shown in this FSU section on 8/18/17 with an annotated graph under the headline, "Consolidating Near Prior High Following Breakout". It was highlighted in the 2/27/17 mid-day report in yellow with pivot point cited based on its 12/08/16 high plus 10 cents (read here).
Fundamentals remain strong after reporting earnings +48% on +33% sales revenues for the Jun '17 quarter. The 3 latest quarterly comparisons had earnings increases well above the +25% minimum guideline (C criteria). Its annual earnings (A criteria) history has been strong since its $11 IPO on 2/13/14.
The high-ranked Building - Maintenance & Service firm has seen the number of top-rated funds owning its shares rose from 226 in Mar '16 to 289 in Jun '17, a reassuring sign concerning the I criteria. Its small supply of only 31.9 million shares outstanding (S criteria) can contribute to greater price volatility in the event of institutional buying or selling. It currently has a Timeliness Rating of B and a Sponsorship Rating of B.
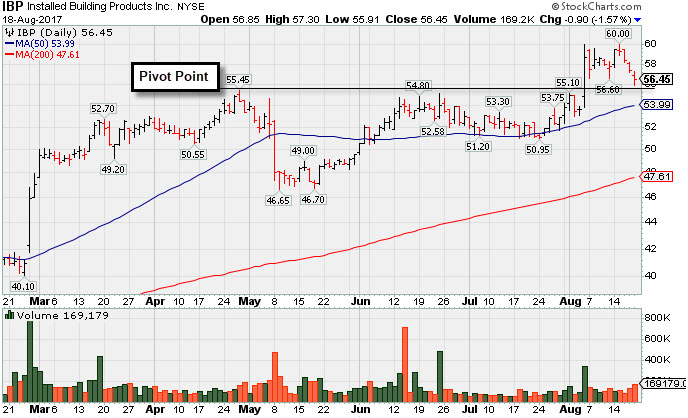
Consolidating Near Prior High Following Breakout - Friday, August 18, 2017
Installed Building Products' (IBP -$0.90 or -1.57% to $56.45) slumped back below its "max buy" level. Prior highs define initial support after its big volume-driven gain on 8/04/17 triggered a technical buy signal.
Fundamentals remain strong after reporting earnings +48% on +33% sales revenues for the Jun '17 quarter. The 3 latest quarterly comparisons had earnings increases well above the +25% minimum guideline (C criteria). Its annual earnings (A criteria) history has been strong since its $11 IPO on 2/13/14.
IBP was last shown in this FSU section on 7/17/17 with an annotated graph under the headline, "Volume Cooling While Staying Above 50-Day Moving Average Line". It was highlighted in the 2/27/17 mid-day report in yellow with pivot point cited based on its 12/08/16 high plus 10 cents (read here).
The high-ranked Building - Maintenance & Service firm has seen the number of top-rated funds owning its shares rose from 226 in Mar '16 to 286 in Jun '17, a reassuring sign concerning the I criteria. Its small supply of only 31.9 million shares outstanding (S criteria) can contribute to greater price volatility in the event of institutional buying or selling. It currently has a Timeliness Rating of A and a Sponsorship Rating of B.
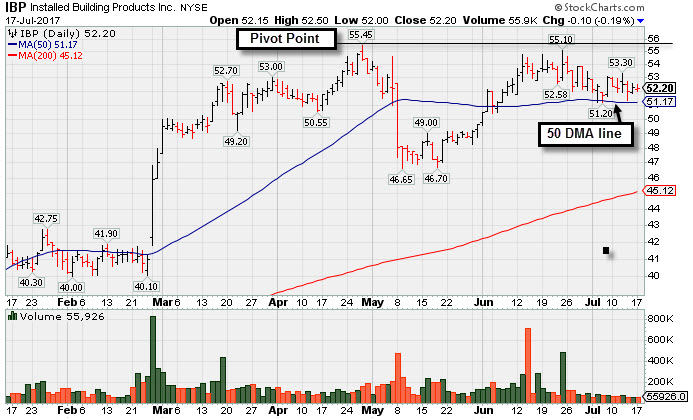
Volume Cooling While Staying Above 50-Day Moving Average Line - Monday, July 17, 2017
Installed Building Products' (IBP -$0.10 or -0.19% to $52.20) is consolidating above its 50-day moving average (DMA) line ($51.17). Volume totals have been lighter than average in recent weeks. Below that short-term average the recent low ($46.65 on 5/09/17) defines the next important support level.
IBP was last shown in this FSU section on 6/05/17 with an annotated graph under the headline, "Consolidating Near 50-Day Moving Average Line". It reported earnings +35% on +33% sales revenues for the Mar '17 quarter, and 3 of the 4 prior quarterly comparisons had earnings increases well above the +25% minimum guideline (C criteria). Its annual earnings (A criteria) history has been strong since its $11 IPO on 2/13/14. It was highlighted in the 2/27/17 mid-day report in yellow with pivot point cited based on its 12/08/16 high plus 10 cents (read here).
The high-ranked Building - Maintenance & Service firm has seen the number of top-rated funds owning its shares rose from 226 in Mar '16 to 276 in Mar '17, a reassuring sign concerning the I criteria. Its small supply of only 31.9 million shares outstanding (S criteria) can contribute to greater price volatility in the event of institutional buying or selling. It currently has a Timeliness Rating of B and a Sponsorship Rating of B.
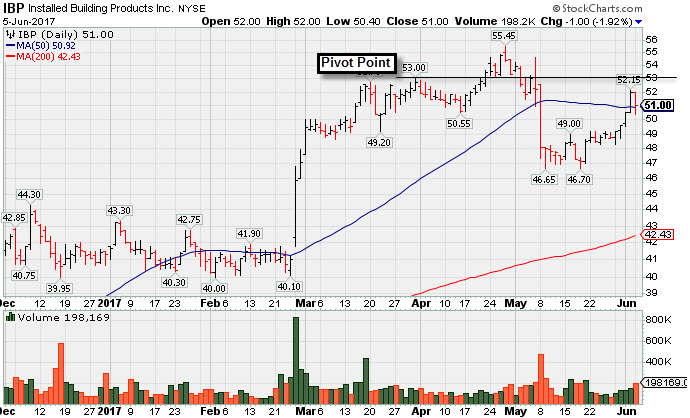
Consolidating Near 50-Day Moving Average Line - Monday, June 5, 2017
Installed Building Products' (IBP -$1.00 or -1.92% to $51.00) is consolidating near its 50-day moving average (DMA) line ($50.92). The recent low ($46.65 on 5/09/17) defines important near-term support.
IBP pulled back deeply undercutting its pivot point shortly after last shown in this FSU section on 5/04/17 with an annotated graph under the headline, "Due to Report Earnings Prior to Friday's Open". Volume and volatility often increase near earnings news. It reported earnings +35% on +33% sales revenues for the Mar '17 quarter, and 3 of the 4 prior quarterly comparisons had earnings increases well above the +25% minimum guideline (C criteria). Its annual earnings (A criteria) history has been strong since its $11 IPO on 2/13/14. It was highlighted in the 2/27/17 mid-day report in yellow with pivot point cited based on its 12/08/16 high plus 10 cents (read here).
The high-ranked Building - Maintenance & Service firm has seen the number of top-rated funds owning its shares rose from 226 in Mar '16 to 288 in Mar '17, a reassuring sign concerning the I criteria. Its small supply of only 31.9 million shares outstanding (S criteria) can contribute to greater price volatility in the event of institutional buying or selling. It currently has a Timeliness Rating of C and a Sponsorship Rating of B.
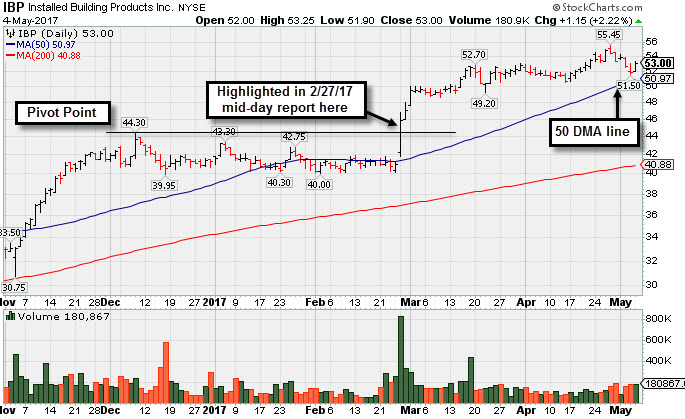
Due to Report Earnings Prior to Friday's Open - Thursday, May 4, 2017
Installed Building Products' (IBP +$1.15 or +2.22% to $53.00) is consolidating near its all-time high, very extended from its prior base. Its 50-day moving average (DMA) line ($50.97) defines important near-term support to watch on pullbacks. It is due to report earnings before the open on Friday, May 5th. Volume and volatility often increase near earnings news.
IBP was last shown in this FSU section on 4/04/17 with an annotated graph under the headline, "Hovering Near All-Time High Following Volume-Driven Gains". It was highlighted in the 2/27/17 mid-day report in yellow with pivot point cited based on its 12/08/16 high plus 10 cents (read here). Disciplined investors avoid chasing stocks extended more than 5% above prior highs.
The high-ranked Building - Maintenance & Service firm reported earnings +29% on +22% sales revenues for the Dec '16 quarter, and 3 of the 4 prior quarterly comparisons had earnings increases well above the +25% minimum guideline (C criteria). Its annual earnings (A criteria) history has been strong since its $11 IPO on 2/13/14.
The number of top-rated funds owning its shares rose from 226 in Mar '16 to 275 in Mar '17, a reassuring sign concerning the I criteria. Its small supply of only 31.8 million shares outstanding (S criteria) can contribute to greater price volatility in the event of institutional buying or selling. It currently has a Timeliness Rating of A and a Sponsorship Rating of B.
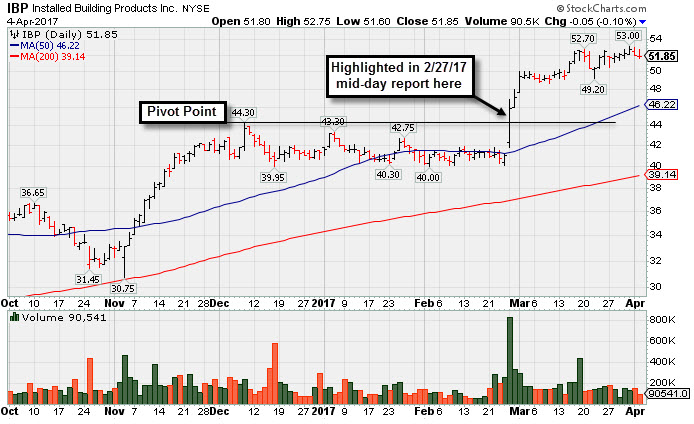
Hovering Near All-Time High Following Volume-Driven Gains - Tuesday, April 4, 2017
Installed Building Products' (IBP -$0.05 or -0.10% to $51.85) is hovering near its all-time high, very extended from its prior base following impressive volume-driven gains. No resistance remains due to overhead supply. Its 50-day moving average (DMA) line ($46.22) and prior highs in the $44 area define near-term support to watch on pullbacks.
IBP was last shown in this FSU section on 2/28/17 with an annotated graph under the headline, "Big Breakout Followed Solid Earnings News", after rallying above its "max buy" level. It was highlighted in the 2/27/17 mid-day report in yellow with pivot point cited based on its 12/08/16 high plus 10 cents (read here). Disciplined investors avoid chasing stocks extended more than 5% above prior highs.
The high-ranked Building - Maintenance & Service firm reported earnings +29% on +22% sales revenues for the Dec '16 quarter, and 3 of the 4 prior quarterly comparisons had earnings increases well above the +25% minimum guideline (C criteria). Its annual earnings (A criteria) history has been strong since its $11 IPO on 2/13/14.
The number of top-rated funds owning its shares rose from 226 in Mar '16 to 275 in Dec '16, a reassuring sign concerning the I criteria. Its small supply of only 31.8 million shares outstanding (S criteria) can contribute to greater price volatility in the event of institutional buying or selling. It currently has a Timeliness Rating of A and a Sponsorship Rating of B.
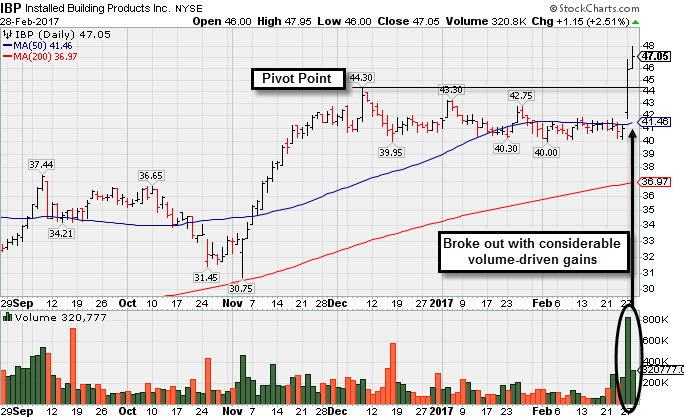
Big Breakout Followed Solid Earnings News - Tuesday, February 28, 2017
Installed Building Products' (IBP +$1.15 or +2.51% to $47.05) color code was changed to green after rallying above its "max buy" level. No resistance remains due to overhead supply. It was highlighted in the prior mid-day report in yellow with pivot point cited based on its 12/08/16 high plus 10 cents (read here). Disciplined investors avoid chasing stocks extended more than 5% above prior highs.
The high-ranked Building - Maintenance & Service firm reported earnings +29% on +22% sales revenues for the Dec '16 quarter, and 3 of the 4 prior quarterly comparisons had earnings increases well above the +25% minimum guideline (C criteria). Its annual earnings (A criteria) history has been strong since its $11 IPO on 2/13/14.
The number of top-rated funds owning its shares rose from 226 in Mar '16 to 270 in Dec '16, a reassuring sign concerning the I criteria. Its small supply of only 31.5 million shares outstanding (S criteria) can contribute to greater price volatility in the event of institutional buying or selling. It currently has a Timeliness Rating of C and a Sponsorship Rating of C.