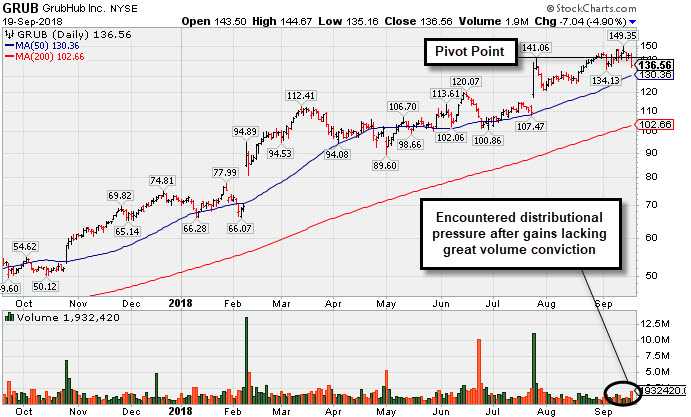
Wedged Higher Then Fell Below Pivot Point With Heavier Volume - Wednesday, September 19, 2018
Grubhub Inc (GRUB -$7.04 or -4.90% to $136.56) undercut the latest pivot point today as it pulled back with heavier volume while retreating from its all-time high. Recent gains lacked great volume conviction. Members were repeatedly reminded - "Gains above the pivot point backed by at least +40% above average volume are needed to trigger a proper new (or add-on) technical buy signal."
Bullish action came after GRUB reported earnings +92% on +51% sales revenues for the Jun '18 quarter. It was last shown in this FSU section on 8/02/18 with an annotated graph under the headline, "Hovering Near Record High Following Considerable Rally". The high-ranked Internet - Content firm traded up as much as +237.7% since first highlighted in yellow with pivot point cited based on its 9/29/16 high plus 10 cents in the 4/28/17 mid-day report (read here).
Its annual earnings (A criteria) history has been very strong since it completed a new Public Offering on 9/03/14. GRUB has earned a current Timeliness rating of A and a Sponsorship rating of B, and its Accumulation/Distribution rating is C+. The number of top-rated funds owning its shares rose from 376 in Mar '17 to 589 in Jun '18, a reassuring sign concerning the I criteria. The current Up/Down Volume Ratio of 1.3 is an unbiased indication its shares have been under accumulation over the past 50 days. It has a fairly small supply of only 90.5 million shares (S criteria) outstanding, which can contribute to greater price volatility in the event of institutional buying or selling.
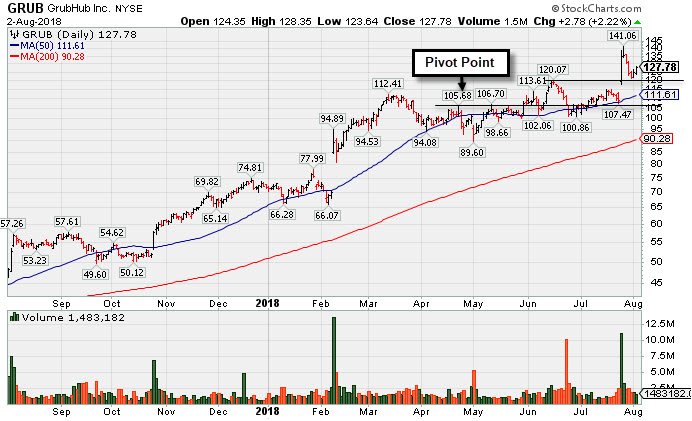
Hovering Near Record High Following Considerable Rally - Thursday, August 2, 2018
Grubhub Inc (GRUB +$2.78 or +2.22% to $127.78) is consolidating above the prior high ($120). Fundamentals remain strong. Patient investors may watch for a new base or secondary buy point to develop and be noted in the weeks ahead.
Bullish action came after GRUB reported earnings +92% on +51% sales revenues for the Jun '18 quarter. It was last shown in this FSU section on 6/12/18 with an annotated graph under the headline, "Gain With +25% Above Average Volume for Best Ever Close". The high-ranked Internet - Content firm traded up as much as +219% since first highlighted in yellow with pivot point cited based on its 9/29/16 high plus 10 cents in the 4/28/17 mid-day report (read here).
Its annual earnings (A criteria) history has been very strong since it completed a new Public Offering on 9/03/14. GRUB has earned a current Timeliness rating of A and a Sponsorship rating of B, and its Accumulation/Distribution rating is C. The number of top-rated funds owning its shares rose from 376 in Mar '17 to 543 in Jun '18, a reassuring sign concerning the I criteria. The current Up/Down Volume Ratio of 0.9 is an unbiased indication its shares have been under slight distributional pressure over the past 50 days. It has a fairly small supply of only 90.2 million shares (S criteria) outstanding, which can contribute to greater price volatility in the event of institutional buying or selling.
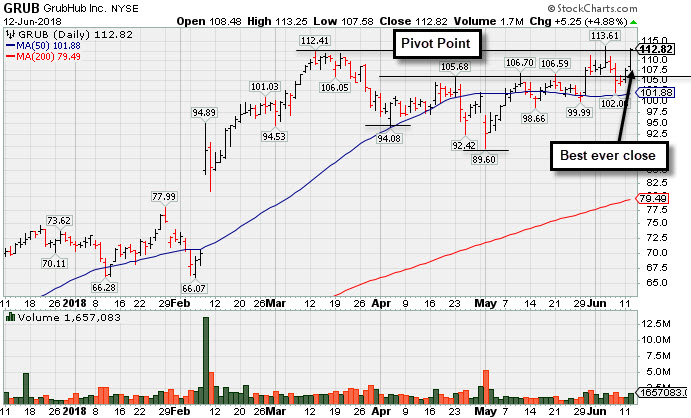
Gain With +25% Above Average Volume for Best Ever Close -
Grubhub Inc (GRUB +$5.25 or +4.88% to $112.82) posted a big gain today backed by +25% above average volume and managed a best-ever close. Its color code is changed to green after rising above the "max buy" level. Disciplined investors will note that recent gains above the pivot point cited lacked the +40% above average volume needed to trigger a convincing technical buy signal. It found support near its 50-day moving average (DMA) line ($101.88) during its recent consolidation.
GRUB reported earnings +79% on +49% sales revenues for the Mar '18 quarter and showed mostly bullish action after last shown in this FSU section on 4/30/18 with an annotated graph under the headline, "Consolidating Near 50 Day Average With Earnings News Due - 4/30/2018 ".
The high-ranked Internet - Content firm traded up as much as +157% since first highlighted in yellow with pivot point cited based on its 9/29/16 high plus 10 cents in the 4/28/17 mid-day report (read here). Its annual earnings (A criteria) history has been very strong since it completed a new Public Offering on 9/03/14.
It has earned a current Timeliness rating of A and a Sponsorship rating of B, and its Accumulation/Distribution rating is C. The number of top-rated funds owning its shares rose from 376 in Mar '17 to 521 in Mar '18, a reassuring sign concerning the I criteria. The current Up/Down Volume Ratio of 1.1 is an unbiased indication its shares have been under only slight accumulation over the past 50 days. It has a fairly small supply of only 90.2 million shares (S criteria) outstanding, which can contribute to greater price volatility in the event of institutional buying or selling.
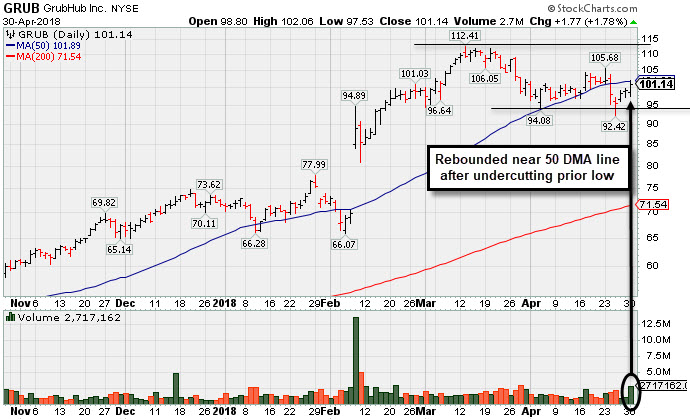
Consolidating Near 50 Day Average With Earnings News Due - Monday, April 30, 2018
Grubhub Inc (GRUB +$1.77 or +1.78% to $101.14) rebounded near its 50-day moving average (DMA) line ($101.89). The recent low ($92.42 on 4/25/18) defines where further deterioration would raise more serious concerns. Before the open tomorrow the company is due to report earnings news for the latest quarter. Volume and volatility often increase near earnings news.
It reported earnings +61% on +49% sales revenues for the Dec '17 quarter and what followed was bullish action including a big "breakaway gap" on 2/08/18. It was last shown in this FSU section on 3/29/18 with an annotated graph under the headline, "Very Extended and Enduring Distributional Pressure".
GRUB traded up as much as +154% since first highlighted in yellow with pivot point cited based on its 9/29/16 high plus 10 cents in the 4/28/17 mid-day report (read here). Its annual earnings (A criteria) history has been very strong since the high ranked Internet Content firm completed a new Public Offering on 9/03/14.
It has earned a current Timeliness rating of A and a Sponsorship rating of B, and its Accumulation/Distribution rating is C. The number of top-rated funds owning its shares rose from 376 in Mar '17 to 489 in Mar '18, a reassuring sign concerning the I criteria. The current Up/Down Volume Ratio of 1.1 is an unbiased indication its shares have been under only slight accumulation over the past 50 days. It has a fairly small supply of only 87.2 million shares (S criteria) outstanding, which can contribute to greater price volatility in the event of institutional buying or selling.
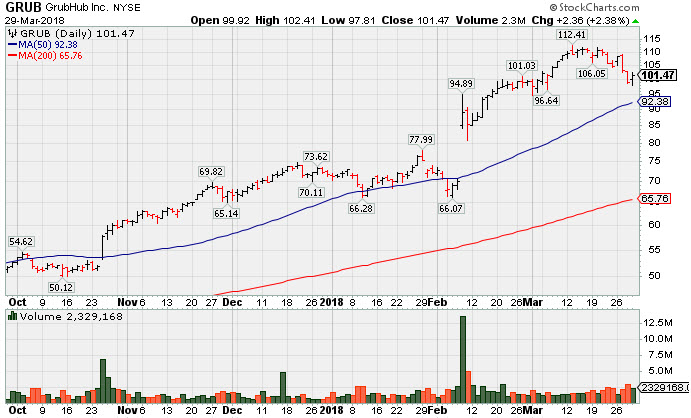
Very Extended and Enduring Distributional Pressure -
Grubhub Inc (GRUB +$2.36 or +2.38% to $101.47) has been enduring distributional pressure in recent weeks and pulling back after getting very extended from any sound base. Its 50-day moving average (DMA) line ($92.30) defines near-term support. Recently reported earnings +61% on +49% sales revenues for the Dec '17 quarter.
is perched near its all-time high, very extended from any sound base. Recently it reported earnings +61% on +49% sales revenues for the Dec '17 quarter, followed by bullish action including a big "breakaway gap" on 2/08/18. It was last shown in this FSU section on 2/07/18 with an annotated graph under the headline, "Slumped Below 50-Day Average With Earnings News Due".
Prior to the latest report, Grubhub had reported Sep '17 quarterly earnings +22% on +32% sales revenues, marking a 2nd quarter were below the +25% minimum earnings guideline (C criteria) of the fact-based investment system.
GRUB traded up as much as +154% since first highlighted in yellow with pivot point cited based on its 9/29/16 high plus 10 cents in the 4/28/17 mid-day report (read here). Its annual earnings (A criteria) history has been very strong since the high ranked Internet Content firm completed a new Public Offering on 9/03/14.
It has earned a current Timeliness rating of A and a Sponsorship rating of B, and its Accumulation/Distribution rating is E. The number of top-rated funds owning its shares rose from 376 in Mar '17 to 466 in Dec '17, a reassuring sign concerning the I criteria. The current Up/Down Volume Ratio of 1.4 is an unbiased indication its shares have been under accumulation over the past 50 days. It has a fairly small supply of only 87.2 million shares (S criteria) outstanding, which can contribute to greater price volatility in the event of institutional buying or selling.
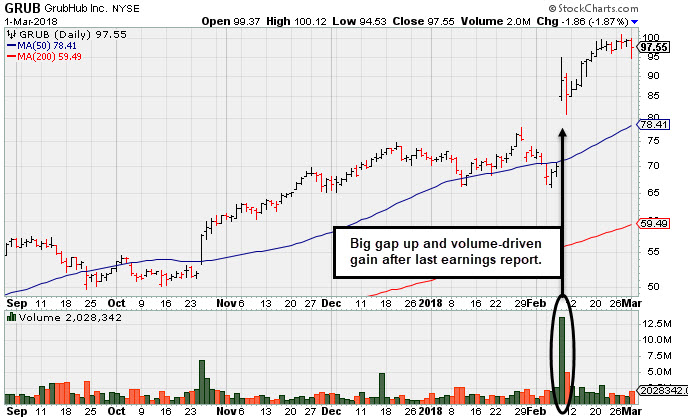
Bullish Action Followed Last Earnings Report - Thursday, March 1, 2018
Grubhub Inc (GRUB -$1.86 or -1.87% to $97.55) is perched near its all-time high, very extended from any sound base. Recently it reported earnings +61% on +49% sales revenues for the Dec '17 quarter, followed by bullish action including a big "breakaway gap" on 2/08/18. It was last shown in this FSU section on 2/07/18 with an annotated graph under the headline, "Slumped Below 50-Day Average With Earnings News Due".
Prior to the latest report, Grubhub had reported Sep '17 quarterly earnings +22% on +32% sales revenues, marking a 2nd quarter were below the +25% minimum earnings guideline (C criteria) of the fact-based investment system.
GRUB traded up as much as +128.4% since first highlighted in yellow with pivot point cited based on its 9/29/16 high plus 10 cents in the 4/28/17 mid-day report (read here). Its annual earnings (A criteria) history has been very strong since the high ranked Internet Content firm completed a new Public Offering on 9/03/14.
It has earned a current Timeliness rating of A and a Sponsorship rating of C, and its Accumulation/Distribution rating is B. The number of top-rated funds owning its shares rose from 318 in Jun '16 to 462 in Dec '17, a reassuring sign concerning the I criteria. The current Up/Down Volume Ratio of 1.8 is an unbiased indication its shares have been under accumulation over the past 50 days. It has a fairly small supply of only 86.7 million shares (S criteria) outstanding, which can contribute to greater price volatility in the event of institutional buying or selling.
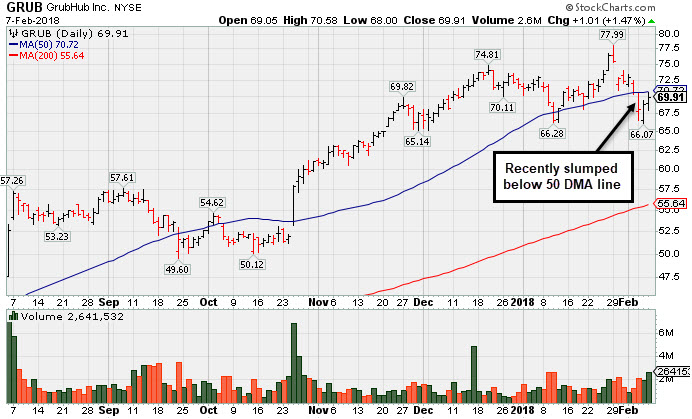
Slumped Below 50-Day Average With Earnings News Due - Wednesday, February 7, 2018
Grubhub Inc (GRUB +$1.01 or +1.47% to $69.91) undercut the prior low ($66.28 on 1/10/18) and managed a "positive reversal" on the prior session. Only a prompt rebound above the 50-day moving average (DMA) line ($70.72) would help its outlook improve. It is due to report its fourth quarter financial results on Thursday, Feb. 8, 2018 before the market open. Volume and volatility often increase near earnings news.
A lot of bullish action has come even after Grubhub reported Sep '17 quarterly earnings +22% on +32% sales revenues. The 2 latest quarters were below the +25% minimum earnings guideline (C criteria), raising fundamental concerns with regard to the fact-based investment system.
GRUB traded up as much as +76.37% since first highlighted in yellow with pivot point cited based on its 9/29/16 high plus 10 cents in the 4/28/17 mid-day report (read here). Its annual earnings (A criteria) history has been very strong since the high ranked Internet Content firm completed a new Public Offering on 9/03/14.
It has earned a current Timeliness rating of A and a Sponsorship rating of C, but its Accumulation/Distribution rating is D. It was last shown in this FSU section on 1/11/18 with an annotated graph under the headline, "Prompt Rebound Above 50-Day Moving Average Helped Outlook". The number of top-rated funds owning its shares rose from 318 in Jun '16 to 462 in Dec '17, a reassuring sign concerning the I criteria. The current Up/Down Volume Ratio of 1.1 is an unbiased indication its shares have been under slight accumulation over the past 50 days. It has a fairly small supply of only 86.7 million shares (S criteria) outstanding, which can contribute to greater price volatility in the event of institutional buying or selling.
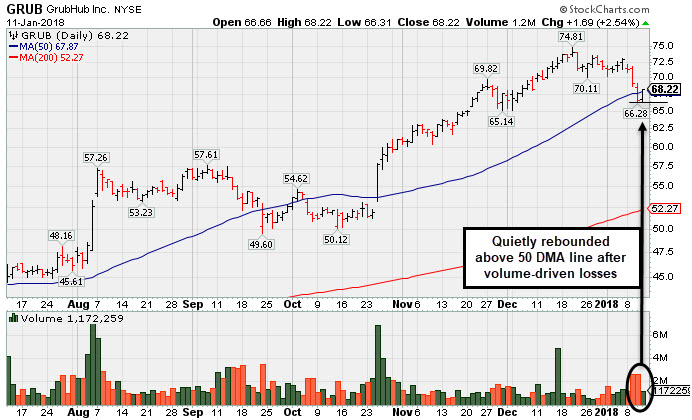
Prompt Rebound Above 50-Day Moving Average Helped Outlook - Thursday, January 11, 2018
Grubhub Inc (GRUB +$1.69 or +2.54% to $68.22) posted a gain today with only average volume, yet the close back above its 50-day moving average (DMA) line ($67.86) helped its outlook improve. Subsequent losses violating the 50 DMA line and prior session's low ($66.28) would raise greater concerns and trigger a more worrisome technical sell signal.
A lot of bullish action has come even after Grubhub reported Sep '17 quarterly earnings +22% on +32% sales revenues. The 2 latest quarters were below the +25% minimum earnings guideline (C criteria), raising fundamental concerns with regard to the fact-based investment system.
GRUB traded up as much as +69.2% since first highlighted in yellow with pivot point cited based on its 9/29/16 high plus 10 cents in the 4/28/17 mid-day report (read here). Its annual earnings (A criteria) history has been very strong since the high ranked Internet Content firm completed a new Public Offering on 9/03/14.
It has earned a current Timeliness rating of A and a Sponsorship rating of C, but its Accumulation/Distribution rating is D-. It was last shown in this FSU section on 12/18/17 with an annotated graph under the headline, "Extended From Any Base, Grubhub Hits Another New Record High". The number of top-rated funds owning its shares rose from 318 in Jun '16 to 457 in Sep '17, a reassuring sign concerning the I criteria. The current Up/Down Volume Ratio of 1.3 is an unbiased indication its shares have been under slight accumulation over the past 50 days. It has a fairly small supply of only 86.7 million shares (S criteria) outstanding, which can contribute to greater price volatility in the event of institutional buying or selling.
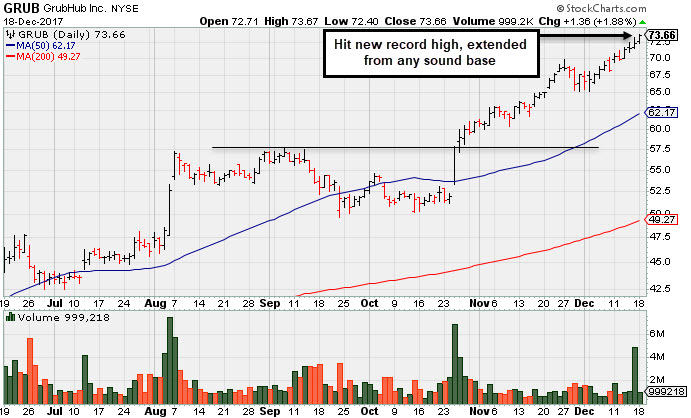
Extended From Any Base, Grubhub Hits Another New Record High - Monday, December 18, 2017
Grubhub Inc (GRUB +$1.36 or +1.88% to $73.66) hit yet another new all-time high with today's gain backed by lighter than average volume, getting very extended from any sound base. Its 50-day moving average (DMA) line ($62.17) and prior highs near $57 define support to watch on pullbacks.
Bullish action has continued after Grubhub reported Sep '17 quarterly earnings +22% on +32% sales revenues. The 2 latest quarters were below the +25% minimum earnings guideline (C criteria), raising fundamental concerns with regard to the fact-based investment system.
GRUB is up +66.6% since first highlighted in yellow with pivot point cited based on its 9/29/16 high plus 10 cents in the 4/28/17 mid-day report (read here). Its annual earnings (A criteria) history has been very strong since the high ranked Internet Content firm completed a new Public Offering on 9/03/14.
It has earned a current Timeliness rating of A and a Sponsorship rating of B. It was last shown in this FSU section on 11/22/17 with an annotated graph under the headline, "Extended From Prior Highs After Gains on Light Volume". The number of top-rated funds owning its shares rose from 318 in Jun '16 to 446 in Sep '17, a reassuring sign concerning the I criteria. The current Up/Down Volume Ratio of 1.9 is an unbiased indication its shares have been under slight accumulation over the past 50 days. It has a fairly small supply of only 84.1 million shares (S criteria) outstanding, which can contribute to greater price volatility in the event of institutional buying or selling.
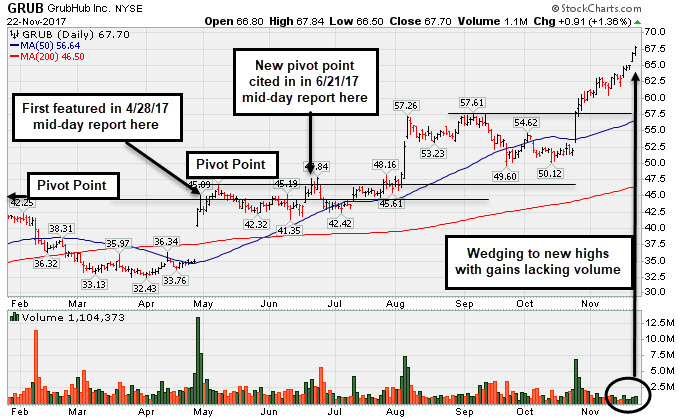
Extended From Prior Highs After Gains on Light Volume - Wednesday, November 22, 2017
Grubhub Inc (GRUB +$0.93 or +1.39% to $67.72) hit yet another new all-time high today, adding to recent gains lacking great volume conviction, getting even more extended from any sound base. Disciplined investors avoid chasing stocks more than +5% above their pivot point or prior high.
Bullish action has continued after Grubhub reported Sep '17 quarterly earnings +22% on +32% sales revenues. The 2 latest quarters were below the +25% minimum earnings guideline (C criteria), raising fundamental concerns with regard to the fact-based investment system.
The impressive rebound above its 50-day moving average (DMA) line on 10/25/17 helped its outlook improve as volume behind the big gain was +310% above its average daily volume.
GRUB is up +53.1% since first highlighted in yellow with pivot point cited based on its 9/29/16 high plus 10 cents in the 4/28/17 mid-day report (read here). Its annual earnings (A criteria) history has been very strong since the high ranked Internet Content firm completed a new Public Offering on 9/03/14.
It has earned a current Timeliness rating of B and a Sponsorship rating of C. It was last shown in this FSU section on 10/27/17 with an annotated graph under the headline, "Technical Strength in Popular Internet Platform". The number of top-rated funds owning its shares rose from 318 in Jun '16 to 440 in Sep '17, a reassuring sign concerning the I criteria. The current Up/Down Volume Ratio of 1.1 is an unbiased indication its shares have been under slight accumulation over the past 50 days. It has a fairly small supply of only 84.1 million shares (S criteria) outstanding, which can contribute to greater price volatility in the event of institutional buying or selling.
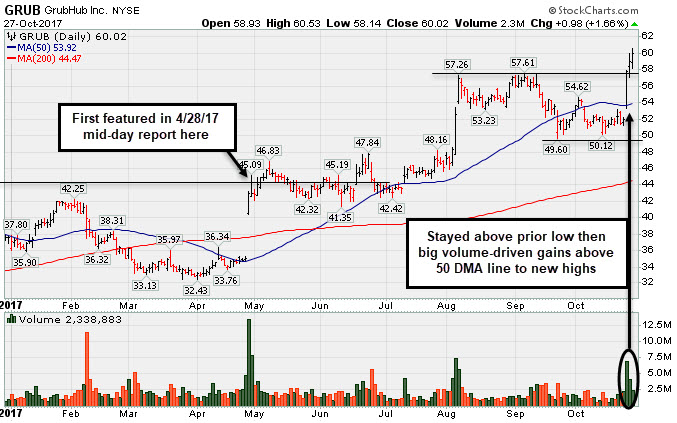
Technical Strength in Popular Internet Platform - Friday, October 27, 2017
Grubhub Inc (GRUB +$0.98 or +1.66% to $60.02) has been very strong technically, and it hit another new high with today's 4th consecutive gain. The impressive rebound above its 50-day moving average (DMA) line on 10/25/17 helped its outlook improve as volume behind the big gain was +310% above its average daily volume. However, it reported Sep '17 quarterly earnings +22% on +32% sales revenues, marking its 2nd consecutive quarter below the +25% minimum earnings guideline (C criteria). So, fundamental concerns remain with regard to the fact-based investment system's guidelines for buy candidates.
GRUB has earned a current Timeliness rating of B and also a Sponsorship rating of B. It is up +35.3% since first highlighted in yellow with pivot point cited based on its 9/29/16 high plus 10 cents in the 4/28/17 mid-day report (read here). Its annual earnings (A criteria) history has been very strong since the high ranked Internet Content firm completed a new Public Offering on 9/03/14.
It slumped but avoided undercutting its prior low ($49.60 on 9/22/17) since last shown in this FSU section on 10/02/17 with an annotated graph under the headline, "Gain Above 50-Day Moving Average Line Helped Technical Stance". The number of top-rated funds owning its shares rose from 318 in Jun '16 to 428 in Sep '17, a reassuring sign concerning the I criteria. The current Up/Down Volume Ratio of 1.1 is an unbiased indication its shares have been under slight accumulation over the past 50 days. It has a fairly small supply of only 83.8 million shares (S criteria) outstanding, which can contribute to greater price volatility in the event of institutional buying or selling.
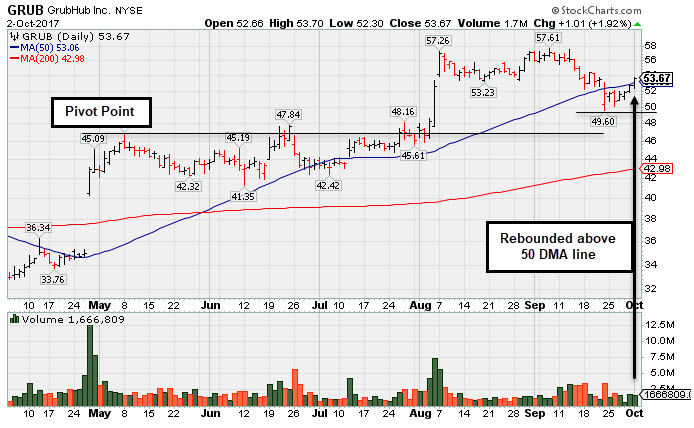
Gain Above 50-Day Moving Average Line Helped Technical Stance - Monday, October 2, 2017
Grubhub Inc (GRUB +$1.01 or +1.92% to $53.67) posted a gain today with near average volume as it rebounded above its 50-day moving average (DMA) line ($53.06) helping its outlook to improve. More damaging losses below the recent low ($49.60 on 9/22/17) would raise greater concerns. The next near-term support is prior highs in the $47 area.
Recently it reported earnings +13% on +32% sales revenues for the Jun '17 quarter, below the +25% minimum earnings guideline (C criteria) raising fundamental concerns Only 2 of the past four quarterly earnings were above the +25% minimum guideline (C criteria). Its annual earnings (A criteria) history has been very strong since the high ranked Internet Content firm completed a new Public Offering on 9/03/14.
GRUB was last shown in this FSU section on 9/07/17 with an annotated graph under the headline, "Touched New High With Quiet Gain From Brief Consolidation". It has traded up +30.2% since first highlighted in yellow with pivot point cited based on its 9/29/16 high plus 10 cents in the 4/28/17 mid-day report (read here).
The number of top-rated funds owning its shares rose from 318 in Jun '16 to 413 in Jun '17, a reassuring sign concerning the I criteria. The current Up/Down Volume Ratio of 1.1 is an unbiased indication its shares have been under slight accumulation over the past 50 days. It has a fairly small supply of only 83.8 million shares (S criteria) outstanding, which can contribute to greater price volatility in the event of institutional buying or selling.
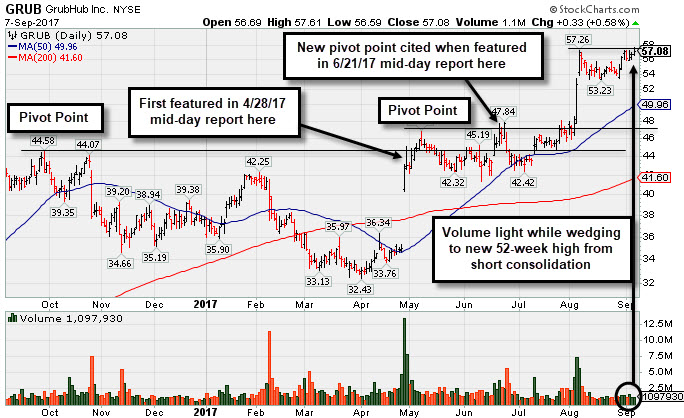
Touched New High With Quiet Gain From Brief Consolidation - Thursday, September 7, 2017
Grubhub Inc (GRUB +$0.33 or +0.58% to $57.08) inched to a new high with light volume. The latest consolidation was too short to be an ideal base. It stubbornly holding its ground near its all-time high. Its 50-day moving average (DMA) line ($49.96) defines near-term support above prior highs in the $46-47 area.
It recently reported earnings +13% on +32% sales revenues for the Jun '17 quarter, below the +25% minimum earnings guideline (C criteria) raising fundamental concerns. Only 2 of the past four quarterly earnings were above the +25% minimum guideline (C criteria). Its annual earnings (A criteria) history has been very strong since the high ranked Internet Content firm completed a new Public Offering on 9/03/14.
GRUB was last shown in this FSU section on 8/08/17 with an annotated graph under the headline, "Spiked Into New High Territory Despite Sub Par Earnings News". It has traded up +30.2% since first highlighted in yellow with pivot point cited based on its 9/29/16 high plus 10 cents in the 4/28/17 mid-day report (read here).
The number of top-rated funds owning its shares rose from 318 in Jun '16 to 412 in Jun '17, a reassuring sign concerning the I criteria. The current Up/Down Volume Ratio of 1.4 is an unbiased indication its shares have been under accumulation over the past 50 days. It has a fairly small supply of only 83.8 million shares (S criteria) outstanding, which can contribute to greater price volatility in the event of institutional buying or selling.
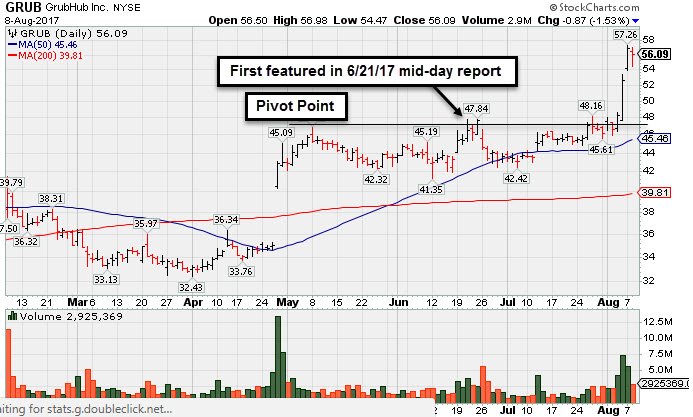
Spiked Into New High Territory Despite Sub Par Earnings News - Tuesday, August 8, 2017
Grubhub Inc (GRUB (-$0.87 or -1.53% to $56.09) pulled back today after spiking to new 52-week and all-time highs with 3 consecutive volume-driven gains. Its color code was changed to green after rallying well above its "max buy" level, getting very extended from any sound base.
It recently reported earnings +13% on +32% sales revenues for the Jun '17 quarter, below the +25% minimum earnings guideline (C criteria) raising fundamental concerns. Only 2 of the past four quarterly earnings were above the +25% minimum guideline (C criteria). Its annual earnings (A criteria) history has been very strong since the high ranked Internet Content firm completed a new Public Offering on 9/03/14.
GRUB was last shown in this FSU section on 6/30/17 with an annotated graph under the headline, "Found Prompt Support at 50-Day Moving Average". It was highlighted in yellow with pivot point cited based on its 9/29/16 high plus 10 cents in the 4/28/17 mid-day report (read here).
The number of top-rated funds owning its shares rose from 318 in Jun '16 to 397 in Jun '17, a reassuring sign concerning the I criteria. The current Up/Down Volume Ratio of 1.3 is an unbiased indication its shares have been under accumulation over the past 50 days. It has a fairly small supply of only 83.6 million shares (S criteria) outstanding, which can contribute to greater price volatility in the event of institutional buying or selling.
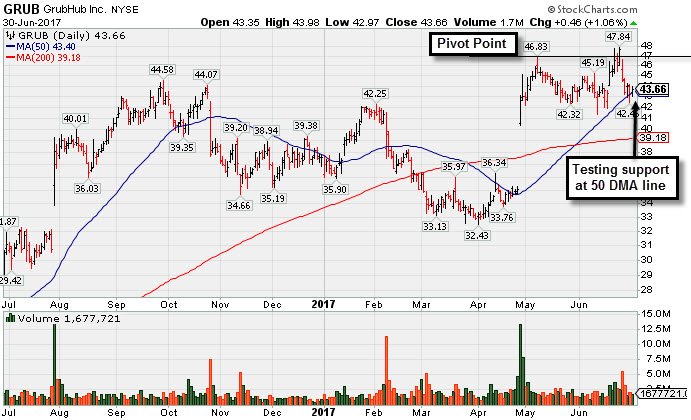
Found Prompt Support at 50-Day Moving Average - Friday, June 30, 2017
Grubhub Inc (GRUB (+$0.46 or +1.06% to $43.66) has been testing support at its 50-day moving average DMA line ($43.40). More damaging losses would raise greater concerns. A new pivot point was recently cited based on its 5/08/17 high plus 10 cents. A confirming gain backed by at least +40% above average volume and strong close above the pivot point may clinch a technical buy signal. Little resistance remains due to overhead supply.
GRUB was last shown in this FSU section on 5/22/17 with an annotated graph under the headline, "Stalled After Reaching New Highs and Encountered Mild Pressure". It was highlighted in yellow with pivot point cited based on its 9/29/16 high plus 10 cents in the 4/28/17 mid-day report (read here). It reported Mar '17 quarterly earnings +45% on +39% sales revenues. Three of the past four quarterly earnings were above the +25% minimum guideline (C criteria). Its annual earnings (A criteria) history has been very strong since the high ranked Internet Content firm completed a new Public Offering on 9/03/14.
The number of top-rated funds owning its shares rose from 318 in Jun '16 to 385 in Mar '17, a reassuring sign concerning the I criteria. The current Up/Down Volume Ratio of 1.4 is an unbiased indication its shares have been under accumulation over the past 50 days. It has a fairly small supply of only 83.4 million shares (S criteria) outstanding, which can contribute to greater price volatility in the event of institutional buying or selling.
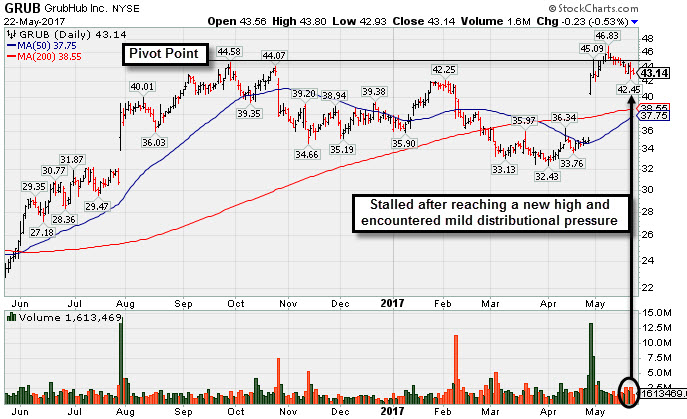
Stalled After Reaching New Highs and Encountered Mild Pressure - Monday, May 22, 2017
Grubhub Inc (GRUB (-$0.23 or -0.53% to $43.14) has pulled back below its pivot point with recent losses raising some concerns. It stalled after recently reaching a new high and it has encountered mild distributional pressure. A confirming gain backed by at least +40% above average volume and strong close above the pivot point may clinch a technical buy signal. Little resistance remains due to overhead supply.
It was last shown in this FSU section on 4/28/17 with an annotated graph under the headline, "Hit New 52-Week High But Ended Near Session Low". It was highlighted in yellow with pivot point cited based on its 9/29/16 high plus 10 cents in the 4/28/17 mid-day report (read here). It reported Mar '17 quarterly earnings +45% on +39% sales revenues. Three of the past four quarterly earnings were above the +25% minimum guideline (C criteria). Its annual earnings (A criteria) history has been very strong since the high ranked Internet Content firm completed a new Public Offering on 9/03/14.
The number of top-rated funds owning its shares rose from 318 in Jun '16 to 385 in Mar '17, a reassuring sign concerning the I criteria. The current Up/Down Volume Ratio of 1.9 is an unbiased indication its shares have been under accumulation over the past 50 days. It has a fairly small supply of only 83.4 million shares (S criteria) outstanding, which can contribute to greater price volatility in the event of institutional buying or selling.
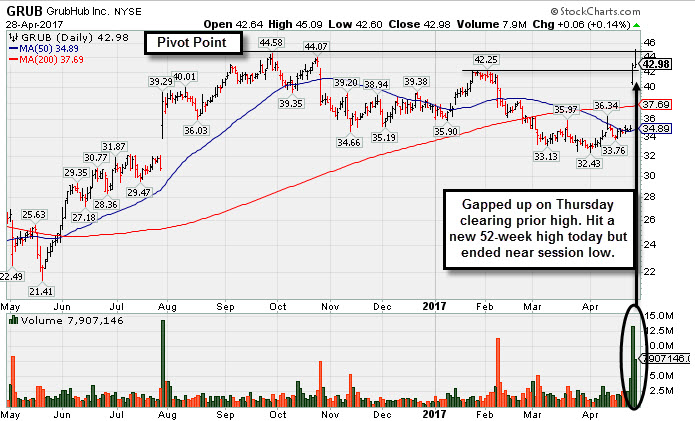
Hit New 52-Week High But Ended Near Session Low - Friday, April 28, 2017
Grubhub Inc (GRUB (+$0.06 or +0.14% to $42.98) was highlighted in yellow with pivot point cited based on its 9/29/16 high plus 10 cents in the earlier mid-day report (read here). It gapped up on the prior session for a big volume-driven gain, rallying above prior highs. It touched a new 52-week high (N criteria) early Friday, but ended near the session low. Very little resistance remains due to overhead supply. Subsequent volume-driven gains for a strong close above the pivot point may clinch a more convincing technical buy signal.
It reported Mar '17 quarterly earnings +45% on +39% sales revenues. Three of the past four quarterly earnings were above the +25% minimum guideline (C criteria). Its annual earnings (A criteria) history has been very strong since the high ranked Internet Content firm completed a new Public Offering on 9/03/14.
It reported Mar '17 quarterly earnings +45% on +39% sales revenues. Three of the past four quarterly earnings were above the +25% minimum guideline (C criteria). Its annual earnings (A criteria) history has been very strong since the high ranked Internet Content firm completed a new Public Offering on 9/03/14.
The number of top-rated funds owning its shares rose from 318 in Jun '16 to 398 in Mar '17, a reassuring sign concerning the I criteria. The current Up/Down Volume Ratio of 1.5 is an unbiased indication its shares have been under accumulation over the past 50 days. It has a fairly small supply of only 83.4 million shares (S criteria) outstanding, which can contribute to greater price volatility in the event of institutional buying or selling.
Charts used courtesy of www.stockcharts.com