***Last / Change / Volume data in this table is the closing quote data***
Symbol/Exchange
Company Name
Industry Group |
PRICE |
CHANGE
(%Change) |
Day High |
Volume
(% DAV)
(% 50 day avg vol) |
52 Wk Hi
% From Hi |
Featured
Date |
Price
Featured |
Pivot Featured |
|
Max Buy |
 NSP
-
NYSE
NSP
-
NYSE
Insperity Inc
Comml Svcs-Outsourcing
|
$137.77
|
+2.44
1.80% |
$137.81
|
291,478
100.51% of 50 DAV
50 DAV is 290,000
|
$136.83
0.69%
|
7/19/2019
|
$136.39
|
PP = $132.60
|
|
MB = $139.23
|
 Most Recent Note - 7/22/2019 5:33:31 PM
Y - Posted a 4th consecutive gain today on lighter volume as it hit anther new all-time high after rallying from a 5-month base. The prior session's gain above the pivot point was backed by +64% above average volume helping to trigger a proper technical buy signal. Recently reported earnings +40% on +14% sales revenues for the Mar '19 quarter.
>>> FEATURED STOCK ARTICLE : Insperity Hit New High With +55% Above Average Volume - 7/19/2019 |
View all notes |
Set NEW NOTE alert |
Company Profile |
SEC
News |
Chart |
Request a new note
C
A
S
I |
SPSC
-
NASDAQ
S P S Commerce Inc
COMPUTER SOFTWARE and SERVICES - Application Software
|
$102.02
|
+1.42
1.41% |
$102.61
|
85,043
63.94% of 50 DAV
50 DAV is 133,000
|
$115.00
-11.29%
|
6/7/2019
|
$107.72
|
PP = $115.10
|
|
MB = $120.86
|
Most Recent Note - 7/22/2019 1:47:27 PM
G - Met resistance at its 50 DMA line ($103.79) which is now downward sloping. A rebound above the 50 DMA line is needed to help its outlook improve. Subsequent volume-driven gains above the pivot point are needed to trigger a new (or add-on) technical buy signal. Faces some resistance due to overhead supply up to the $115 level. Fundamentals remain strong.
>>> FEATURED STOCK ARTICLE : Recently Sputtering Below 50-Day Moving Average - 7/9/2019 |
View all notes |
Set NEW NOTE alert |
Company Profile |
SEC
News |
Chart |
Request a new note
C
A
S
I |
EPAM
-
NYSE
Epam Systems Inc
COMPUTER SOFTWARE and SERVICES - Information Technology Service
|
$193.90
|
+1.03
0.53% |
$196.22
|
188,263
35.72% of 50 DAV
50 DAV is 527,000
|
$198.69
-2.41%
|
5/9/2019
|
$169.25
|
PP = $180.55
|
|
MB = $189.58
|
Most Recent Note - 7/18/2019 4:02:16 PM
G - Pulled back from its 52-week high today after getting very extended from any sound base. Prior highs in the $179-180 area define initial support to watch above its 50 DMA line ($175.63).
>>> FEATURED STOCK ARTICLE : Winning Streak Leaves IT Firm Extended From Prior Base - 7/12/2019 |
View all notes |
Set NEW NOTE alert |
Company Profile |
SEC
News |
Chart |
Request a new note
C
A
S
I |
AUDC
-
NASDAQ
Audiocodes Ltd
ELECTRONICS - Scientific and Technical Instrum
|
$16.45
|
+0.45
2.81% |
$16.48
|
133,171
102.44% of 50 DAV
50 DAV is 130,000
|
$17.44
-5.68%
|
7/15/2019
|
$17.10
|
PP = $17.54
|
|
MB = $18.42
|
Most Recent Note - 7/22/2019 2:09:52 PM
Y - Due to report earnings news. Pulled back last week yet halted its slide after testing its 50 DMA line ($15.38) which defines important near-term support to watch. Subsequent gains above the pivot point backed by at least +40% above average volume are needed to trigger a proper technical buy signal.
>>> FEATURED STOCK ARTICLE : Posted a Gain With Average Volume for Best Ever Close - 7/15/2019 |
View all notes |
Set NEW NOTE alert |
Company Profile |
SEC
News |
Chart |
Request a new note
C
A
S
I |
ENV
-
NYSE
Envestnet Inc
FINANCIAL SERVICES - Diversified Investments
|
$71.37
|
-0.54
-0.75% |
$72.43
|
401,164
152.53% of 50 DAV
50 DAV is 263,000
|
$73.23
-2.54%
|
3/15/2019
|
$66.05
|
PP = $64.90
|
|
MB = $68.15
|
Most Recent Note - 7/22/2019 5:36:30 PM
G - Pulled back today with higher volume, encountering distributional pressure after wedging up to its 52-week high with volume totals near average. Its 50 DMA ($69.05) line defines support above prior lows in the $65-66 area. Recently reported earnings +5% on +1% sales revenues for the Mar '19 quarter, below the +25% minimum earnings guideline (C criteria).
>>> FEATURED STOCK ARTICLE : Rebounded Above 50-Day Moving Average Line - 7/2/2019 |
View all notes |
Set NEW NOTE alert |
Company Profile |
SEC
News |
Chart |
Request a new note
C
A
S
I |
Symbol/Exchange
Company Name
Industry Group |
PRICE |
CHANGE
(%Change) |
Day High |
Volume
(% DAV)
(% 50 day avg vol) |
52 Wk Hi
% From Hi |
Featured
Date |
Price
Featured |
Pivot Featured |
|
Max Buy |
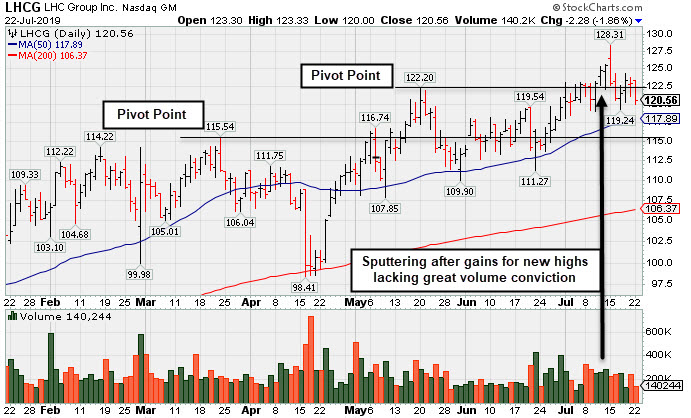
LHCG
-
NASDAQ
L H C Group Inc
HEALTH SERVICES - Home Health Care
|
$120.56
|
-2.28
-1.86% |
$123.33
|
140,244
64.33% of 50 DAV
50 DAV is 218,000
|
$128.31
-6.04%
|
7/1/2019
|
$110.94
|
PP = $122.20
|
|
MB = $128.31
|
Most Recent Note - 7/22/2019 5:29:04 PM
Y - Sputtering following a noted "negative reversal" on 7/15/19 after hitting an all-time high with gains lacking great volume conviction. Subsequent gains above its pivot point backed by at least +40% above average volume may trigger a new (or add-on) technical buy signal. Its 50 DMA line ($117.89) defines near-term support above recent lows. Fundamentals remain strong. See the latest FSU analysis for more details and a new annotated graph.
>>> FEATURED STOCK ARTICLE : Consolidating Following a Negative Reversal at High - 7/22/2019 |
View all notes |
Set NEW NOTE alert |
Company Profile |
SEC
News |
Chart |
Request a new note
C
A
S
I |
ENSG
-
NASDAQ
Ensign Group Inc
HEALTH SERVICES - Long-Term Care Facilities
|
$58.19
|
-0.59
-1.00% |
$59.34
|
170,986
59.79% of 50 DAV
50 DAV is 286,000
|
$59.42
-2.07%
|
4/30/2019
|
$51.46
|
PP = $53.30
|
|
MB = $55.97
|
Most Recent Note - 7/18/2019 3:59:10 PM
G -Quietly touched a new all-time high today. Its 50 DMA line ($55.85) and recent low ($52.34 on 5/31/19) define near-term support to watch. Bullish action has continued since 5/06/19 reporting earnings +22% on +12% sales revenues for the Mar '19 quarter, below the +25% minimum earnings guideline (C criteria).
>>> FEATURED STOCK ARTICLE : Nursing Facility Operator Touched New High - 7/1/2019 |
View all notes |
Set NEW NOTE alert |
Company Profile |
SEC
News |
Chart |
Request a new note
C
A
S
I |
CHDN
-
NASDAQ
Churchill Downs Inc
LEISURE - Gaming Activities
|
$116.46
|
+0.63
0.54% |
$116.69
|
190,723
74.50% of 50 DAV
50 DAV is 256,000
|
$118.89
-2.04%
|
7/22/2019
|
$118.45
|
PP = $118.89
|
|
MB = $124.83
|
Most Recent Note - 7/22/2019 2:17:37 PM
Y - Color code is changed to yellow after forming an advanced "3-weeks tight" base with new pivot point cited based in its 7/08/19 high plus 10 cents. Subsequent gains above the pivot point backed by at least +40% above average volume may trigger a new (or add-on) technical buy signal. Its prior low ($108.57 on 6/25/19) and 50 DMA line ($108.79) define important near-term support to watch on pullbacks.
>>> FEATURED STOCK ARTICLE : Volume Light While Hovering at Record High - 7/16/2019 |
View all notes |
Set NEW NOTE alert |
Company Profile |
SEC
News |
Chart |
Request a new note
C
A
S
I |
WWD
-
NASDAQ
Woodward Inc
MANUFACTURING - Diversified Machinery
|
$115.81
|
-0.06
-0.05% |
$117.39
|
274,915
53.90% of 50 DAV
50 DAV is 510,000
|
$118.13
-1.96%
|
6/18/2019
|
$112.34
|
PP = $114.65
|
|
MB = $120.38
|
Most Recent Note - 7/17/2019 5:37:45 PM
Y - There was a "negative reversal" today after touching a new all-time high. Found support above its 50 DMA line. Subsequent gains for new highs backed by at least +40% above average volume may clinch a convincing technical buy signal. Fundamentals remain strong.
>>> FEATURED STOCK ARTICLE : High Ranked Industrial Firm Perched Near All-Time High - 6/18/2019 |
View all notes |
Set NEW NOTE alert |
Company Profile |
SEC
News |
Chart |
Request a new note
C
A
S
I |
LULU
-
NASDAQ
Lululemon Athletica
MANUFACTURING - Textile Manufacturing
|
$187.75
|
-0.19
-0.10% |
$189.66
|
963,678
44.27% of 50 DAV
50 DAV is 2,177,000
|
$191.44
-1.93%
|
6/13/2019
|
$174.48
|
PP = $179.60
|
|
MB = $188.58
|
Most Recent Note - 7/17/2019 5:31:35 PM
G - Volume totals have been cooling while hovering near its all-time high. Its 50 DMA line ($177.14) defines important near-term support. Reported Apr '19 quarterly earnings +35% on +20% sales revenues versus the ear ago period. See the latest FSU analysis for more details and a new annotated graph.
>>> FEATURED STOCK ARTICLE : Quietly Hovering at All-Time High - 7/17/2019 |
View all notes |
Set NEW NOTE alert |
Company Profile |
SEC
News |
Chart |
Request a new note
C
A
S
I |
Symbol/Exchange
Company Name
Industry Group |
PRICE |
CHANGE
(%Change) |
Day High |
Volume
(% DAV)
(% 50 day avg vol) |
52 Wk Hi
% From Hi |
Featured
Date |
Price
Featured |
Pivot Featured |
|
Max Buy |
ULTA
-
NASDAQ
Ulta Beauty Inc
SPECIALTY RETAIL - Specialty Retail, Other
|
$352.95
|
-4.05
-1.13% |
$359.80
|
537,364
70.34% of 50 DAV
50 DAV is 764,000
|
$368.83
-4.31%
|
3/15/2019
|
$341.27
|
PP = $322.59
|
|
MB = $338.72
|
Most Recent Note - 7/22/2019 2:20:46 PM
G - Pulling back from its all-time high hit last week. Its 50 DMA line ($345) defines near-term support to watch. Reported earnings +17% on +13% sales revenues for the Apr '19 quarter, below the +25% minimum earnings guideline (C criteria), raising fundamental concerns.
>>> FEATURED STOCK ARTICLE : Stalled After Recently Wedging to New Record High - 7/5/2019 |
View all notes |
Set NEW NOTE alert |
Company Profile |
SEC
News |
Chart |
Request a new note
C
A
S
I |
CHGG
-
NYSE
Chegg Inc
Consumer Svcs-Education
|
$42.85
|
-0.48
-1.11% |
$43.36
|
1,557,987
111.52% of 50 DAV
50 DAV is 1,397,000
|
$45.19
-5.18%
|
7/8/2019
|
$44.11
|
PP = $41.79
|
|
MB = $43.88
|
Most Recent Note - 7/17/2019 5:33:54 PM
G - Pulled back near its "max buy" level with today's 2nd loss backed by average volume. Prior highs in the $40-41 area define initial support to watch on pullbacks.
>>> FEATURED STOCK ARTICLE : Tallied a Big Volume-Driven Breakout Gain for a New High - 7/8/2019 |
View all notes |
Set NEW NOTE alert |
Company Profile |
SEC
News |
Chart |
Request a new note
C
A
S
I |
ESNT
-
NYSE
Essent Group Ltd
Finance-MrtgandRel Svc
|
$46.30
|
-0.68
-1.45% |
$47.03
|
687,856
113.88% of 50 DAV
50 DAV is 604,000
|
$50.51
-8.33%
|
3/18/2019
|
$45.84
|
PP = $45.06
|
|
MB = $47.31
|
Most Recent Note - 7/17/2019 5:42:08 PM
G - Fell below its 50 DMA line ($47.86) with slightly above average volume behind today's loss. Very little resistance remains due to overhead supply. Fundamental concerns remain since it reported earnings +15% on +20% sales revenues for the Mar '19 quarter, below the +25% minimum earnings guideline (C criteria).
>>> FEATURED STOCK ARTICLE : Rebounded Above 50 Day Moving Average After Violation - 7/3/2019 |
View all notes |
Set NEW NOTE alert |
Company Profile |
SEC
News |
Chart |
Request a new note
C
A
S
I |
NOW
-
NYSE
Servicenow Inc
Computer Sftwr-Enterprse
|
$293.81
|
+4.07
1.40% |
$294.97
|
1,960,928
127.58% of 50 DAV
50 DAV is 1,537,000
|
$303.17
-3.09%
|
4/22/2019
|
$242.64
|
PP = $251.75
|
|
MB = $264.34
|
Most Recent Note - 7/22/2019 1:31:24 PM
G - Hovering near its all-time high, extended from an sound base. Its 50 DMA line ($278.54) defines near-term support to watch. Recently reported earnings +20% on +34% sales revenues for the Mar '19 quarter, below the +25% minimum earnings guideline (C criteria), raising fundamental concerns.
>>> FEATURED STOCK ARTICLE : Pulling Back After Wedging to New Highs - 6/26/2019 |
View all notes |
Set NEW NOTE alert |
Company Profile |
SEC
News |
Chart |
Request a new note
C
A
S
I |
VEEV
-
NYSE
Veeva Systems Inc Cl A
Computer Sftwr-Medical
|
$168.78
|
-0.71
-0.42% |
$170.92
|
968,596
62.86% of 50 DAV
50 DAV is 1,541,000
|
$176.90
-4.59%
|
5/30/2019
|
$154.32
|
PP = $145.80
|
|
MB = $153.09
|
Most Recent Note - 7/22/2019 1:54:12 PM
G -Quietly hovering near its all-time high with volume totals cooling, very extended from any sound base. Its 50 DMA line ($159.07) defines near-term support above the prior low ($155 on 6/27/19). Reported earnings +52% on +25% sales revenues for the Apr '19 quarter, marking its 5th strong quarter with earnings above the +25% minimum guideline (C criteria).
>>> FEATURED STOCK ARTICLE : Halted Slide After 4 Volume-Driven Losses From High - 6/27/2019 |
View all notes |
Set NEW NOTE alert |
Company Profile |
SEC
News |
Chart |
Request a new note
C
A
S
I |
Symbol/Exchange
Company Name
Industry Group |
PRICE |
CHANGE
(%Change) |
Day High |
Volume
(% DAV)
(% 50 day avg vol) |
52 Wk Hi
% From Hi |
Featured
Date |
Price
Featured |
Pivot Featured |
|
Max Buy |
PAYC
-
NYSE
Paycom Software Inc
COMPUTER SOFTWARE and SERVICES - Application Software
|
$233.93
|
+1.12
0.48% |
$236.12
|
496,246
68.83% of 50 DAV
50 DAV is 721,000
|
$246.85
-5.23%
|
2/6/2019
|
$171.66
|
PP = $164.18
|
|
MB = $172.39
|
Most Recent Note - 7/22/2019 1:34:47 PM
G - Extended from any sound base, consolidating after wedging into new high territory with recent gains lacking great volume conviction. Its 50 DMA line ($221.75) defines near-term support to watch Reported earnings +25% on +30% sales revenues for the Mar '19 quarter.
>>> FEATURED STOCK ARTICLE : Perched Near High Extended From Any Sound Base - 6/28/2019 |
View all notes |
Set NEW NOTE alert |
Company Profile |
SEC
News |
Chart |
Request a new note
C
A
S
I |
PYPL
-
NASDAQ
Paypal Holdings Inc
Finance-CrdtCard/PmtPr
|
$118.69
|
+0.06
0.05% |
$119.21
|
5,551,214
106.10% of 50 DAV
50 DAV is 5,232,000
|
$121.48
-2.30%
|
1/24/2019
|
$92.56
|
PP = $93.80
|
|
MB = $98.49
|
Most Recent Note - 7/22/2019 1:45:03 PM
G - Due to report Jun '19 quarterly earnings news. Quietly hovering near its all-time high. Did not form a sound base but wedged higher in recent weeks with gains lacking volume conviction. Earnings rose +37% on +12% sales revenues for the Mar '19 quarter, continuing its strong earnings track record.
>>> FEATURED STOCK ARTICLE : Popular Payments Firm Extended From Any Sound Base - 6/19/2019 |
View all notes |
Set NEW NOTE alert |
Company Profile |
SEC
News |
Chart |
Request a new note
C
A
S
I |
PLNT
-
NYSE
Planet Fitness Inc Cl A
Leisure-Services
|
$74.84
|
+0.67
0.90% |
$75.67
|
1,523,832
98.00% of 50 DAV
50 DAV is 1,555,000
|
$81.90
-8.62%
|
11/7/2018
|
$57.10
|
PP = $55.45
|
|
MB = $58.22
|
Most Recent Note - 7/22/2019 1:37:42 PM
G - Gains lacked volume conviction after damaging losses and it is sputtering below its 50 DMA line ($76.79). Faces near-term resistance up to the $81 level. Fundamentals remain strong.
>>> FEATURED STOCK ARTICLE : Undercut 50-Day Moving Average With Volume Behind Losses - 6/21/2019 |
View all notes |
Set NEW NOTE alert |
Company Profile |
SEC
News |
Chart |
Request a new note
C
A
S
I |
BLD
-
NYSE
Topbuild Corp
Bldg-Constr Prds/Misc
|
$79.92
|
+0.02
0.03% |
$80.86
|
210,952
66.76% of 50 DAV
50 DAV is 316,000
|
$86.96
-8.10%
|
5/17/2019
|
$82.19
|
PP = $87.31
|
|
MB = $91.68
|
Most Recent Note - 7/17/2019 5:40:59 PM
Y - Testing support defined by its 50 DMA line ($80.97) with the next support at the recent low ($75.89 on 6/19/19). Sputtering after challenging its all-time high on 7/12/19 with its early gain. Subsequent gains above the pivot point backed by at least +40% above average volume may trigger a technical buy signal. Fundamentals remain strong.
>>> FEATURED STOCK ARTICLE : Found Support at 50-Day Moving Averge Line - 6/20/2019 |
View all notes |
Set NEW NOTE alert |
Company Profile |
SEC
News |
Chart |
Request a new note
C
A
S
I |
TEAM
-
NASDAQ
Atlassian Corp Plc Cl A
Comp Sftwr-Spec Enterprs
|
$135.28
|
+1.12
0.83% |
$136.71
|
1,095,623
80.92% of 50 DAV
50 DAV is 1,354,000
|
$143.68
-5.85%
|
5/24/2019
|
$129.52
|
PP = $132.09
|
|
MB = $138.69
|
Most Recent Note - 7/22/2019 1:50:02 PM
Y - Color code is changed to yellow after pulling back below its "max buy" level. The 50 DMA line ($130.63) and prior low ($123.43 on 6/25/19) define important near-term support to watch. Due to report earnings news on 7/25/19. Volume and volatility often increase near earnings news.
>>> FEATURED STOCK ARTICLE : Perched at High After Wedging into New High Territory - 6/24/2019 |
View all notes |
Set NEW NOTE alert |
Company Profile |
SEC
News |
Chart |
Request a new note
C
A
S
I |
Symbol/Exchange
Company Name
Industry Group |
PRICE |
CHANGE
(%Change) |
Day High |
Volume
(% DAV)
(% 50 day avg vol) |
52 Wk Hi
% From Hi |
Featured
Date |
Price
Featured |
Pivot Featured |
|
Max Buy |
UPLD
-
NASDAQ
Upland Software Inc
Computer Sftwr-Enterprse
|
$46.68
|
+0.01
0.02% |
$47.70
|
202,572
36.70% of 50 DAV
50 DAV is 552,000
|
$54.87
-14.93%
|
6/10/2019
|
$53.30
|
PP = $50.74
|
|
MB = $53.28
|
Most Recent Note - 7/18/2019 3:57:54 PM
G - Quietly sputtering below its 50 DMA line ($47.33) which has been acting as resistance. A rebound above the 50 DMA line is needed for its outlook to improve. Completed a new Public Offering on 5/08/19. Quarterly comparisons through Mar '19 have shown impressive sales revenues growth and greatly improved earnings increases above the +25% minimum guideline (C criteria).
>>> FEATURED STOCK ARTICLE : Consolidating Near 50-Day Average After Slump Into Prior Base - 7/10/2019 |
View all notes |
Set NEW NOTE alert |
Company Profile |
SEC
News |
Chart |
Request a new note
C
A
S
I |
GLOB
-
NYSE
Globant SA
Computer-Tech Services
|
$105.31
|
+0.71
0.68% |
$106.95
|
315,712
72.25% of 50 DAV
50 DAV is 437,000
|
$109.78
-4.07%
|
2/15/2019
|
$69.35
|
PP = $70.00
|
|
MB = $73.50
|
Most Recent Note - 7/17/2019 5:36:02 PM
G - Pulled back for a 5h consecutive small loss on light volume, remaining perched near its all-time. Wedged higher with recent gains lacking great volume conviction, and it is very extended from any sound base. Its 50 DMA line ($95.61) defines important support to watch on pullbacks. Fundamentals remain strong.
>>> FEATURED STOCK ARTICLE : Extended From Any Sound Base After Wedging Higher - 7/11/2019 |
View all notes |
Set NEW NOTE alert |
Company Profile |
SEC
News |
Chart |
Request a new note
C
A
S
I |
TTD
-
NASDAQ
The Trade Desk Inc Cl A
Comml Svcs-Advertising
|
$249.03
|
+13.72
5.83% |
$251.86
|
1,446,637
84.30% of 50 DAV
50 DAV is 1,716,000
|
$258.00
-3.48%
|
7/18/2019
|
$240.61
|
PP = $258.10
|
|
MB = $271.01
|
Most Recent Note - 7/22/2019 2:04:04 PM
Y - Challenging prior high closes with today's big gain lacking great volume conviction. Subsequent gains above the pivot point with at least +40% above average volume may trigger a technical buy signal. Its 50 DMA line ($225.88) and prior low ($223.77 on 6/26/19) define near-term support to watch. Reported earnings +44% on +41% sales revenues for the Mar '19 quarter, continuing its strong earnings track record.
>>> FEATURED STOCK ARTICLE : Endured Distributional Pressure While Building on New Base - 7/18/2019 |
View all notes |
Set NEW NOTE alert |
Company Profile |
SEC
News |
Chart |
Request a new note
C
A
S
I |
PAGS
-
NYSE
Pagseguro Digital Cl A
Finance-CrdtCard/PmtPr
|
$47.49
|
+1.85
4.05% |
$48.43
|
2,566,800
112.98% of 50 DAV
50 DAV is 2,272,000
|
$47.25
0.51%
|
6/25/2019
|
$37.69
|
PP = $40.07
|
|
MB = $42.07
|
Most Recent Note - 7/22/2019 12:57:40 PM
G - Getting more extended from the prior base, hitting yet another new all-time high today while adding to an impressive spurt of gains. Prior high defines initial support to watch in the $40 area above its 50 DMA line ($36).
>>> FEATURED STOCK ARTICLE : Brazilian Payment Tech Firm Perched Near High - 6/25/2019 |
View all notes |
Set NEW NOTE alert |
Company Profile |
SEC
News |
Chart |
Request a new note
C
A
S
I |