You are not logged in.
This means you
CAN ONLY VIEW reports that were published prior to Thursday, March 20, 2025.
You
MUST UPGRADE YOUR MEMBERSHIP if you want to see any current reports.
AFTER MARKET UPDATE - MONDAY, JUNE 24TH, 2019
Previous After Market Report Next After Market Report >>>
|
|
|
|
DOW |
+8.41 |
26,727.54 |
+0.03% |
|
Volume |
801,724,820 |
-61% |
|
Volume |
2,033,874,460 |
-29% |
|
NASDAQ |
-26.01 |
8,005.70 |
-0.32% |
|
Advancers |
1,100 |
38% |
|
Advancers |
965 |
31% |
|
S&P 500 |
-5.11 |
2,945.35 |
-0.17% |
|
Decliners |
1,761 |
62% |
|
Decliners |
2,121 |
69% |
|
Russell 2000 |
-19.54 |
1,530.08 |
-1.26% |
|
52 Wk Highs |
146 |
|
|
52 Wk Highs |
50 |
|
|
S&P 600 |
-10.46 |
926.59 |
-1.12% |
|
52 Wk Lows |
63 |
|
|
52 Wk Lows |
79 |
|
|
 |
Major Indices Ended Mixed With LIghter Volume Totals
Kenneth J. Gruneisen - Passed the CAN SLIM® Master's Exam
Stocks finished mixed Monday as investors awaited further geopolitical updates. Attention is on the upcoming G-20 summit, where President Trump and Chinese President Xi Jinping plan to resume trade talks Friday. The S&P 500 dipped 0.2%, hovering just below its record high reached last Thursday. The Dow added 8 points, while the Nasdaq Composite was down 0.3%. U.S. equities remain on pace for their best June in decades amid the prospect of Fed rate cuts. The volume totals reported were lighter on the NYSE and on the Nasdaq exchange. Breadth was negative as decliners led advancers by a 3-2 margin on the NYSE and 2-1 on the Nasdaq exchange. There were 24 high-ranked companies from the Leaders List hit new 52-week highs and were listed on the BreakOuts Page, versus the total of 46 on the prior session. New 52-week highs outnumbered new 52-week lows on the NYSE, but new lows outnumbered new highs on the Nasdaq exchange. The major indices (M criteria) are in a "confirmed uptrend" under the fact-based system. The Featured Stocks Page provides the most timely analysis on high-ranked leaders. Charts used courtesy of www.stockcharts.com
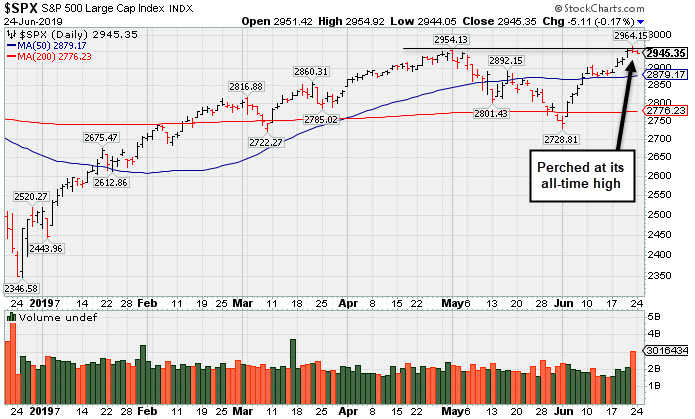
PICTURED: The S&P 500 Index is perched near its record high.
Six of 11 S&P 500 sectors finished in negative territory. Energy shares led decliners, down 0.9% on news of fresh U.S. sanctions on Iran. Materials and Technology stocks outperformed. In M&A news, Caesars Entertainment (CZR +14.51%) rose after the casino operator agreed to be acquired by Eldorado Resorts (ERI -10.64%) for $17.3 billion, including debt. Elsewhere, Bristol-Myers Squibb (BMY -7.42%) amid reports the company plans to divest its Otezla business unit and has delayed its proposed merger with Celgene (CELG -5.50%) by four to six months. In other corporate news, industrial companies United Technologies (UTX +1.11%) and Deere (DE +1.58%) both advanced on the heels of analyst upgrades.
Treasuries strengthened, with the yield on the benchmark 10-year note sliding four basis points to 2.01%. On the data front, a gauge of national economic activity from the Chicago Fed showed an improvement in May compared to the prior reading, whereas regional manufacturing data from the Dallas Fed unexpectedly weakened, falling to a three-year low. In commodities, WTI crude advanced 0.8% to $57.70/barrel, while COMEX gold rallied 1.6% to $1,418.60/ounce amid a weaker dollar.
|
 Kenneth J. Gruneisen started out as a licensed stockbroker in August 1987, a couple of months prior to the historic stock market crash that took the Dow Jones Industrial Average down -22.6% in a single day. He has published daily fact-based fundamental and technical analysis on high-ranked stocks online for two decades. Through FACTBASEDINVESTING.COM, Kenneth provides educational articles, news, market commentary, and other information regarding proven investment systems that work in good times and bad.
Comments contained in the body of this report are technical opinions only and are not necessarily those of Gruneisen Growth Corp. The material herein has been obtained from sources believed to be reliable and accurate, however, its accuracy and completeness cannot be guaranteed. Our firm, employees, and customers may effect transactions, including transactions contrary to any recommendation herein, or have positions in the securities mentioned herein or options with respect thereto. Any recommendation contained in this report may not be suitable for all investors and it is not to be deemed an offer or solicitation on our part with respect to the purchase or sale of any securities. |
|
 |
Financial, Retail, Tech, and Energy-Linked Groups Fell
Kenneth J. Gruneisen - Passed the CAN SLIM® Master's Exam
Commodity-linked groups were mixed as the Gold & Silver Index ($XAU +3.35%) ratcheted higher but the Oil Services Index ($OSX -2.11%) and the Integrated Oil Index ($XOI -0.59%) both finished lower. The Retail Index ($RLX -0.55%), Bank Index ($BKX -0.57%), and the Broker/Dealer Index ($XBD -1.44%) each lost ground. The Biotech Index ($BTK -1.82%) led the tech sector lower while Networking Index ($NWX -0.69%) also lost ground and the Semiconductor Index ($SOX +0.11%) eked out a tiny gain. Charts courtesy of www.stockcharts.com
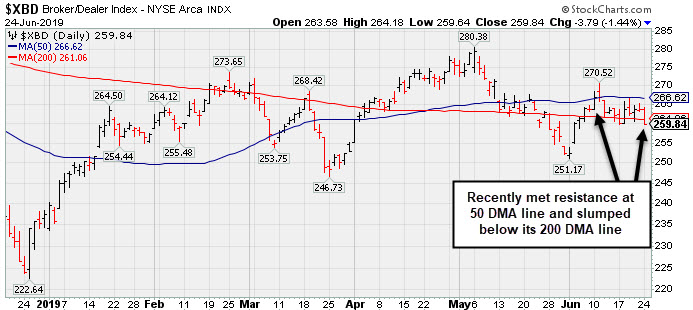 PICTURED: The Broker/Dealer Index ($XBD -1.44%) recently met resistance at its 50-day moving average (DMA) line and slumped below its 200 DMA line.
| Oil Services |
$OSX |
77.61 |
-1.67 |
-2.11% |
-3.71% |
| Integrated Oil |
$XOI |
1,257.33 |
-7.46 |
-0.59% |
+8.47% |
| Semiconductor |
$SOX |
1,412.08 |
+1.58 |
+0.11% |
+22.24% |
| Networking |
$NWX |
569.83 |
-3.97 |
-0.69% |
+16.61% |
| Broker/Dealer |
$XBD |
259.84 |
-3.79 |
-1.44% |
+9.48% |
| Retail |
$RLX |
2,369.71 |
-13.01 |
-0.55% |
+21.44% |
| Gold & Silver |
$XAU |
84.89 |
+2.75 |
+3.35% |
+20.14% |
| Bank |
$BKX |
95.43 |
-0.54 |
-0.56% |
+11.24% |
| Biotech |
$BTK |
4,673.43 |
-86.55 |
-1.82% |
+10.72% |
|
|
|
 |
Perched at High After Wedging into New High Territory
Kenneth J. Gruneisen - Passed the CAN SLIM® Master's Exam
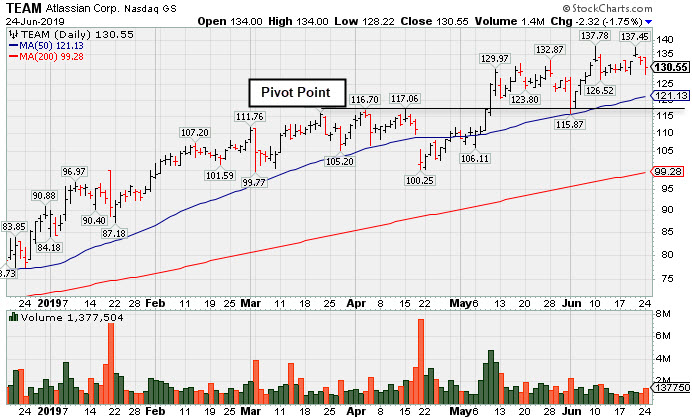
Atlassian Corp (TEAM -$2.32 or -1.75% to $130.55) pulled back again today with below average volume. In recent weeks it wedged into new high territory with gains lacking great volume conviction. The 50-day moving average (DMA) line ($121) and prior low ($115.87 on 6/03/19) define important neat-term support to watch.
Fundamentals remain strong. This Australia - based software developer recently reported earnings +133% on +38% sales revenues for the Mar '19 quarter, continuing its strong earnings track record with its 6th consecutive quarterly comparison above the +25% minimum guideline (C criteria). Its annual earnings (A criteria) history has been strong since its $21 IPO on 12/10/15.
TEAM was last shown in the FSU section on 5/24/19 with an annotated graph under the headline, "Perched Near All-Time High After "3-Weeks Tight". The number of top-rated funds owning its shares rose from 266 in Sep '17 to 527 in Mar '19, a reassuring sign concerning the I criteria. It has a Timeliness Rating of A and Sponsorship Rating of B. Its current Up/Down Volume Ratio of 1.6 is an unbiased indication its shares have been under accumulation.
|
|
|
Color Codes Explained :
Y - Better candidates highlighted by our
staff of experts.
G - Previously featured
in past reports as yellow but may no longer be buyable under the
guidelines.
***Last / Change / Volume data in this table is the closing quote data***
Symbol/Exchange
Company Name
Industry Group |
PRICE |
CHANGE
(%Change) |
Day High |
Volume
(% DAV)
(% 50 day avg vol) |
52 Wk Hi
% From Hi |
Featured
Date |
Price
Featured |
Pivot Featured |
|
Max Buy |
 SPSC
-
NASDAQ
SPSC
-
NASDAQ
S P S Commerce Inc
COMPUTER SOFTWARE and SERVICES - Application Software
|
$103.90
|
-3.73
-3.47% |
$107.85
|
117,051
79.09% of 50 DAV
50 DAV is 148,000
|
$115.00
-9.65%
|
6/7/2019
|
$107.72
|
PP = $115.10
|
|
MB = $120.86
|
 Most Recent Note - 6/24/2019 5:34:41 PM
G - Color code is changed to green after it slumped below its 50 DMA line ($104.44) with today's big loss on light volume. A rebound and subsequent volume-driven gains above the pivot point are needed to trigger a new (or add-on) technical buy signal. Faces some resistance due to overhead supply up to the $115 level. Recent lows in the $98-99 area define important near-term support to watch. Fundamentals remain strong.
>>> FEATURED STOCK ARTICLE : Base Building Now Above 50-Day Moving Average Line - 6/7/2019 |
View all notes |
Set NEW NOTE alert |
Company Profile |
SEC
News |
Chart |
Request a new note
C
A
S
I |
EPAM
-
NYSE
Epam Systems Inc
COMPUTER SOFTWARE and SERVICES - Information Technology Service
|
$171.81
|
-2.27
-1.30% |
$174.97
|
263,370
53.53% of 50 DAV
50 DAV is 492,000
|
$180.55
-4.84%
|
5/9/2019
|
$169.25
|
PP = $180.55
|
|
MB = $189.58
|
Most Recent Note - 6/21/2019 6:01:53 PM
Y - Remains perched within close striking distance of its 52-week high, consolidating quietly above its 50 DMA line ($172). Subsequent gains above the pivot point backed by at least +40% above average volume may trigger a new (or add-on) technical buy signal.
>>> FEATURED STOCK ARTICLE : Perched Near Pivot Point After a New Flat Base - 6/13/2019 |
View all notes |
Set NEW NOTE alert |
Company Profile |
SEC
News |
Chart |
Request a new note
C
A
S
I |
ENV
-
NYSE
Envestnet Inc
FINANCIAL SERVICES - Diversified Investments
|
$67.82
|
-1.41
-2.04% |
$69.32
|
274,764
96.07% of 50 DAV
50 DAV is 286,000
|
$72.67
-6.67%
|
3/15/2019
|
$66.05
|
PP = $64.90
|
|
MB = $68.15
|
Most Recent Note - 6/18/2019 6:08:28 PM
G - Reversed early gains today and violated its 50 DMA line ($68.95) ending near the session low. Recently reported earnings +5% on +1% sales revenues for the Mar '19 quarter, below the +25% minimum earnings guideline (C criteria). The prior high ($64.80 on 9/14/18) defines important near-term support to watch.
>>> FEATURED STOCK ARTICLE : Rebound Above 50-Day Moving Average Improved Technical Stance - 6/4/2019 |
View all notes |
Set NEW NOTE alert |
Company Profile |
SEC
News |
Chart |
Request a new note
C
A
S
I |
LHCG
-
NASDAQ
L H C Group Inc
HEALTH SERVICES - Home Health Care
|
$114.39
|
-0.52
-0.45% |
$115.20
|
139,603
56.52% of 50 DAV
50 DAV is 247,000
|
$122.20
-6.39%
|
4/29/2019
|
$110.94
|
PP = $115.64
|
|
MB = $121.42
|
Most Recent Note - 6/24/2019 2:55:28 PM
Y - Sputtering near its pivot point, meanwhile its 50 DMA line ($113) defines near-term support above recent lows. Fundamentals remain strong.
>>> FEATURED STOCK ARTICLE : Prior Gains Lacked Volume; 50-Day Moving Average Defines Support - 6/17/2019 |
View all notes |
Set NEW NOTE alert |
Company Profile |
SEC
News |
Chart |
Request a new note
C
A
S
I |
ENSG
-
NASDAQ
Ensign Group Inc
HEALTH SERVICES - Long-Term Care Facilities
|
$56.32
|
-0.20
-0.35% |
$57.44
|
213,372
70.65% of 50 DAV
50 DAV is 302,000
|
$58.35
-3.48%
|
4/30/2019
|
$51.46
|
PP = $53.30
|
|
MB = $55.97
|
Most Recent Note - 6/18/2019 6:17:12 PM
Y - Touched a new high today but ended the session lower following 4 consecutive gains. Its 50 DMA line ($53.10) and recent low ($52.34 on 5/31/19) define near-term support to watch. Recently reported earnings +22% on +12% sales revenues for the Mar '19 quarter, below the +25% minimum earnings guideline (C criteria), raising fundamental concerns.
>>> FEATURED STOCK ARTICLE : Resilient After Latest Quarterly Report Missed Minimum Guideline - 6/3/2019 |
View all notes |
Set NEW NOTE alert |
Company Profile |
SEC
News |
Chart |
Request a new note
C
A
S
I |
Symbol/Exchange
Company Name
Industry Group |
PRICE |
CHANGE
(%Change) |
Day High |
Volume
(% DAV)
(% 50 day avg vol) |
52 Wk Hi
% From Hi |
Featured
Date |
Price
Featured |
Pivot Featured |
|
Max Buy |
CHDN
-
NASDAQ
Churchill Downs Inc
LEISURE - Gaming Activities
|
$110.78
|
-1.47
-1.31% |
$112.29
|
230,720
69.49% of 50 DAV
50 DAV is 332,000
|
$117.14
-5.43%
|
6/5/2019
|
$108.87
|
PP = $104.96
|
|
MB = $110.21
|
Most Recent Note - 6/24/2019 2:49:59 PM
G - Retreating from its all-time high with today's 3rd consecutive loss. Prior highs in the $104 area define initial support to watch above its 50 DMA line ($101). Share price was impacted by a 3:1 split when noted on 1/28/19.
>>> FEATURED STOCK ARTICLE : Consolidating Near 50-Day Moving Average - 6/29/2018 |
View all notes |
Set NEW NOTE alert |
Company Profile |
SEC
News |
Chart |
Request a new note
C
A
S
I |
WWD
-
NASDAQ
Woodward Inc
MANUFACTURING - Diversified Machinery
|
$112.42
|
+0.18
0.16% |
$113.86
|
412,749
94.02% of 50 DAV
50 DAV is 439,000
|
$116.46
-3.47%
|
6/18/2019
|
$112.34
|
PP = $114.65
|
|
MB = $120.38
|
Most Recent Note - 6/18/2019 6:13:16 PM
Y - Color code was changed to yellow with pivot point cited based on its 4/30/19 high plus 10 cents. Perched near its all-time high, however, recent gains lacked great volume conviction. Subsequent gains above the pivot point backed by at least +40% above average volume may clinch a convincing technical buy signal. Reported earnings +71% on +38% sales revenues for the quarter ended March 31, 2019 versus the year ago period, its 5th consecutive quarterly earnings increase above the +25% minimum earnings (C criteria) guideline. Annual earnings history has been steady. See the latest FSU analysis for more details and a new annotated graph.
>>> FEATURED STOCK ARTICLE : High Ranked Industrial Firm Perched Near All-Time High - 6/18/2019 |
View all notes |
Set NEW NOTE alert |
Company Profile |
SEC
News |
Chart |
Request a new note
C
A
S
I |
LULU
-
NASDAQ
Lululemon Athletica
MANUFACTURING - Textile Manufacturing
|
$182.64
|
+0.77
0.42% |
$184.31
|
2,024,267
95.35% of 50 DAV
50 DAV is 2,123,000
|
$190.52
-4.14%
|
6/13/2019
|
$174.48
|
PP = $179.60
|
|
MB = $188.58
|
Most Recent Note - 6/24/2019 5:32:46 PM
Y - Consolidating above the prior high ($179.50 on 4/24/19) which defines initial support to watch. The 50 DMA line ($174) and prior low ($160.88 on 5/29/19) define the next important support. Reported Apr '19 quarterly earnings +35% on +20% sales revenues versus the ear ago period.
>>> FEATURED STOCK ARTICLE : Perched Near High Following Another Strong Earnings Report - 6/14/2019 |
View all notes |
Set NEW NOTE alert |
Company Profile |
SEC
News |
Chart |
Request a new note
C
A
S
I |
ULTA
-
NASDAQ
Ulta Beauty Inc
SPECIALTY RETAIL - Specialty Retail, Other
|
$346.54
|
-9.27
-2.61% |
$358.69
|
1,673,667
226.78% of 50 DAV
50 DAV is 738,000
|
$365.54
-5.20%
|
3/15/2019
|
$341.27
|
PP = $322.59
|
|
MB = $338.72
|
Most Recent Note - 6/24/2019
G - Testing its 50 DMA line ($344) while today's big loss on higher volume is indicative of distributional pressure after wedging higher with gains backed by lackluster volume as it challenged it all-time high. Reported earnings +17% on +13% sales revenues for the Apr '19 quarter, below the +25% minimum earnings guideline (C criteria), raising fundamental concerns.
>>> FEATURED STOCK ARTICLE : Sputtering Below 50-Day Moving Average Following Sub Par Earnings - 6/6/2019 |
View all notes |
Set NEW NOTE alert |
Company Profile |
SEC
News |
Chart |
Request a new note
C
A
S
I |
ESNT
-
NYSE
Essent Group Ltd
Finance-MrtgandRel Svc
|
$47.36
|
-0.15
-0.32% |
$48.07
|
549,500
88.49% of 50 DAV
50 DAV is 621,000
|
$50.51
-6.24%
|
3/18/2019
|
$45.84
|
PP = $45.06
|
|
MB = $47.31
|
Most Recent Note - 6/21/2019 6:12:18 PM
G - Pulled back for big loss today on above average volume after wedging higher this week while challenging its high. Testing its 50 DMA line ($47.41) which has acted as support in recent months. Recently reported earnings +15% on +20% sales revenues for the Mar '19 quarter, below the +25% minimum earnings guideline (C criteria), raising fundamental concerns.
>>> FEATURED STOCK ARTICLE : Still Hovering Not Far From 52-Week High - 6/5/2019 |
View all notes |
Set NEW NOTE alert |
Company Profile |
SEC
News |
Chart |
Request a new note
C
A
S
I |
Symbol/Exchange
Company Name
Industry Group |
PRICE |
CHANGE
(%Change) |
Day High |
Volume
(% DAV)
(% 50 day avg vol) |
52 Wk Hi
% From Hi |
Featured
Date |
Price
Featured |
Pivot Featured |
|
Max Buy |
NOW
-
NYSE
Servicenow Inc
Computer Sftwr-Enterprse
|
$282.50
|
-3.24
-1.13% |
$288.38
|
1,529,561
87.91% of 50 DAV
50 DAV is 1,740,000
|
$292.98
-3.58%
|
4/22/2019
|
$242.64
|
PP = $251.75
|
|
MB = $264.34
|
Most Recent Note - 6/18/2019 6:23:50 PM
G - It did not form a sound base yet hit a new all-time high with today's volume-driven gain. Its 50 DMA line ($262) and prior high ($251.65 on 3/21/19) define near-term support to watch on pullbacks. Recently reported earnings +20% on +34% sales revenues for the Mar '19 quarter, below the +25% minimum earnings guideline (C criteria), raising fundamental concerns.
>>> FEATURED STOCK ARTICLE : Leader Consolidating Above 50-Day Moving Average Line - 5/29/2019 |
View all notes |
Set NEW NOTE alert |
Company Profile |
SEC
News |
Chart |
Request a new note
C
A
S
I |
QLYS
-
NASDAQ
Qualys Inc
Computer Sftwr-Security
|
$87.85
|
+0.59
0.68% |
$88.74
|
276,292
83.90% of 50 DAV
50 DAV is 329,300
|
$98.30
-10.63%
|
5/23/2019
|
$90.43
|
PP = $98.40
|
|
MB = $103.32
|
Most Recent Note - 6/21/2019 6:14:10 PM
G - Pulled back today with higher volume while consolidating near its 50 DMA line ($86.97) after finding prompt support near its 200 DMA line. It is only -11.2% off its 52-week high, however, its Relative Strength Rating of 74 is below the 80+ minimum guideline for buy candidates. Met stubborn resistance in the $97-98 area. Reported earnings +36% on +16% sales revenues for the Mar '19 quarter, continuing its strong earnings history.
>>> FEATURED STOCK ARTICLE : Encountering Distributional Pressure in Recent Weeks - 6/11/2019 |
View all notes |
Set NEW NOTE alert |
Company Profile |
SEC
News |
Chart |
Request a new note
C
A
S
I |
VEEV
-
NYSE
Veeva Systems Inc Cl A
Computer Sftwr-Medical
|
$162.97
|
-5.96
-3.53% |
$170.07
|
2,794,599
204.43% of 50 DAV
50 DAV is 1,367,000
|
$173.65
-6.15%
|
5/30/2019
|
$154.32
|
PP = $145.80
|
|
MB = $153.09
|
Most Recent Note - 6/24/2019 2:58:17 PM
G -Abruptly retreating with today's 2nd consecutive volume-driven loss after getting very extended from any sound base. Its 50 DMA line ($147) defines near-term support. Reported earnings +52% on +25% sales revenues for the Apr '19 quarter, marking its 5th strong quarter with earnings above the +25% minimum guideline (C criteria).
>>> FEATURED STOCK ARTICLE : Big Volume-Driven Gain for New High Following Earnings News - 5/30/2019 |
View all notes |
Set NEW NOTE alert |
Company Profile |
SEC
News |
Chart |
Request a new note
C
A
S
I |
PAYC
-
NYSE
Paycom Software Inc
COMPUTER SOFTWARE and SERVICES - Application Software
|
$225.75
|
-2.50
-1.10% |
$229.97
|
577,566
75.11% of 50 DAV
50 DAV is 769,000
|
$233.43
-3.29%
|
2/6/2019
|
$171.66
|
PP = $164.18
|
|
MB = $172.39
|
Most Recent Note - 6/24/2019 3:00:44 PM
G - Extended from any sound base, it encountered distributional pressure on the prior session after quietly hitting a new all-time high. Its 50 DMA line ($207) defines near-term support to watch above the recent low ($194.84 on 6/03/19). Reported earnings +25% on +30% sales revenues for the Mar '19 quarter.
>>> FEATURED STOCK ARTICLE : Posted Volume-Driven Gain While Hovering Near All-Time High - 5/31/2019 |
View all notes |
Set NEW NOTE alert |
Company Profile |
SEC
News |
Chart |
Request a new note
C
A
S
I |
PYPL
-
NASDAQ
Paypal Holdings Inc
Finance-CrdtCard/PmtPr
|
$116.50
|
+0.29
0.25% |
$116.77
|
3,230,288
54.17% of 50 DAV
50 DAV is 5,963,000
|
$119.95
-2.88%
|
1/24/2019
|
$92.56
|
PP = $93.80
|
|
MB = $98.49
|
Most Recent Note - 6/21/2019 12:42:48 PM
G - Gapped down today retreating from a new all-time high after quiet gains. Did not form a sound base, yet promptly rebounded after violating its 50 DMA line and prior low ($106.52) on 6/03/19. Recently reported earnings +37% on +12% sales revenues for the Mar '19 quarter, continuing its strong earnings track record.
>>> FEATURED STOCK ARTICLE : Popular Payments Firm Extended From Any Sound Base - 6/19/2019 |
View all notes |
Set NEW NOTE alert |
Company Profile |
SEC
News |
Chart |
Request a new note
C
A
S
I |
Symbol/Exchange
Company Name
Industry Group |
PRICE |
CHANGE
(%Change) |
Day High |
Volume
(% DAV)
(% 50 day avg vol) |
52 Wk Hi
% From Hi |
Featured
Date |
Price
Featured |
Pivot Featured |
|
Max Buy |
PLNT
-
NYSE
Planet Fitness Inc Cl A
Leisure-Services
|
$74.31
|
-1.70
-2.24% |
$76.12
|
2,115,060
152.71% of 50 DAV
50 DAV is 1,385,000
|
$81.90
-9.27%
|
11/7/2018
|
$57.10
|
PP = $55.45
|
|
MB = $58.22
|
Most Recent Note - 6/24/2019 12:54:46 PM
G - Slumping further with today's 3rd consecutive volume-driven loss. Violated its 50 DMA line ($76.43) triggering a technical sell signal on the prior session. Early lows today undercut the prior low ($73.73 on 5/23/19) previously noted as the next important near-term support to watch. Fundamentals remain strong. See the latest FSU analysis for more details and an annotated graph.
>>> FEATURED STOCK ARTICLE : Undercut 50-Day Moving Average With Volume Behind Losses - 6/21/2019 |
View all notes |
Set NEW NOTE alert |
Company Profile |
SEC
News |
Chart |
Request a new note
C
A
S
I |
BLD
-
NYSE
Topbuild Corp
Bldg-Constr Prds/Misc
|
$78.61
|
+0.94
1.21% |
$79.99
|
283,997
84.02% of 50 DAV
50 DAV is 338,000
|
$86.96
-9.60%
|
5/17/2019
|
$82.19
|
PP = $87.31
|
|
MB = $91.68
|
Most Recent Note - 6/24/2019 2:47:52 PM
Y - Finding support at its 50 DMA line ($77.89) after recent distributional pressure. Remains within striking distance of its 52-week high. Subsequent gains above the pivot point backed by at least +40% above average volume may trigger a technical buy signal. Fundamentals remain strong.
>>> FEATURED STOCK ARTICLE : Found Support at 50-Day Moving Averge Line - 6/20/2019 |
View all notes |
Set NEW NOTE alert |
Company Profile |
SEC
News |
Chart |
Request a new note
C
A
S
I |
TEAM
-
NASDAQ
Atlassian Corp Plc Cl A
Comp Sftwr-Spec Enterprs
|
$130.55
|
-2.32
-1.75% |
$134.00
|
1,377,094
77.63% of 50 DAV
50 DAV is 1,774,000
|
$137.78
-5.25%
|
5/24/2019
|
$129.52
|
PP = $132.09
|
|
MB = $138.69
|
Most Recent Note - 6/24/2019 5:31:03 PM
Y - Pulled back for a second session with below average volume. The 50 DMA line ($121) and prior low ($115.87 on 6/03/19) define important near-term support to watch. Reported earnings +133% on +38% sales revenues for the Mar '19 quarter, continuing its strong earnings track record. See the latest FSU analysis for more details and a new annotated graph.
>>> FEATURED STOCK ARTICLE : Perched at High After Wedging into New High Territory - 6/24/2019 |
View all notes |
Set NEW NOTE alert |
Company Profile |
SEC
News |
Chart |
Request a new note
C
A
S
I |
UPLD
-
NASDAQ
Upland Software Inc
Computer Sftwr-Enterprse
|
$46.87
|
-0.92
-1.93% |
$48.79
|
469,820
87.00% of 50 DAV
50 DAV is 540,000
|
$54.87
-14.58%
|
6/10/2019
|
$53.30
|
PP = $50.74
|
|
MB = $53.28
|
Most Recent Note - 6/21/2019 6:08:35 PM
Y - Pulled back abruptly today nearly testing its 50 DMA line ($46.57) which defines near-term support to watch. Recent losses completely negated the prior breakout from an advanced ascending base. Completed a new Public Offering on 5/08/19. Quarterly comparisons through Mar '19 have shown impressive sales revenues growth and greatly improved earnings increases above the +25% minimum guideline (C criteria).
>>> FEATURED STOCK ARTICLE : Rose From an Advanced Ascending Base - 6/10/2019 |
View all notes |
Set NEW NOTE alert |
Company Profile |
SEC
News |
Chart |
Request a new note
C
A
S
I |
GLOB
-
NYSE
Globant SA
Computer-Tech Services
|
$101.70
|
-3.31
-3.15% |
$104.91
|
363,984
90.54% of 50 DAV
50 DAV is 402,000
|
$105.33
-3.45%
|
2/15/2019
|
$69.35
|
PP = $70.00
|
|
MB = $73.50
|
Most Recent Note - 6/24/2019 2:53:36 PM
G - Pulling back today following 5 consecutive gains into new high territory. Very extended from any sound base. Its 50 DMA line ($88.38) defines important support where a violation would raise concerns and trigger a technical sell signal. Fundamentals remain strong.
>>> FEATURED STOCK ARTICLE : Posted Big Gain for Another New High Close - 6/12/2019 |
View all notes |
Set NEW NOTE alert |
Company Profile |
SEC
News |
Chart |
Request a new note
C
A
S
I |
Symbol/Exchange
Company Name
Industry Group |
PRICE |
CHANGE
(%Change) |
Day High |
Volume
(% DAV)
(% 50 day avg vol) |
52 Wk Hi
% From Hi |
Featured
Date |
Price
Featured |
Pivot Featured |
|
Max Buy |
|
|
|
THESE ARE NOT BUY RECOMMENDATIONS!
Comments contained in the body of this report are technical
opinions only. The material herein has been obtained
from sources believed to be reliable and accurate, however,
its accuracy and completeness cannot be guaranteed.
This site is not an investment advisor, hence it does
not endorse or recommend any securities or other investments.
Any recommendation contained in this report may not
be suitable for all investors and it is not to be deemed
an offer or solicitation on our part with respect to
the purchase or sale of any securities. All trademarks,
service marks and trade names appearing in this report
are the property of their respective owners, and are
likewise used for identification purposes only.
This report is a service available
only to active Paid Premium Members.
You may opt-out of receiving report notifications
at any time. Questions or comments may be submitted
by writing to Premium Membership Services 665 S.E. 10 Street, Suite 201 Deerfield Beach, FL 33441-5634 or by calling 1-800-965-8307
or 954-785-1121.
|
|
|