You are not logged in.
This means you
CAN ONLY VIEW reports that were published prior to Thursday, March 20, 2025.
You
MUST UPGRADE YOUR MEMBERSHIP if you want to see any current reports.
AFTER MARKET UPDATE - TUESDAY, JUNE 25TH, 2019
Previous After Market Report Next After Market Report >>>
|
|
|
|
DOW |
-179.32 |
26,548.22 |
-0.67% |
|
Volume |
876,836,180 |
+9% |
|
Volume |
2,102,481,307 |
+3% |
|
NASDAQ |
-120.98 |
7,884.72 |
-1.51% |
|
Advancers |
954 |
34% |
|
Advancers |
1,138 |
37% |
|
S&P 500 |
-27.97 |
2,917.38 |
-0.95% |
|
Decliners |
1,886 |
66% |
|
Decliners |
1,934 |
63% |
|
Russell 2000 |
-9.05 |
1,521.04 |
-0.59% |
|
52 Wk Highs |
104 |
|
|
52 Wk Highs |
39 |
|
|
S&P 600 |
-4.40 |
922.19 |
-0.47% |
|
52 Wk Lows |
80 |
|
|
52 Wk Lows |
93 |
|
|
 |
Major Indices Fell While Market Leadership Thinned
Kenneth J. Gruneisen - Passed the CAN SLIM® Master's Exam
The S&P 500 slipped 1.0%, its third consecutive daily decline. The Dow fell 179 points, while the Nasdaq Composite was down 1.5%.The volume totals reported were higher on the NYSE and on the Nasdaq exchange, indicative of distributional activity. Breadth was negative as decliners led advancers by a 2-1 margin on the NYSE and nearly 2-1 on the Nasdaq exchange. There were 17 high-ranked companies from the Leaders List hit new 52-week highs and were listed on the BreakOuts Page, versus the total of 24 on the prior session. New 52-week highs outnumbered new 52-week lows on the NYSE, but new lows outnumbered new highs on the Nasdaq exchange. The major indices (M criteria) are in a "confirmed uptrend" under the fact-based system. The Featured Stocks Page provides the most timely analysis on high-ranked leaders. Charts used courtesy of www.stockcharts.com
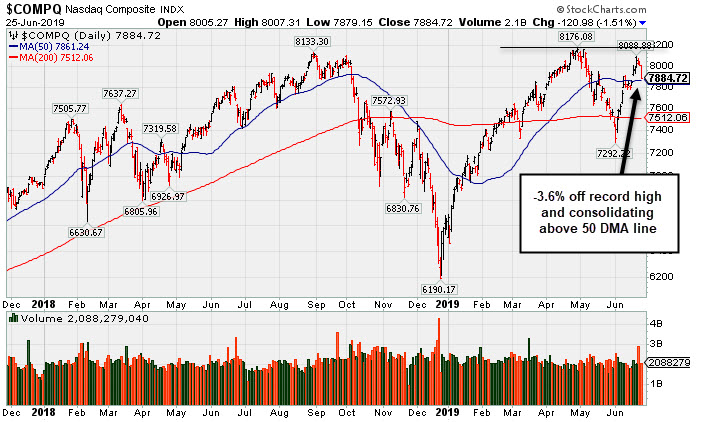
PICTURED: The Nasdaq Composite Index is perched -3.6% off its record high, consolidating above its 50-day moving average (DMA) line.
Stocks finished lower Tuesday as a spike in geopolitical tensions and less dovish comments from the Federal Reserve members weighed on investor sentiment. Trade relations also remained in focus ahead of this weekend’s G-20 summit, where President Trump and Chinese President Xi plan to resume negotiations.
Perceived safe haven assets caught a bid amid the geopolitical uncertainty between the U.S and Iran. COMEX gold pared earlier gains to finish less than 0.1% higher to $1,414.90/ounce, near its six-year high even as the U.S. dollar strengthened. On the data front, the Conference Board revealed consumer confidence in June declined to the lowest level since September 2017. Separately, a report from S&P CoreLogic Case-Shiller showed housing price gains in 20 U.S. cities slowed in April to the weakest pace since 2012. Treasuries strengthened even after St. Louis Fed President James Bullard stated a 50 basis point cut was not warranted at July’s FOMC meeting. The yield on the 10-year note dropped two basis points to 1.99%.
The Technology, Communication Services and Consumer Discretionary sectors paced the decline as the groups fell 1.8%, 1.6%, and 1.1% respectively. The oft-cited “FAANG” stocks also underperformed, slipping 2.1% amid the spike in volatility. In corporate news, AbbVie (ABBV -16.25%) fell after announcing plans to buy rival Allergan (AGN +25.36%) in a $63 billion cash and stock deal. Elsewhere, Lennar (LEN -6.21%) fell after the homebuilder lowered its earnings guidance for the upcoming quarter. In commodities, WTI crude lost 0.1% to $57.83/barrel.
|
 Kenneth J. Gruneisen started out as a licensed stockbroker in August 1987, a couple of months prior to the historic stock market crash that took the Dow Jones Industrial Average down -22.6% in a single day. He has published daily fact-based fundamental and technical analysis on high-ranked stocks online for two decades. Through FACTBASEDINVESTING.COM, Kenneth provides educational articles, news, market commentary, and other information regarding proven investment systems that work in good times and bad.
Comments contained in the body of this report are technical opinions only and are not necessarily those of Gruneisen Growth Corp. The material herein has been obtained from sources believed to be reliable and accurate, however, its accuracy and completeness cannot be guaranteed. Our firm, employees, and customers may effect transactions, including transactions contrary to any recommendation herein, or have positions in the securities mentioned herein or options with respect thereto. Any recommendation contained in this report may not be suitable for all investors and it is not to be deemed an offer or solicitation on our part with respect to the purchase or sale of any securities. |
|
 |
Retail, Techs, Financials, and Gold & Silver Index Fell
Kenneth J. Gruneisen - Passed the CAN SLIM® Master's Exam
The Gold & Silver Index ($XAU -1.33%) and the Integrated Oil Index ($XOI -0.46%) both finished lower while the Oil Services Index ($OSX +0.11%) eked out a small gain. The Retail Index ($RLX -1.26%), Bank Index ($BKX -0.30%), and the Broker/Dealer Index ($XBD -0.62%) each lost ground. The tech sector also had a negative bias as the Biotech Index ($BTK -0.57%), Networking Index ($NWX -1.09%), and the Semiconductor Index ($SOX -1.48%) suffered unanimous losses. Charts courtesy of www.stockcharts.com
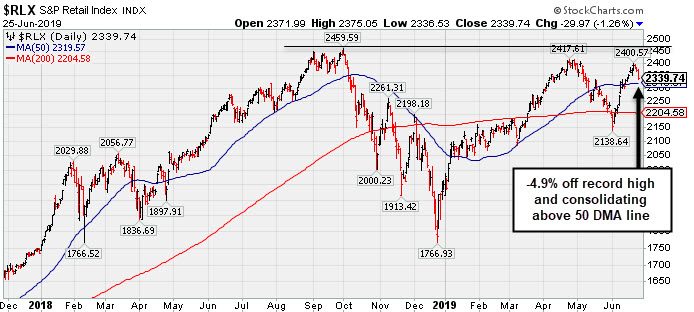 PICTURED: The Retail Index ($RLX -1.26%) is consolidating above its 50-day moving average (DMA) line and perched -4.9% off its record high.
| Oil Services |
$OSX |
77.69 |
+0.08 |
+0.10% |
-3.61% |
| Integrated Oil |
$XOI |
1,251.58 |
-5.75 |
-0.46% |
+7.98% |
| Semiconductor |
$SOX |
1,391.12 |
-20.96 |
-1.48% |
+20.43% |
| Networking |
$NWX |
563.60 |
-6.23 |
-1.09% |
+15.33% |
| Broker/Dealer |
$XBD |
258.22 |
-1.62 |
-0.62% |
+8.80% |
| Retail |
$RLX |
2,339.74 |
-29.97 |
-1.26% |
+19.90% |
| Gold & Silver |
$XAU |
83.77 |
-1.12 |
-1.32% |
+18.55% |
| Bank |
$BKX |
95.14 |
-0.29 |
-0.30% |
+10.90% |
| Biotech |
$BTK |
4,646.77 |
-26.65 |
-0.57% |
+10.09% |
|
|
|
 |
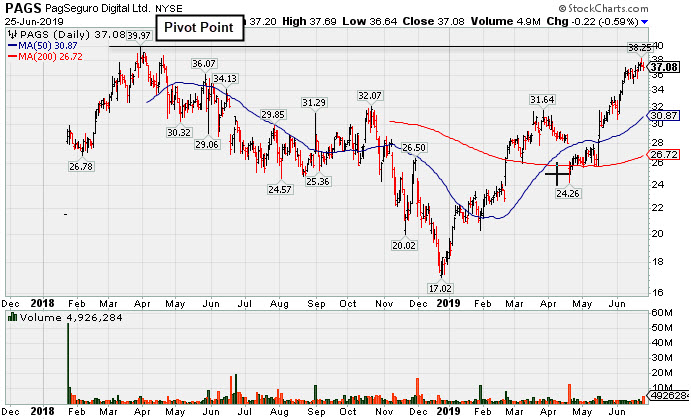
Brazilian Payment Tech Firm Perched Near High
Kenneth J. Gruneisen - Passed the CAN SLIM® Master's Exam
Pagseguro Digital Cl A (PAGS -$0.22 or -0.59% to $37.08) was highlighted in yellow with pivot point cited based on its 3/29/18 high plus 10 cents in the earlier mid-day report (read here). It faces very little resistance due to overhead supply up to the $39 level. Subsequent volume-driven gains for new highs may trigger a technical buy signal.
It has a 98 Earnings Per Share Rating. Quarterly comparisons through Mar '19 showed earnings increases above the +25% minimum guideline (C criteria), however, sequential comparisons have shown deceleration in its sales revenues and earnings growth rate. Limited history for this Brazil-based firm was also noted as a concern. It completed its $21.50 IPO on 1/24/18.
The number of top-rated funds owning its shares rose from 254 in Sep '18 to 299 in Mar '19, a reassuring sign concerning the I criteria. Its current Up/Down Volume Ratio of 1.5 is an unbiased indication its shares have been under accumulation over the past 50 days. It has earned a Timeliness Rating of A and Sposorship Rating of B.
.
Charts courtesy of www.stockcharts.com
 |
|
|
Color Codes Explained :
Y - Better candidates highlighted by our
staff of experts.
G - Previously featured
in past reports as yellow but may no longer be buyable under the
guidelines.
***Last / Change / Volume data in this table is the closing quote data***
Symbol/Exchange
Company Name
Industry Group |
PRICE |
CHANGE
(%Change) |
Day High |
Volume
(% DAV)
(% 50 day avg vol) |
52 Wk Hi
% From Hi |
Featured
Date |
Price
Featured |
Pivot Featured |
|
Max Buy |
 SPSC
-
NASDAQ
SPSC
-
NASDAQ
S P S Commerce Inc
COMPUTER SOFTWARE and SERVICES - Application Software
|
$102.46
|
-1.44
-1.39% |
$105.20
|
408,076
275.73% of 50 DAV
50 DAV is 148,000
|
$115.00
-10.90%
|
6/7/2019
|
$107.72
|
PP = $115.10
|
|
MB = $120.86
|
Most Recent Note - 6/24/2019 5:34:41 PM
G - Color code is changed to green after it slumped below its 50 DMA line ($104.44) with today's big loss on light volume. A rebound and subsequent volume-driven gains above the pivot point are needed to trigger a new (or add-on) technical buy signal. Faces some resistance due to overhead supply up to the $115 level. Recent lows in the $98-99 area define important near-term support to watch. Fundamentals remain strong.
>>> FEATURED STOCK ARTICLE : Base Building Now Above 50-Day Moving Average Line - 6/7/2019 |
View all notes |
Set NEW NOTE alert |
Company Profile |
SEC
News |
Chart |
Request a new note
C
A
S
I |
EPAM
-
NYSE
Epam Systems Inc
COMPUTER SOFTWARE and SERVICES - Information Technology Service
|
$170.49
|
-1.32
-0.77% |
$173.80
|
280,818
57.31% of 50 DAV
50 DAV is 490,000
|
$180.55
-5.57%
|
5/9/2019
|
$169.25
|
PP = $180.55
|
|
MB = $189.58
|
Most Recent Note - 6/21/2019 6:01:53 PM
Y - Remains perched within close striking distance of its 52-week high, consolidating quietly above its 50 DMA line ($172). Subsequent gains above the pivot point backed by at least +40% above average volume may trigger a new (or add-on) technical buy signal.
>>> FEATURED STOCK ARTICLE : Perched Near Pivot Point After a New Flat Base - 6/13/2019 |
View all notes |
Set NEW NOTE alert |
Company Profile |
SEC
News |
Chart |
Request a new note
C
A
S
I |
ENV
-
NYSE
Envestnet Inc
FINANCIAL SERVICES - Diversified Investments
|
$67.15
|
-0.67
-0.99% |
$68.38
|
360,874
126.62% of 50 DAV
50 DAV is 285,000
|
$72.67
-7.60%
|
3/15/2019
|
$66.05
|
PP = $64.90
|
|
MB = $68.15
|
 Most Recent Note - 6/25/2019 1:54:33 PM
G - Sputtering below its 50 DMA line ($69.10). Prior lows in the $65-66 area define the next important near-term support to watch. Recently reported earnings +5% on +1% sales revenues for the Mar '19 quarter, below the +25% minimum earnings guideline (C criteria).
>>> FEATURED STOCK ARTICLE : Rebound Above 50-Day Moving Average Improved Technical Stance - 6/4/2019 |
View all notes |
Set NEW NOTE alert |
Company Profile |
SEC
News |
Chart |
Request a new note
C
A
S
I |
LHCG
-
NASDAQ
L H C Group Inc
HEALTH SERVICES - Home Health Care
|
$116.08
|
+1.69
1.48% |
$116.84
|
248,670
101.50% of 50 DAV
50 DAV is 245,000
|
$122.20
-5.01%
|
4/29/2019
|
$110.94
|
PP = $115.64
|
|
MB = $121.42
|
Most Recent Note - 6/24/2019 2:55:28 PM
Y - Sputtering near its pivot point, meanwhile its 50 DMA line ($113) defines near-term support above recent lows. Fundamentals remain strong.
>>> FEATURED STOCK ARTICLE : Prior Gains Lacked Volume; 50-Day Moving Average Defines Support - 6/17/2019 |
View all notes |
Set NEW NOTE alert |
Company Profile |
SEC
News |
Chart |
Request a new note
C
A
S
I |
ENSG
-
NASDAQ
Ensign Group Inc
HEALTH SERVICES - Long-Term Care Facilities
|
$56.57
|
+0.25
0.44% |
$56.79
|
254,902
84.13% of 50 DAV
50 DAV is 303,000
|
$58.35
-3.05%
|
4/30/2019
|
$51.46
|
PP = $53.30
|
|
MB = $55.97
|
Most Recent Note - 6/25/2019 1:52:42 PM
G - Color code is changed to green while hovering near its all-time high, extended from the previously noted "double bottom" base. Its 50 DMA line ($53.65) and recent low ($52.34 on 5/31/19) define near-term support to watch. Recently reported earnings +22% on +12% sales revenues for the Mar '19 quarter, below the +25% minimum earnings guideline (C criteria), raising fundamental concerns.
>>> FEATURED STOCK ARTICLE : Resilient After Latest Quarterly Report Missed Minimum Guideline - 6/3/2019 |
View all notes |
Set NEW NOTE alert |
Company Profile |
SEC
News |
Chart |
Request a new note
C
A
S
I |
Symbol/Exchange
Company Name
Industry Group |
PRICE |
CHANGE
(%Change) |
Day High |
Volume
(% DAV)
(% 50 day avg vol) |
52 Wk Hi
% From Hi |
Featured
Date |
Price
Featured |
Pivot Featured |
|
Max Buy |
CHDN
-
NASDAQ
Churchill Downs Inc
LEISURE - Gaming Activities
|
$109.41
|
-1.37
-1.24% |
$111.66
|
221,706
66.38% of 50 DAV
50 DAV is 334,000
|
$117.14
-6.60%
|
6/5/2019
|
$108.87
|
PP = $104.96
|
|
MB = $110.21
|
Most Recent Note - 6/24/2019 2:49:59 PM
G - Retreating from its all-time high with today's 3rd consecutive loss. Prior highs in the $104 area define initial support to watch above its 50 DMA line ($101). Share price was impacted by a 3:1 split when noted on 1/28/19.
>>> FEATURED STOCK ARTICLE : Consolidating Near 50-Day Moving Average - 6/29/2018 |
View all notes |
Set NEW NOTE alert |
Company Profile |
SEC
News |
Chart |
Request a new note
C
A
S
I |
WWD
-
NASDAQ
Woodward Inc
MANUFACTURING - Diversified Machinery
|
$111.19
|
-1.23
-1.09% |
$114.20
|
436,918
99.07% of 50 DAV
50 DAV is 441,000
|
$116.46
-4.53%
|
6/18/2019
|
$112.34
|
PP = $114.65
|
|
MB = $120.38
|
Most Recent Note - 6/25/2019 2:02:46 PM
Y - Still perched near its all-time high, however, recent gains lacked great volume conviction and it has encountered distributional pressure. Subsequent gains above the pivot point backed by at least +40% above average volume may clinch a convincing technical buy signal. Fundamentals remain strong.
>>> FEATURED STOCK ARTICLE : High Ranked Industrial Firm Perched Near All-Time High - 6/18/2019 |
View all notes |
Set NEW NOTE alert |
Company Profile |
SEC
News |
Chart |
Request a new note
C
A
S
I |
LULU
-
NASDAQ
Lululemon Athletica
MANUFACTURING - Textile Manufacturing
|
$177.26
|
-5.38
-2.95% |
$182.89
|
2,606,787
122.04% of 50 DAV
50 DAV is 2,136,000
|
$190.52
-6.96%
|
6/13/2019
|
$174.48
|
PP = $179.60
|
|
MB = $188.58
|
Most Recent Note - 6/24/2019 5:32:46 PM
Y - Consolidating above the prior high ($179.50 on 4/24/19) which defines initial support to watch. The 50 DMA line ($174) and prior low ($160.88 on 5/29/19) define the next important support. Reported Apr '19 quarterly earnings +35% on +20% sales revenues versus the ear ago period.
>>> FEATURED STOCK ARTICLE : Perched Near High Following Another Strong Earnings Report - 6/14/2019 |
View all notes |
Set NEW NOTE alert |
Company Profile |
SEC
News |
Chart |
Request a new note
C
A
S
I |
ULTA
-
NASDAQ
Ulta Beauty Inc
SPECIALTY RETAIL - Specialty Retail, Other
|
$348.69
|
+2.15
0.62% |
$348.92
|
633,761
83.72% of 50 DAV
50 DAV is 757,000
|
$365.54
-4.61%
|
3/15/2019
|
$341.27
|
PP = $322.59
|
|
MB = $338.72
|
Most Recent Note - 6/24/2019
G - Testing its 50 DMA line ($344) while today's big loss on higher volume is indicative of distributional pressure after wedging higher with gains backed by lackluster volume as it challenged it all-time high. Reported earnings +17% on +13% sales revenues for the Apr '19 quarter, below the +25% minimum earnings guideline (C criteria), raising fundamental concerns.
>>> FEATURED STOCK ARTICLE : Sputtering Below 50-Day Moving Average Following Sub Par Earnings - 6/6/2019 |
View all notes |
Set NEW NOTE alert |
Company Profile |
SEC
News |
Chart |
Request a new note
C
A
S
I |
ESNT
-
NYSE
Essent Group Ltd
Finance-MrtgandRel Svc
|
$45.41
|
-1.95
-4.12% |
$47.36
|
1,179,489
190.55% of 50 DAV
50 DAV is 619,000
|
$50.51
-10.10%
|
3/18/2019
|
$45.84
|
PP = $45.06
|
|
MB = $47.31
|
Most Recent Note - 6/25/2019 12:27:08 PM
G - Raised concerns as it violated its 50 DMA line ($47.46) during a streak of 4 consecutive losses. Recently reported earnings +15% on +20% sales revenues for the Mar '19 quarter, below the +25% minimum earnings guideline (C criteria), raising fundamental concerns.
>>> FEATURED STOCK ARTICLE : Still Hovering Not Far From 52-Week High - 6/5/2019 |
View all notes |
Set NEW NOTE alert |
Company Profile |
SEC
News |
Chart |
Request a new note
C
A
S
I |
Symbol/Exchange
Company Name
Industry Group |
PRICE |
CHANGE
(%Change) |
Day High |
Volume
(% DAV)
(% 50 day avg vol) |
52 Wk Hi
% From Hi |
Featured
Date |
Price
Featured |
Pivot Featured |
|
Max Buy |
NOW
-
NYSE
Servicenow Inc
Computer Sftwr-Enterprse
|
$275.36
|
-7.14
-2.53% |
$283.15
|
1,584,208
90.53% of 50 DAV
50 DAV is 1,750,000
|
$292.98
-6.01%
|
4/22/2019
|
$242.64
|
PP = $251.75
|
|
MB = $264.34
|
Most Recent Note - 6/25/2019 1:59:22 PM
G - Extended from any sound base and pulling back from its all-time high with today's 3rd consecutive loss. Its 50 DMA line ($266) and prior high ($251.65 on 3/21/19) define near-term support to watch on pullbacks. Recently reported earnings +20% on +34% sales revenues for the Mar '19 quarter, below the +25% minimum earnings guideline (C criteria), raising fundamental concerns.
>>> FEATURED STOCK ARTICLE : Leader Consolidating Above 50-Day Moving Average Line - 5/29/2019 |
View all notes |
Set NEW NOTE alert |
Company Profile |
SEC
News |
Chart |
Request a new note
C
A
S
I |
QLYS
-
NASDAQ
Qualys Inc
Computer Sftwr-Security
|
$85.88
|
-1.97
-2.24% |
$88.58
|
327,398
98.73% of 50 DAV
50 DAV is 331,600
|
$98.30
-12.63%
|
5/23/2019
|
$90.43
|
PP = $98.40
|
|
MB = $103.32
|
Most Recent Note - 6/21/2019 6:14:10 PM
G - Pulled back today with higher volume while consolidating near its 50 DMA line ($86.97) after finding prompt support near its 200 DMA line. It is only -11.2% off its 52-week high, however, its Relative Strength Rating of 74 is below the 80+ minimum guideline for buy candidates. Met stubborn resistance in the $97-98 area. Reported earnings +36% on +16% sales revenues for the Mar '19 quarter, continuing its strong earnings history.
>>> FEATURED STOCK ARTICLE : Encountering Distributional Pressure in Recent Weeks - 6/11/2019 |
View all notes |
Set NEW NOTE alert |
Company Profile |
SEC
News |
Chart |
Request a new note
C
A
S
I |
VEEV
-
NYSE
Veeva Systems Inc Cl A
Computer Sftwr-Medical
|
$157.16
|
-5.81
-3.57% |
$164.95
|
3,418,297
242.60% of 50 DAV
50 DAV is 1,409,000
|
$173.65
-9.50%
|
5/30/2019
|
$154.32
|
PP = $145.80
|
|
MB = $153.09
|
Most Recent Note - 6/25/2019 1:45:08 PM
G -Abruptly retreating with today's 3rd consecutive volume-driven loss after getting very extended from any sound base. Its 50 DMA line ($147) defines near-term support. Reported earnings +52% on +25% sales revenues for the Apr '19 quarter, marking its 5th strong quarter with earnings above the +25% minimum guideline (C criteria).
>>> FEATURED STOCK ARTICLE : Big Volume-Driven Gain for New High Following Earnings News - 5/30/2019 |
View all notes |
Set NEW NOTE alert |
Company Profile |
SEC
News |
Chart |
Request a new note
C
A
S
I |
PAYC
-
NYSE
Paycom Software Inc
COMPUTER SOFTWARE and SERVICES - Application Software
|
$218.35
|
-7.40
-3.28% |
$226.61
|
788,979
101.80% of 50 DAV
50 DAV is 775,000
|
$233.43
-6.46%
|
2/6/2019
|
$171.66
|
PP = $164.18
|
|
MB = $172.39
|
Most Recent Note - 6/24/2019 3:00:44 PM
G - Extended from any sound base, it encountered distributional pressure on the prior session after quietly hitting a new all-time high. Its 50 DMA line ($207) defines near-term support to watch above the recent low ($194.84 on 6/03/19). Reported earnings +25% on +30% sales revenues for the Mar '19 quarter.
>>> FEATURED STOCK ARTICLE : Posted Volume-Driven Gain While Hovering Near All-Time High - 5/31/2019 |
View all notes |
Set NEW NOTE alert |
Company Profile |
SEC
News |
Chart |
Request a new note
C
A
S
I |
PYPL
-
NASDAQ
Paypal Holdings Inc
Finance-CrdtCard/PmtPr
|
$114.44
|
-2.06
-1.77% |
$116.96
|
5,305,752
90.30% of 50 DAV
50 DAV is 5,876,000
|
$119.95
-4.59%
|
1/24/2019
|
$92.56
|
PP = $93.80
|
|
MB = $98.49
|
Most Recent Note - 6/21/2019 12:42:48 PM
G - Gapped down today retreating from a new all-time high after quiet gains. Did not form a sound base, yet promptly rebounded after violating its 50 DMA line and prior low ($106.52) on 6/03/19. Recently reported earnings +37% on +12% sales revenues for the Mar '19 quarter, continuing its strong earnings track record.
>>> FEATURED STOCK ARTICLE : Popular Payments Firm Extended From Any Sound Base - 6/19/2019 |
View all notes |
Set NEW NOTE alert |
Company Profile |
SEC
News |
Chart |
Request a new note
C
A
S
I |
Symbol/Exchange
Company Name
Industry Group |
PRICE |
CHANGE
(%Change) |
Day High |
Volume
(% DAV)
(% 50 day avg vol) |
52 Wk Hi
% From Hi |
Featured
Date |
Price
Featured |
Pivot Featured |
|
Max Buy |
PLNT
-
NYSE
Planet Fitness Inc Cl A
Leisure-Services
|
$71.30
|
-3.01
-4.05% |
$74.51
|
3,789,977
269.37% of 50 DAV
50 DAV is 1,407,000
|
$81.90
-12.94%
|
11/7/2018
|
$57.10
|
PP = $55.45
|
|
MB = $58.22
|
Most Recent Note - 6/25/2019 1:08:07 PM
G - Today's 4th consecutive volume-driven loss is adding to a streak of damaging losses that violated its 50 DMA line ($76.43) triggering a technical sell signal. Fundamentals remain strong. A rebound above the 50 DMA line is needed for its outlook to improve.
>>> FEATURED STOCK ARTICLE : Undercut 50-Day Moving Average With Volume Behind Losses - 6/21/2019 |
View all notes |
Set NEW NOTE alert |
Company Profile |
SEC
News |
Chart |
Request a new note
C
A
S
I |
BLD
-
NYSE
Topbuild Corp
Bldg-Constr Prds/Misc
|
$78.11
|
-0.50
-0.64% |
$79.54
|
429,821
126.05% of 50 DAV
50 DAV is 341,000
|
$86.96
-10.18%
|
5/17/2019
|
$82.19
|
PP = $87.31
|
|
MB = $91.68
|
Most Recent Note - 6/24/2019 2:47:52 PM
Y - Finding support at its 50 DMA line ($77.89) after recent distributional pressure. Remains within striking distance of its 52-week high. Subsequent gains above the pivot point backed by at least +40% above average volume may trigger a technical buy signal. Fundamentals remain strong.
>>> FEATURED STOCK ARTICLE : Found Support at 50-Day Moving Averge Line - 6/20/2019 |
View all notes |
Set NEW NOTE alert |
Company Profile |
SEC
News |
Chart |
Request a new note
C
A
S
I |
TEAM
-
NASDAQ
Atlassian Corp Plc Cl A
Comp Sftwr-Spec Enterprs
|
$125.74
|
-4.81
-3.68% |
$130.91
|
1,800,735
101.34% of 50 DAV
50 DAV is 1,777,000
|
$137.78
-8.74%
|
5/24/2019
|
$129.52
|
PP = $132.09
|
|
MB = $138.69
|
Most Recent Note - 6/24/2019 5:31:03 PM
Y - Pulled back for a second session with below average volume. The 50 DMA line ($121) and prior low ($115.87 on 6/03/19) define important near-term support to watch. Reported earnings +133% on +38% sales revenues for the Mar '19 quarter, continuing its strong earnings track record. See the latest FSU analysis for more details and a new annotated graph.
>>> FEATURED STOCK ARTICLE : Perched at High After Wedging into New High Territory - 6/24/2019 |
View all notes |
Set NEW NOTE alert |
Company Profile |
SEC
News |
Chart |
Request a new note
C
A
S
I |
UPLD
-
NASDAQ
Upland Software Inc
Computer Sftwr-Enterprse
|
$44.18
|
-2.69
-5.74% |
$47.54
|
786,141
143.72% of 50 DAV
50 DAV is 547,000
|
$54.87
-19.48%
|
6/10/2019
|
$53.30
|
PP = $50.74
|
|
MB = $53.28
|
Most Recent Note - 6/25/2019 2:16:07 PM
G - Color code is changed to green after violating its 50 DMA line ($46.72) with today's 4th consecutive loss raising concerns and triggering a technical sell signal. Recent losses completely negated the prior breakout from an advanced ascending base. Completed a new Public Offering on 5/08/19. Quarterly comparisons through Mar '19 have shown impressive sales revenues growth and greatly improved earnings increases above the +25% minimum guideline (C criteria).
>>> FEATURED STOCK ARTICLE : Rose From an Advanced Ascending Base - 6/10/2019 |
View all notes |
Set NEW NOTE alert |
Company Profile |
SEC
News |
Chart |
Request a new note
C
A
S
I |
GLOB
-
NYSE
Globant SA
Computer-Tech Services
|
$101.00
|
-0.70
-0.69% |
$102.75
|
433,688
107.08% of 50 DAV
50 DAV is 405,000
|
$105.33
-4.11%
|
2/15/2019
|
$69.35
|
PP = $70.00
|
|
MB = $73.50
|
Most Recent Note - 6/24/2019 2:53:36 PM
G - Pulling back today following 5 consecutive gains into new high territory. Very extended from any sound base. Its 50 DMA line ($88.38) defines important support where a violation would raise concerns and trigger a technical sell signal. Fundamentals remain strong.
>>> FEATURED STOCK ARTICLE : Posted Big Gain for Another New High Close - 6/12/2019 |
View all notes |
Set NEW NOTE alert |
Company Profile |
SEC
News |
Chart |
Request a new note
C
A
S
I |
Symbol/Exchange
Company Name
Industry Group |
PRICE |
CHANGE
(%Change) |
Day High |
Volume
(% DAV)
(% 50 day avg vol) |
52 Wk Hi
% From Hi |
Featured
Date |
Price
Featured |
Pivot Featured |
|
Max Buy |
PAGS
-
NYSE
Pagseguro Digital Cl A
Finance-CrdtCard/PmtPr
|
$37.08
|
-0.22
-0.59% |
$37.69
|
4,920,393
217.81% of 50 DAV
50 DAV is 2,259,000
|
$38.25
-3.06%
|
6/25/2019
|
$37.69
|
PP = $40.07
|
|
MB = $42.07
|
Most Recent Note - 6/25/2019 5:39:44 PM
Y - Ended the session lower with higher volume after highlighted in yellow with pivot point cited based on its 3/29/18 high plus 10 cents. Faces very little resistance due to overhead supply up to the $39 level. Subsequent volume-driven gains for new highs may trigger a technical buy signal. Quarterly comparisons through Mar '19 showed earnings increases above the +25% minimum guideline (C criteria), however, sequential comparisons have shown deceleration in its sales revenues and earnings growth rate. Limited history for this Brazil-based firm is also a concern. Completed its $21.50 IPO on 1/24/18. See the latest FSU analysis for more details and a new annotated graph.
>>> FEATURED STOCK ARTICLE : Brazilian Payment Tech Firm Perched Near High - 6/25/2019 |
View all notes |
Set NEW NOTE alert |
Company Profile |
SEC
News |
Chart |
Request a new note
C
A
S
I |
|
|
|
THESE ARE NOT BUY RECOMMENDATIONS!
Comments contained in the body of this report are technical
opinions only. The material herein has been obtained
from sources believed to be reliable and accurate, however,
its accuracy and completeness cannot be guaranteed.
This site is not an investment advisor, hence it does
not endorse or recommend any securities or other investments.
Any recommendation contained in this report may not
be suitable for all investors and it is not to be deemed
an offer or solicitation on our part with respect to
the purchase or sale of any securities. All trademarks,
service marks and trade names appearing in this report
are the property of their respective owners, and are
likewise used for identification purposes only.
This report is a service available
only to active Paid Premium Members.
You may opt-out of receiving report notifications
at any time. Questions or comments may be submitted
by writing to Premium Membership Services 665 S.E. 10 Street, Suite 201 Deerfield Beach, FL 33441-5634 or by calling 1-800-965-8307
or 954-785-1121.
|
|
|

