You are not logged in.
This means you
CAN ONLY VIEW reports that were published prior to Monday, February 26, 2024.
You
MUST UPGRADE YOUR MEMBERSHIP if you want to see any current reports.
AFTER MARKET UPDATE - TUESDAY, JULY 16TH, 2019
Previous After Market Report Next After Market Report >>>
|
|
|
|
DOW |
-23.53 |
27,335.63 |
-0.09% |
|
Volume |
679,577,130 |
+0% |
|
Volume |
1,924,530,681 |
+9% |
|
NASDAQ |
-35.39 |
8,222.80 |
-0.43% |
|
Advancers |
1,491 |
52% |
|
Advancers |
1,387 |
46% |
|
S&P 500 |
-10.26 |
3,004.04 |
-0.34% |
|
Decliners |
1,356 |
48% |
|
Decliners |
1,656 |
54% |
|
Russell 2000 |
+0.17 |
1,562.00 |
+0.01% |
|
52 Wk Highs |
140 |
|
|
52 Wk Highs |
107 |
|
|
S&P 600 |
+1.27 |
948.23 |
+0.13% |
|
52 Wk Lows |
34 |
|
|
52 Wk Lows |
70 |
|
|
 |
Major Indices Pulled Back Slightly From Record Highs
Kenneth J. Gruneisen - Passed the CAN SLIM® Master's Exam
The Dow dropped 23 points, while the S&P 500 lost 0.3%. The Nasdaq Composite declined 0.4%. The volume totals reported were higher than the prior session totals on the NYSE and on the Nasdaq exchange. Advancers narrowly led decliners on the NYSE, meanwhile, decliners led advancers by an 8-7 margin on the Nasdaq exchange. There were 66 high-ranked companies from the Leaders List hit new 52-week highs and were listed on the BreakOuts Page, versus the total of 79 on the prior session. New 52-week highs totals contracted yet still outnumbered new 52-week lows on the NYSE and Nasdaq exchange. The major indices (M criteria) are in a "confirmed uptrend" under the fact-based system. The Featured Stocks Page provides the most timely analysis on high-ranked leaders.Charts used courtesy of www.stockcharts.com
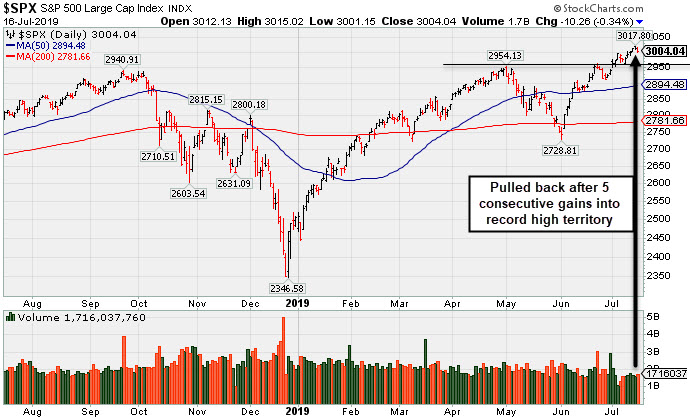
PICTURED: The S&P 500 Index pulled back after 5 consecutive gains into record high territory.
The major averages finished lower Tuesday. Stocks retreated from record highs after President Trump said China and the U.S. have a “long way to go” on the trade front. In central bank news, Federal Reserve Chair Jerome Powell said in a speech today that policymakers will “carefully monitor” downside risks to U.S. growth and “act as appropriate” to stimulate the economy. Powell’s remarks at the Bank of France echoed his recent testimony to Congress on July 10th and 11th in support for easier monetary policy at the upcoming Fed meeting.
In earnings, JP Morgan Chase & Co (JPM +1.07%) shares advanced as the bank’s 16% jump in year-over-year profit outweighed disappointing net interest income guidance. Goldman Sachs (GS +1.86%) rose after posting earnings and revenue above analyst forecasts. Elsewhere, Johnson and Johnson (JNJ -1.64%) as concerns over ongoing lawsuits offset the Health Care giant’s positive second-quarter results. In the Industrial space, J.B. Hunt Transport (JBHT +5.56%) rose as upbeat commentary from management on volume trends overshadowed an earnings miss.
On the data front, retail sales rose at a solid 0.4% in June, exceeding expectations. Separately, import prices fell 0.9% in June, the largest decline in six months, while export prices also dipped 0.7%. Tuesday’s positive economic data sent Treasuries lower with the yield on the 10-year note rising two basis points to 2.11%. In commodities, WTI crude slid 2.6% to $58.03/barrel amid Iran’s willingness to negotiate with the U.S. concerning its missile program.
|
 Kenneth J. Gruneisen started out as a licensed stockbroker in August 1987, a couple of months prior to the historic stock market crash that took the Dow Jones Industrial Average down -22.6% in a single day. He has published daily fact-based fundamental and technical analysis on high-ranked stocks online for two decades. Through FACTBASEDINVESTING.COM, Kenneth provides educational articles, news, market commentary, and other information regarding proven investment systems that work in good times and bad.
Comments contained in the body of this report are technical opinions only and are not necessarily those of Gruneisen Growth Corp. The material herein has been obtained from sources believed to be reliable and accurate, however, its accuracy and completeness cannot be guaranteed. Our firm, employees, and customers may effect transactions, including transactions contrary to any recommendation herein, or have positions in the securities mentioned herein or options with respect thereto. Any recommendation contained in this report may not be suitable for all investors and it is not to be deemed an offer or solicitation on our part with respect to the purchase or sale of any securities. |
|
 |
Energy, Tech, Retail, and Bank Indexes Fell
Kenneth J. Gruneisen - Passed the CAN SLIM® Master's Exam
The Broker/Dealer Index ($XBD +0.50%) posted a modest gain but the Bank Index ($BKX -0.65%) and Retail Index ($RLX -0.32%) both lost ground. The Biotech Index ($BTK -0.55%) and Semiconductor Index ($SOX -1.07%) both lost ground while the Networking Index ($NWX -0.05%) finished flat. The Gold & Silver Index ($XAU +0.14%) eked out a tiny gain, meanwhile energy-linked groups were again the clear laggards as the Oil Services Index ($OSX -1.40%) and the Integrated Oil Index ($XOI -0.86%) both fell.
Charts courtesy of www.stockcharts.com
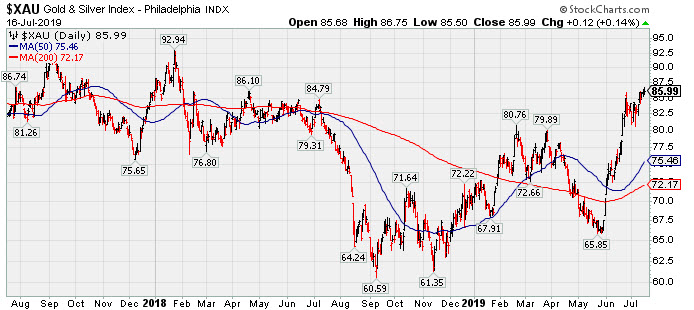 PICTURED: The Gold & Silver Index ($XAU +0.14%) is perched at its 2019 high after a choppy climb from its September 2018 low.
| Oil Services |
$OSX |
78.61 |
-1.12 |
-1.40% |
-2.47% |
| Integrated Oil |
$XOI |
1,268.93 |
-11.01 |
-0.86% |
+9.48% |
| Semiconductor |
$SOX |
1,499.64 |
-16.28 |
-1.07% |
+29.82% |
| Networking |
$NWX |
587.72 |
-0.32 |
-0.05% |
+20.27% |
| Broker/Dealer |
$XBD |
271.97 |
+1.35 |
+0.50% |
+14.59% |
| Retail |
$RLX |
2,484.31 |
-8.01 |
-0.32% |
+27.31% |
| Gold & Silver |
$XAU |
85.99 |
+0.12 |
+0.14% |
+21.70% |
| Bank |
$BKX |
97.73 |
-0.63 |
-0.64% |
+13.92% |
| Biotech |
$BTK |
4,653.60 |
-25.99 |
-0.56% |
+10.25% |
|
|
|
 |
Volume Light While Hovering at Record High
Kenneth J. Gruneisen - Passed the CAN SLIM® Master's Exam
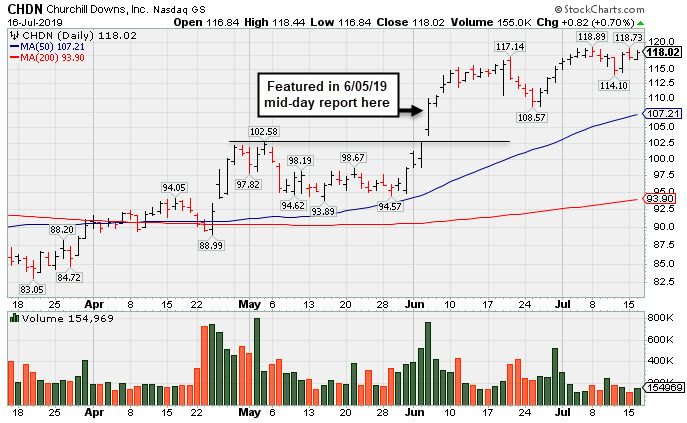
Churchill Downs Inc (CHDN +$0.82 or +0.70% to $118.02) has seen volume totals cooling while consolidating near its all-time high, extended from any sound base. Its prior low ($108.57 on 6/25/19) and 50-day moving average (DMA) line ($107.22) define important near-term support to watch on pullbacks.
Bullish action came after reported earnings +75% on +40% sales revenues for the Mar '19 quarter, its 6th consecutive quarter well above the +25% minimum earnings guideline (C criteria) versus the year ago periods. It has an earnings Per Share Rating of 99. It returned to the Featured Stocks list as it was highlighted in yellow in the 6/05/19 mid-day report (read here).
CHDN was noted and dropped off the list during a long and deep consolidation after shown in this FSU section on 5/14/18 with an annotated graph under the headline, "Breakout Followed New Supreme Court Ruling on Sports Betting". Its up and down annual earnings (A criteria) history was previously noted as a concern with regard to the strict fact-based investment system's guidelines.
The number of top-rated funds owning its shares rose from 333 in Jun '17 to 410 in Jun '18, a reassuring sign concerning the I criteria. It has a small supply of 35.4 million shares (S criteria) outstanding following a 3:1 split effective 1/28/19, and this small supply can contribute to greater price volatility in the event of institutional buying or selling.
The L criteria of the fact-based investment system guides investors toward buying leading stocks that are in leading industry groups. The Leisure - Gaming/Equipment industry group has a Group Relative Strength Rating of C+.
Prior notes are republished below -
6/17/2019 1:10:38 PM - G - Hovering near its all-time high, holding its ground stubbornly following a recent streak of 8 consecutive gains. Prior highs in the $104 area define initial support to watch on pullbacks. Share price was impacted by
6/10/2019 5:25:13 PM - G - Color code is changed to green after rallying above its "max buy" level with today's 8th consecutive gain. Prior highs in the $104 area define initial support to watch on pullbacks. Share price was impacted by a 3:1 split when last noted on 1/28/19.
6/5/2019 12:12:49 PM - Y - Color code is changed to yellow with new pivot point cited based on its 5/16/18 high plus 10 cents. Triggering a technical buy signal with today's 5th consecutive gain backed by above average volume. Share price was impacted by a 3:1 split when last noted on 1/28/19. Its Relative Strength Rating is 87, above the 80+ minimum guideline for buy candidates. Fundamentals have remained strong since dropped from the Featured Stocks list on 8/20/18.
Charts courtesy of www.stockcharts.com
|
|
|
Color Codes Explained :
Y - Better candidates highlighted by our
staff of experts.
G - Previously featured
in past reports as yellow but may no longer be buyable under the
guidelines.
***Last / Change / Volume data in this table is the closing quote data***
Symbol/Exchange
Company Name
Industry Group |
PRICE |
CHANGE
(%Change) |
Day High |
Volume
(% DAV)
(% 50 day avg vol) |
52 Wk Hi
% From Hi |
Featured
Date |
Price
Featured |
Pivot Featured |
|
Max Buy |
 SPSC
-
NASDAQ
SPSC
-
NASDAQ
S P S Commerce Inc
COMPUTER SOFTWARE and SERVICES - Application Software
|
$102.87
|
-0.92
-0.89% |
$104.71
|
96,722
69.09% of 50 DAV
50 DAV is 140,000
|
$115.00
-10.55%
|
6/7/2019
|
$107.72
|
PP = $115.10
|
|
MB = $120.86
|
Most Recent Note - 7/15/2019 4:53:59 PM
G - Meeting resistance while a rebound above its 50 DMA line ($104.11) would help its outlook. Subsequent volume-driven gains above the pivot point are needed to trigger a new (or add-on) technical buy signal. Faces some resistance due to overhead supply up to the $115 level. Fundamentals remain strong.
>>> FEATURED STOCK ARTICLE : Recently Sputtering Below 50-Day Moving Average - 7/9/2019 |
View all notes |
Set NEW NOTE alert |
Company Profile |
SEC
News |
Chart |
Request a new note
C
A
S
I |
EPAM
-
NYSE
Epam Systems Inc
COMPUTER SOFTWARE and SERVICES - Information Technology Service
|
$195.90
|
-0.12
-0.06% |
$196.98
|
498,593
94.97% of 50 DAV
50 DAV is 525,000
|
$196.06
-0.08%
|
5/9/2019
|
$169.25
|
PP = $180.55
|
|
MB = $189.58
|
Most Recent Note - 7/12/2019 5:40:35 PM
G - Extended from prior base and it hit another new 52-week high with today's 12th consecutive gain. Prior highs in the $179-180 area define initial support to watch above its 50 DMA line ($173.89). See the latest FSU analysis for more details and a new annotated graph.
>>> FEATURED STOCK ARTICLE : Winning Streak Leaves IT Firm Extended From Prior Base - 7/12/2019 |
View all notes |
Set NEW NOTE alert |
Company Profile |
SEC
News |
Chart |
Request a new note
C
A
S
I |
AUDC
-
NASDAQ
Audiocodes Ltd
ELECTRONICS - Scientific and Technical Instrum
|
$16.41
|
-0.69
-4.04% |
$16.90
|
137,293
103.23% of 50 DAV
50 DAV is 133,000
|
$17.44
-5.91%
|
7/15/2019
|
$17.10
|
PP = $17.54
|
|
MB = $18.42
|
 Most Recent Note - 7/16/2019 5:38:56 PM
Y - Pulled back today for a considerable loss. It was highlighted in yellow with new pivot point cited based on its 4/24/19 high plus 10 cents in the 7/15/19 mid-day report. Faces little resistance due to overhead supply. Recently consolidating above the 50 DMA line. It wedged higher with gains lacking great volume conviction since dropped from the Featured Stocks list on 5/13/19. Earnings rose +38% on +10% sales revenues for the Mar '19 quarter, still above the +25% minimum earnings guideline (C criteria). Subsequent gains above the pivot point backed by at least +40% above average volume are needed to trigger a proper technical buy signal. See the latest FSU analysis for more details and an annotated graph.
>>> FEATURED STOCK ARTICLE : Posted a Gain With Average Volume for Best Ever Close - 7/15/2019 |
View all notes |
Set NEW NOTE alert |
Company Profile |
SEC
News |
Chart |
Request a new note
C
A
S
I |
ENV
-
NYSE
Envestnet Inc
FINANCIAL SERVICES - Diversified Investments
|
$71.94
|
-1.16
-1.59% |
$73.21
|
228,413
82.46% of 50 DAV
50 DAV is 277,000
|
$73.23
-1.76%
|
3/15/2019
|
$66.05
|
PP = $64.90
|
|
MB = $68.15
|
Most Recent Note - 7/12/2019 5:38:05 PM
G - Hit a new 52-week high with today's 3rd consecutive gain. Prior lows in the $65-66 area define the next important near-term support to watch. Recently reported earnings +5% on +1% sales revenues for the Mar '19 quarter, below the +25% minimum earnings guideline (C criteria).
>>> FEATURED STOCK ARTICLE : Rebounded Above 50-Day Moving Average Line - 7/2/2019 |
View all notes |
Set NEW NOTE alert |
Company Profile |
SEC
News |
Chart |
Request a new note
C
A
S
I |
LHCG
-
NASDAQ
L H C Group Inc
HEALTH SERVICES - Home Health Care
|
$120.81
|
-2.10
-1.71% |
$124.31
|
244,882
110.81% of 50 DAV
50 DAV is 221,000
|
$128.31
-5.85%
|
7/1/2019
|
$110.94
|
PP = $122.20
|
|
MB = $128.31
|
Most Recent Note - 7/15/2019 12:57:06 PM
Y - Reversed into the red following early gains today for a new all-time high after wedging higher last week with gains lacking great volume conviction. Subsequent gains above its pivot point backed by at least +40% above average volume may trigger a new (or add-on) technical buy signal. Its 50 DMA line ($117) defines near-term support above recent lows. Fundamentals remain strong.
>>> FEATURED STOCK ARTICLE : Prior Gains Lacked Volume; 50-Day Moving Average Defines Support - 6/17/2019 |
View all notes |
Set NEW NOTE alert |
Company Profile |
SEC
News |
Chart |
Request a new note
C
A
S
I |
Symbol/Exchange
Company Name
Industry Group |
PRICE |
CHANGE
(%Change) |
Day High |
Volume
(% DAV)
(% 50 day avg vol) |
52 Wk Hi
% From Hi |
Featured
Date |
Price
Featured |
Pivot Featured |
|
Max Buy |
ENSG
-
NASDAQ
Ensign Group Inc
HEALTH SERVICES - Long-Term Care Facilities
|
$57.36
|
-0.03
-0.05% |
$57.86
|
124,199
41.82% of 50 DAV
50 DAV is 297,000
|
$58.88
-2.58%
|
4/30/2019
|
$51.46
|
PP = $53.30
|
|
MB = $55.97
|
Most Recent Note - 7/12/2019 12:16:52 PM
G - Volume totals have been cooling while stubbornly holding its ground near its all-time high. Its 50 DMA line ($55.33) and recent low ($52.34 on 5/31/19) define near-term support to watch. Bullish action has continued since 5/06/19 reporting earnings +22% on +12% sales revenues for the Mar '19 quarter, below the +25% minimum earnings guideline (C criteria).
>>> FEATURED STOCK ARTICLE : Nursing Facility Operator Touched New High - 7/1/2019 |
View all notes |
Set NEW NOTE alert |
Company Profile |
SEC
News |
Chart |
Request a new note
C
A
S
I |
CHDN
-
NASDAQ
Churchill Downs Inc
LEISURE - Gaming Activities
|
$118.02
|
+0.82
0.70% |
$118.44
|
154,969
57.18% of 50 DAV
50 DAV is 271,000
|
$118.89
-0.73%
|
6/5/2019
|
$108.87
|
PP = $104.96
|
|
MB = $110.21
|
Most Recent Note - 7/16/2019 5:37:33 PM
G - Volume totals have been cooling while consolidating near its all-time high, extended from any sound base. Its prior low ($108.57 on 6/25/19) and 50 DMA line ($107.22) define important near-term support to watch on pullbacks. See the latest FSU analysis for more details and a new annotated graph.
>>> FEATURED STOCK ARTICLE : Volume Light While Hovering at Record High - 7/16/2019 |
View all notes |
Set NEW NOTE alert |
Company Profile |
SEC
News |
Chart |
Request a new note
C
A
S
I |
WWD
-
NASDAQ
Woodward Inc
MANUFACTURING - Diversified Machinery
|
$116.78
|
+0.67
0.58% |
$117.37
|
278,215
54.02% of 50 DAV
50 DAV is 515,000
|
$117.73
-0.81%
|
6/18/2019
|
$112.34
|
PP = $114.65
|
|
MB = $120.38
|
Most Recent Note - 7/11/2019 5:17:28 PM
Y - Posted a quiet gain today finding support above its 50 DMA line, still perched near its all-time high. Subsequent gains for new highs backed by at least +40% above average volume may clinch a convincing technical buy signal. Fundamentals remain strong.
>>> FEATURED STOCK ARTICLE : High Ranked Industrial Firm Perched Near All-Time High - 6/18/2019 |
View all notes |
Set NEW NOTE alert |
Company Profile |
SEC
News |
Chart |
Request a new note
C
A
S
I |
LULU
-
NASDAQ
Lululemon Athletica
MANUFACTURING - Textile Manufacturing
|
$190.18
|
+1.01
0.53% |
$191.14
|
1,381,951
63.28% of 50 DAV
50 DAV is 2,184,000
|
$191.44
-0.66%
|
6/13/2019
|
$174.48
|
PP = $179.60
|
|
MB = $188.58
|
Most Recent Note - 7/12/2019 12:38:20 PM
G - Color code is changed to green while rising above its "max buy" level and quietly challenging its all-time high with its early gain. Its 50 DMA line ($176.40) which defines important support. Reported Apr '19 quarterly earnings +35% on +20% sales revenues versus the ear ago period.
>>> FEATURED STOCK ARTICLE : Perched Near High Following Another Strong Earnings Report - 6/14/2019 |
View all notes |
Set NEW NOTE alert |
Company Profile |
SEC
News |
Chart |
Request a new note
C
A
S
I |
ULTA
-
NASDAQ
Ulta Beauty Inc
SPECIALTY RETAIL - Specialty Retail, Other
|
$360.54
|
+4.86
1.37% |
$361.85
|
1,404,978
186.34% of 50 DAV
50 DAV is 754,000
|
$365.54
-1.37%
|
3/15/2019
|
$341.27
|
PP = $322.59
|
|
MB = $338.72
|
Most Recent Note - 7/16/2019 12:45:04 PM
G - Perched within striking distance of its all-time high, its 50 DMA line ($344) defines near-term support to watch. Reported earnings +17% on +13% sales revenues for the Apr '19 quarter, below the +25% minimum earnings guideline (C criteria), raising fundamental concerns.
>>> FEATURED STOCK ARTICLE : Stalled After Recently Wedging to New Record High - 7/5/2019 |
View all notes |
Set NEW NOTE alert |
Company Profile |
SEC
News |
Chart |
Request a new note
C
A
S
I |
Symbol/Exchange
Company Name
Industry Group |
PRICE |
CHANGE
(%Change) |
Day High |
Volume
(% DAV)
(% 50 day avg vol) |
52 Wk Hi
% From Hi |
Featured
Date |
Price
Featured |
Pivot Featured |
|
Max Buy |
CHGG
-
NYSE
Chegg Inc
Consumer Svcs-Education
|
$44.72
|
-0.26
-0.58% |
$45.19
|
1,514,779
105.05% of 50 DAV
50 DAV is 1,442,000
|
$44.98
-0.58%
|
7/8/2019
|
$44.11
|
PP = $41.79
|
|
MB = $43.88
|
Most Recent Note - 7/11/2019 5:05:44 PM
G - Hit a new 52-week high and its color code is changed to green after rallying above its "max buy" level with above average volume behind today's 11th consecutive gain. Triggered a technical buy signal with a volume-driven gain when highlighted in the 7/08/19 mid-day report. Prior highs in the $40-41 area define initial support to watch on pullbacks.
>>> FEATURED STOCK ARTICLE : Tallied a Big Volume-Driven Breakout Gain for a New High - 7/8/2019 |
View all notes |
Set NEW NOTE alert |
Company Profile |
SEC
News |
Chart |
Request a new note
C
A
S
I |
ESNT
-
NYSE
Essent Group Ltd
Finance-MrtgandRel Svc
|
$47.97
|
+0.04
0.08% |
$48.47
|
584,027
94.20% of 50 DAV
50 DAV is 620,000
|
$50.51
-5.03%
|
3/18/2019
|
$45.84
|
PP = $45.06
|
|
MB = $47.31
|
Most Recent Note - 7/15/2019 4:58:51 PM
G - Fell to its 50 DMA line ($47.90) with today's big loss. Very little resistance remains due to overhead supply. Fundamental concerns remain since it reported earnings +15% on +20% sales revenues for the Mar '19 quarter, below the +25% minimum earnings guideline (C criteria).
>>> FEATURED STOCK ARTICLE : Rebounded Above 50 Day Moving Average After Violation - 7/3/2019 |
View all notes |
Set NEW NOTE alert |
Company Profile |
SEC
News |
Chart |
Request a new note
C
A
S
I |
NOW
-
NYSE
Servicenow Inc
Computer Sftwr-Enterprse
|
$295.50
|
-5.60
-1.86% |
$301.30
|
1,159,922
74.31% of 50 DAV
50 DAV is 1,561,000
|
$303.17
-2.53%
|
4/22/2019
|
$242.64
|
PP = $251.75
|
|
MB = $264.34
|
Most Recent Note - 7/15/2019 4:46:09 PM
G - Volume totals have been cooling while stubbornly holding its ground perched near its all-time high, extended from an sound base. Its 50 DMA line ($276) defines near-term support to watch. Recently reported earnings +20% on +34% sales revenues for the Mar '19 quarter, below the +25% minimum earnings guideline (C criteria), raising fundamental concerns.
>>> FEATURED STOCK ARTICLE : Pulling Back After Wedging to New Highs - 6/26/2019 |
View all notes |
Set NEW NOTE alert |
Company Profile |
SEC
News |
Chart |
Request a new note
C
A
S
I |
VEEV
-
NYSE
Veeva Systems Inc Cl A
Computer Sftwr-Medical
|
$171.04
|
-3.29
-1.89% |
$176.90
|
1,166,850
76.51% of 50 DAV
50 DAV is 1,525,000
|
$176.64
-3.17%
|
5/30/2019
|
$154.32
|
PP = $145.80
|
|
MB = $153.09
|
Most Recent Note - 7/15/2019 4:57:37 PM
G -Stubbornly holding its ground near its all-time high with volume totals cooling, very extended from any sound base. Its 50 DMA line ($156.12) defines near-term support above the prior low ($155 on 6/27/19). Reported earnings +52% on +25% sales revenues for the Apr '19 quarter, marking its 5th strong quarter with earnings above the +25% minimum guideline (C criteria).
>>> FEATURED STOCK ARTICLE : Halted Slide After 4 Volume-Driven Losses From High - 6/27/2019 |
View all notes |
Set NEW NOTE alert |
Company Profile |
SEC
News |
Chart |
Request a new note
C
A
S
I |
PAYC
-
NYSE
Paycom Software Inc
COMPUTER SOFTWARE and SERVICES - Application Software
|
$239.97
|
-3.41
-1.40% |
$244.84
|
552,697
74.59% of 50 DAV
50 DAV is 741,000
|
$246.85
-2.79%
|
2/6/2019
|
$171.66
|
PP = $164.18
|
|
MB = $172.39
|
Most Recent Note - 7/15/2019 4:49:29 PM
G - Holding its ground with volume totals cooling while extended from any sound base. Wedged into new high territory with recent gains lacking great volume conviction. Its 50 DMA line ($218.49) defines near-term support to watch Reported earnings +25% on +30% sales revenues for the Mar '19 quarter.
>>> FEATURED STOCK ARTICLE : Perched Near High Extended From Any Sound Base - 6/28/2019 |
View all notes |
Set NEW NOTE alert |
Company Profile |
SEC
News |
Chart |
Request a new note
C
A
S
I |
Symbol/Exchange
Company Name
Industry Group |
PRICE |
CHANGE
(%Change) |
Day High |
Volume
(% DAV)
(% 50 day avg vol) |
52 Wk Hi
% From Hi |
Featured
Date |
Price
Featured |
Pivot Featured |
|
Max Buy |
PYPL
-
NASDAQ
Paypal Holdings Inc
Finance-CrdtCard/PmtPr
|
$119.71
|
-1.19
-0.98% |
$121.48
|
3,961,729
75.23% of 50 DAV
50 DAV is 5,266,000
|
$121.04
-1.10%
|
1/24/2019
|
$92.56
|
PP = $93.80
|
|
MB = $98.49
|
Most Recent Note - 7/15/2019 4:52:33 PM
G - It quietly touched another new all-time high today. Did not form a sound base, yet promptly rebounded after violating its 50 DMA line and prior low ($106.52) on 6/03/19. Recently reported earnings +37% on +12% sales revenues for the Mar '19 quarter, continuing its strong earnings track record.
>>> FEATURED STOCK ARTICLE : Popular Payments Firm Extended From Any Sound Base - 6/19/2019 |
View all notes |
Set NEW NOTE alert |
Company Profile |
SEC
News |
Chart |
Request a new note
C
A
S
I |
PLNT
-
NYSE
Planet Fitness Inc Cl A
Leisure-Services
|
$77.54
|
+0.35
0.45% |
$78.32
|
795,842
47.54% of 50 DAV
50 DAV is 1,674,000
|
$81.90
-5.32%
|
11/7/2018
|
$57.10
|
PP = $55.45
|
|
MB = $58.22
|
Most Recent Note - 7/15/2019 4:51:28 PM
G - Quietly consolidating near its 50 DMA line ($76.69). Faces near-term resistance up to the $81 level after encountering distributional pressure in recent weeks. Fundamentals remain strong.
>>> FEATURED STOCK ARTICLE : Undercut 50-Day Moving Average With Volume Behind Losses - 6/21/2019 |
View all notes |
Set NEW NOTE alert |
Company Profile |
SEC
News |
Chart |
Request a new note
C
A
S
I |
BLD
-
NYSE
Topbuild Corp
Bldg-Constr Prds/Misc
|
$82.83
|
+0.02
0.02% |
$84.00
|
157,818
47.82% of 50 DAV
50 DAV is 330,000
|
$86.96
-4.75%
|
5/17/2019
|
$82.19
|
PP = $87.31
|
|
MB = $91.68
|
Most Recent Note - 7/12/2019 5:43:58 PM
Y - Challenged its 52-week high all-time highs with today's early gain. Near-term support is defined by its 50 DMA line ($80.45) and recent lows. Subsequent gains above the pivot point backed by at least +40% above average volume may trigger a technical buy signal. Fundamentals remain strong.
>>> FEATURED STOCK ARTICLE : Found Support at 50-Day Moving Averge Line - 6/20/2019 |
View all notes |
Set NEW NOTE alert |
Company Profile |
SEC
News |
Chart |
Request a new note
C
A
S
I |
TEAM
-
NASDAQ
Atlassian Corp Plc Cl A
Comp Sftwr-Spec Enterprs
|
$137.16
|
-2.35
-1.68% |
$140.00
|
931,049
65.47% of 50 DAV
50 DAV is 1,422,000
|
$143.68
-4.54%
|
5/24/2019
|
$129.52
|
PP = $132.09
|
|
MB = $138.69
|
Most Recent Note - 7/15/2019 4:55:19 PM
G - Perched slightly above its "max buy" level and near its all-time high. The 50 DMA line ($128.51) and prior low ($123.43 on 6/25/19) define important near-term support to watch. Reported earnings +133% on +38% sales revenues for the Mar '19 quarter, continuing its strong earnings track record.
>>> FEATURED STOCK ARTICLE : Perched at High After Wedging into New High Territory - 6/24/2019 |
View all notes |
Set NEW NOTE alert |
Company Profile |
SEC
News |
Chart |
Request a new note
C
A
S
I |
UPLD
-
NASDAQ
Upland Software Inc
Computer Sftwr-Enterprse
|
$47.06
|
+0.35
0.75% |
$47.39
|
267,180
45.75% of 50 DAV
50 DAV is 584,000
|
$54.87
-14.23%
|
6/10/2019
|
$53.30
|
PP = $50.74
|
|
MB = $53.28
|
Most Recent Note - 7/12/2019 5:42:15 PM
G - Slumped for a 3rd consecutive loss today with light volume and its 50 DMA line ($47.27) has been acting as resistance. A rebound above the 50 DMA line is needed for its outlook to improve. Completed a new Public Offering on 5/08/19. Quarterly comparisons through Mar '19 have shown impressive sales revenues growth and greatly improved earnings increases above the +25% minimum guideline (C criteria).
>>> FEATURED STOCK ARTICLE : Consolidating Near 50-Day Average After Slump Into Prior Base - 7/10/2019 |
View all notes |
Set NEW NOTE alert |
Company Profile |
SEC
News |
Chart |
Request a new note
C
A
S
I |
Symbol/Exchange
Company Name
Industry Group |
PRICE |
CHANGE
(%Change) |
Day High |
Volume
(% DAV)
(% 50 day avg vol) |
52 Wk Hi
% From Hi |
Featured
Date |
Price
Featured |
Pivot Featured |
|
Max Buy |
GLOB
-
NYSE
Globant SA
Computer-Tech Services
|
$106.96
|
-0.69
-0.64% |
$109.06
|
265,565
60.49% of 50 DAV
50 DAV is 439,000
|
$109.78
-2.57%
|
2/15/2019
|
$69.35
|
PP = $70.00
|
|
MB = $73.50
|
Most Recent Note - 7/11/2019 5:11:41 PM
G - Perched at its all-time after wedging higher with recent gains lacking great volume conviction, very extended from any sound base. Its 50 DMA line ($93.69) defines important support to watch on pullbacks. Fundamentals remain strong.
>>> FEATURED STOCK ARTICLE : Extended From Any Sound Base After Wedging Higher - 7/11/2019 |
View all notes |
Set NEW NOTE alert |
Company Profile |
SEC
News |
Chart |
Request a new note
C
A
S
I |
PAGS
-
NYSE
Pagseguro Digital Cl A
Finance-CrdtCard/PmtPr
|
$44.74
|
+0.77
1.75% |
$44.80
|
1,449,942
66.85% of 50 DAV
50 DAV is 2,169,000
|
$45.66
-2.01%
|
6/25/2019
|
$37.69
|
PP = $40.07
|
|
MB = $42.07
|
Most Recent Note - 7/15/2019 4:48:08 PM
G - Extended from the prior base after rallying further above its "max buy" level, hitting yet another new high with today's gain. Prior high defines initial support to watch in the $40 area above its 50 DMA line ($34.52).
>>> FEATURED STOCK ARTICLE : Brazilian Payment Tech Firm Perched Near High - 6/25/2019 |
View all notes |
Set NEW NOTE alert |
Company Profile |
SEC
News |
Chart |
Request a new note
C
A
S
I |
|
|
|
THESE ARE NOT BUY RECOMMENDATIONS!
Comments contained in the body of this report are technical
opinions only. The material herein has been obtained
from sources believed to be reliable and accurate, however,
its accuracy and completeness cannot be guaranteed.
This site is not an investment advisor, hence it does
not endorse or recommend any securities or other investments.
Any recommendation contained in this report may not
be suitable for all investors and it is not to be deemed
an offer or solicitation on our part with respect to
the purchase or sale of any securities. All trademarks,
service marks and trade names appearing in this report
are the property of their respective owners, and are
likewise used for identification purposes only.
This report is a service available
only to active Paid Premium Members.
You may opt-out of receiving report notifications
at any time. Questions or comments may be submitted
by writing to Premium Membership Services 665 S.E. 10 Street, Suite 201 Deerfield Beach, FL 33441-5634 or by calling 1-800-965-8307
or 954-785-1121.
|
|
|

