You are not logged in.
This means you
CAN ONLY VIEW reports that were published prior to Thursday, April 17, 2025.
You
MUST UPGRADE YOUR MEMBERSHIP if you want to see any current reports.
AFTER MARKET UPDATE - FRIDAY, JUNE 14TH, 2019
Previous After Market Report Next After Market Report >>>
|
|
|
|
DOW |
-17.16 |
26,089.61 |
-0.07% |
|
Volume |
733,011,930 |
+3% |
|
Volume |
1,783,839,948 |
-3% |
|
NASDAQ |
-40.47 |
7,796.66 |
-0.52% |
|
Advancers |
1,165 |
41% |
|
Advancers |
1,124 |
37% |
|
S&P 500 |
-4.66 |
2,886.98 |
-0.16% |
|
Decliners |
1,703 |
59% |
|
Decliners |
1,946 |
63% |
|
Russell 2000 |
-13.30 |
1,522.50 |
-0.87% |
|
52 Wk Highs |
139 |
|
|
52 Wk Highs |
62 |
|
|
S&P 600 |
-8.65 |
923.57 |
-0.93% |
|
52 Wk Lows |
74 |
|
|
52 Wk Lows |
84 |
|
|
 |
Major Indices Ended Session Lower With Less Leadership
Kenneth J. Gruneisen - Passed the CAN SLIM® Master's Exam
For the week, the S&P 500 advanced 0.5%, while the Dow rose 0.4%. The Nasdaq notched a weekly gain of 0.7%.Stocks finished lower Friday, still notching a second consecutive week of gains. The Dow fell 17 points, while the S&P slipped 0.2%. The Nasdaq Composite was down 0.5%. The volume totals reported were mixed, higher on the NYSE and lighter on the Nasdaq exchange. Breadth was negative as decliners led advancers by a 3-2 margin on the NYSE and 9-5 on the Nasdaq exchange. There were 25 high-ranked companies from the Leaders List hit new 52-week highs and were listed on the BreakOuts Page, versus the total of 34 on the prior session. New 52-week highs outnumbered new 52-week lows on the NYSE but new low outnumbered new highs on the Nasdaq exchange. The major indices (M criteria) are in a "confirmed uptrend" under the fact-based system. The Featured Stocks Page provides the most timely analysis on high-ranked leaders. Charts used courtesy of www.stockcharts.com
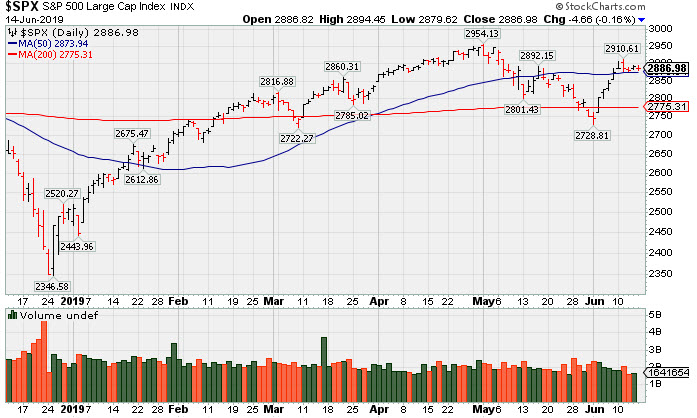
PICTURED: The S&P 500 Index is perched -2.3% off its record high and recently rebounded above its 50-day moving average (DMA) line helping its technical stance.
Economic and corporate updates were in focus, while investors continued to await further trade and monetary policy developments. Technology shares led decliners Friday, dragged down by semiconductor shares. Broadcom (AVGO -5.6%) fell after the chipmaker missed revenue forecasts and slashed its forward guidance by 8%, citing the ongoing trade dispute between the U.S. and China.
Treasuries were little changed following mostly positive economic updates, with the yield on the benchmark 10-year note steady at 2.08%. A report showed retail sales increased 0.5% in May, while April’s figure was upwardly revised to reflect a 0.3% gain. A separate release revealed manufacturing output advanced for the first time this year. A preliminary reading from the University of Michigan showed consumer sentiment is cooling slightly in June.
In commodities, WTI crude climbed 0.5% to $52.53/barrel, paring its weekly decline to 2.7% as a backdrop of global demand concerns outweighed escalating tensions in the Middle East. COMEX gold added 0.1% to $1340.10/ounce after nearing the highest level in 14 months earlier in the session. |
 Kenneth J. Gruneisen started out as a licensed stockbroker in August 1987, a couple of months prior to the historic stock market crash that took the Dow Jones Industrial Average down -22.6% in a single day. He has published daily fact-based fundamental and technical analysis on high-ranked stocks online for two decades. Through FACTBASEDINVESTING.COM, Kenneth provides educational articles, news, market commentary, and other information regarding proven investment systems that work in good times and bad.
Comments contained in the body of this report are technical opinions only and are not necessarily those of Gruneisen Growth Corp. The material herein has been obtained from sources believed to be reliable and accurate, however, its accuracy and completeness cannot be guaranteed. Our firm, employees, and customers may effect transactions, including transactions contrary to any recommendation herein, or have positions in the securities mentioned herein or options with respect thereto. Any recommendation contained in this report may not be suitable for all investors and it is not to be deemed an offer or solicitation on our part with respect to the purchase or sale of any securities. |
|
 |
Retail and Bank Indexes Eked Out Small Gains
Kenneth J. Gruneisen - Passed the CAN SLIM® Master's Exam
The Retail Index ($RLX +0.26%) and Bank Index ($BKX +0.38%) rose, but the Broker/Dealer Index ($XBD -0.48%) ended lower. The tech sector had a negative bias as the Semiconductor Index ($SOX -2.61%), Biotech Index ($BTK -1.47%), and the Networking Index ($NWX -1.77%) suffered unanimous losses. The Gold & Silver Index ($XAU -0.23%) and Integrated Oil Index ($XOI -0.57%) both edged lower while the Oil Services Index ($OSX -3.71%) was a standout decliner. Charts courtesy of www.stockcharts.com
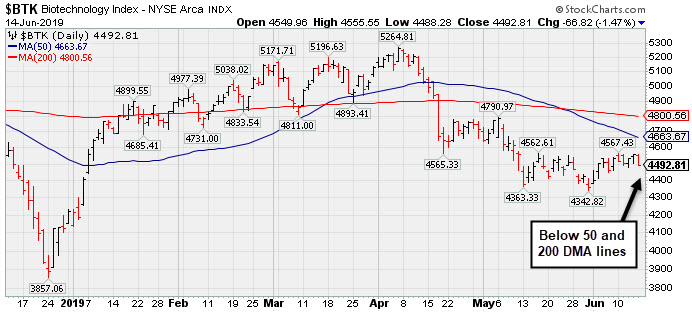 PICTURED: The Biotech Index ($BTK -1.47%) has been sputtering below its 50-day and 200-day moving average (DMA) lines since mid-April.
| Oil Services |
$OSX |
71.99 |
-2.77 |
-3.71% |
-10.68% |
| Integrated Oil |
$XOI |
1,204.92 |
-6.89 |
-0.57% |
+3.95% |
| Semiconductor |
$SOX |
1,356.55 |
-36.39 |
-2.61% |
+17.43% |
| Networking |
$NWX |
560.70 |
-10.08 |
-1.77% |
+14.74% |
| Broker/Dealer |
$XBD |
262.23 |
-1.26 |
-0.48% |
+10.49% |
| Retail |
$RLX |
2,337.51 |
+6.03 |
+0.26% |
+19.79% |
| Gold & Silver |
$XAU |
75.81 |
-0.18 |
-0.24% |
+7.29% |
| Bank |
$BKX |
96.29 |
+0.37 |
+0.39% |
+12.24% |
| Biotech |
$BTK |
4,492.81 |
-66.82 |
-1.47% |
+6.44% |
|
|
|
 |
Perched Near High Following Another Strong Earnings Report
Kenneth J. Gruneisen - Passed the CAN SLIM® Master's Exam
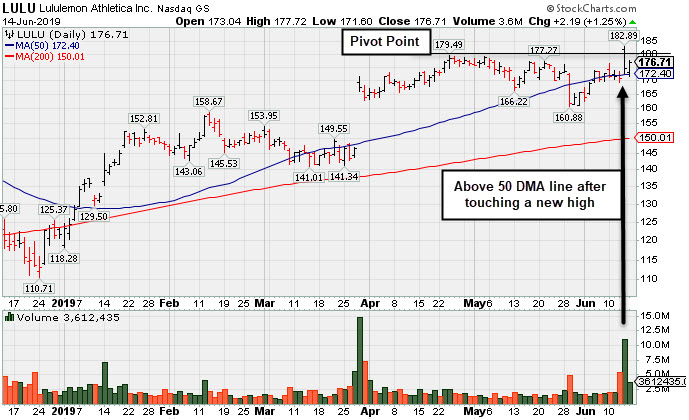
Lululemon Athletica (LULU +$2.19 or +1.25% to $176.71) is trading above its 50-day moving average (DMA) line ($172.36) after spiking to a new high on the prior session. Its color code was changed to yellow with new pivot point cited based on its 4/24/19 high plus 10 cents. A gain and strong close above the pivot point backed by at least +40% above average volume may trigger a new (or add-on) technical buy signal. The recent low ($160.88 on 5/29/19) defines important support near prior highs.
It reported Apr '19 quarterly earnings +35% on +20% sales revenues versus the ear ago period, marking its 6th consecutive quarterly comparison above the +25% minimum guideline (C criteria). Recent quarterly comparisons showed stronger sales revenues and earnings improvement helping it match with the fact-based investment system's fundamental guidelines. It has a new CEO as of 8/20/18. It currently has a 94 Earnings Per Share Rating. Its Timeliness rating is A and Sponsorship rating is C. Its last appearance in this FSU section was on 5/10/19 with an annotated graph under the headline, "Volume Light While Hovering Near High". It was highlighted in yellow with pivot point cited based on its 10/01/18 high plus 10 cents in the 3/28/19 mid-day report (read here). The number of top-rated funds owning its shares rose from 1,041 in Jun '18 to 1,346 in Mar '19, a good sign concerning the I criteria. LULU was first featured in yellow at $23.83 (split adjusted after 2:1 split effective 7/21/11) in the October 8, 2010 mid-day report (read here) and it traded up as much as +163.7% in a little more than 9 months. As previously noted - "In a bullish market, many high-ranked leaders offer multiple opportunities to accumulate their shares under the fact-based system's strict guidelines. Patience may often allow another ideal base or secondary buy point to possibly develop and be noted." Charts courtesy of www.stockcharts.com
|
|
|
Color Codes Explained :
Y - Better candidates highlighted by our
staff of experts.
G - Previously featured
in past reports as yellow but may no longer be buyable under the
guidelines.
***Last / Change / Volume data in this table is the closing quote data***
Symbol/Exchange
Company Name
Industry Group |
PRICE |
CHANGE
(%Change) |
Day High |
Volume
(% DAV)
(% 50 day avg vol) |
52 Wk Hi
% From Hi |
Featured
Date |
Price
Featured |
Pivot Featured |
|
Max Buy |
 SPSC
-
NASDAQ
SPSC
-
NASDAQ
S P S Commerce Inc
COMPUTER SOFTWARE and SERVICES - Application Software
|
$105.06
|
-1.70
-1.59% |
$107.24
|
78,498
50.32% of 50 DAV
50 DAV is 156,000
|
$115.00
-8.64%
|
6/7/2019
|
$107.72
|
PP = $115.10
|
|
MB = $120.86
|
 Most Recent Note - 6/14/2019 10:09:51 AM
Y - Consolidating above its 50 DMA line ($104). Subsequent volume-driven gains above the pivot point are needed to trigger a new (or add-on) technical buy signal. Faces some resistance due to overhead supply up to the $115 level. Recent lows in the $98-99 area define important near-term support to watch. Fundamentals remain strong.
>>> FEATURED STOCK ARTICLE : Base Building Now Above 50-Day Moving Average Line - 6/7/2019 |
View all notes |
Set NEW NOTE alert |
Company Profile |
SEC
News |
Chart |
Request a new note
C
A
S
I |
EPAM
-
NYSE
Epam Systems Inc
COMPUTER SOFTWARE and SERVICES - Information Technology Service
|
$174.50
|
-2.20
-1.25% |
$176.64
|
263,588
52.30% of 50 DAV
50 DAV is 504,000
|
$180.55
-3.35%
|
5/9/2019
|
$169.25
|
PP = $180.55
|
|
MB = $189.58
|
Most Recent Note - 6/14/2019 9:56:59 AM
Y - Perched within close striking distance of its 52-week high. Subsequent gains above the pivot point backed by at least +40% above average volume may trigger a new (or add-on) technical buy signal. Rebound above its 50 DMA line ($172) helped its outlook to improve. Fundamentals remain strong. See the latest FSU analysis for more details and a new annotated graph.
>>> FEATURED STOCK ARTICLE : Perched Near Pivot Point After a New Flat Base - 6/13/2019 |
View all notes |
Set NEW NOTE alert |
Company Profile |
SEC
News |
Chart |
Request a new note
C
A
S
I |
ENV
-
NYSE
Envestnet Inc
FINANCIAL SERVICES - Diversified Investments
|
$69.20
|
+0.33
0.48% |
$69.38
|
150,736
51.10% of 50 DAV
50 DAV is 295,000
|
$72.67
-4.78%
|
3/15/2019
|
$66.05
|
PP = $64.90
|
|
MB = $68.15
|
Most Recent Note - 6/12/2019 12:05:41 PM
G - Violated its 50 DMA line ($68.72) on the prior session with a damaging volume-driven loss raising concerns. Recently reported earnings +5% on +1% sales revenues for the Mar '19 quarter, below the +25% minimum earnings guideline (C criteria). The prior high ($64.80 on 9/14/18) defines important near-term support to watch.
>>> FEATURED STOCK ARTICLE : Rebound Above 50-Day Moving Average Improved Technical Stance - 6/4/2019 |
View all notes |
Set NEW NOTE alert |
Company Profile |
SEC
News |
Chart |
Request a new note
C
A
S
I |
LHCG
-
NASDAQ
L H C Group Inc
HEALTH SERVICES - Home Health Care
|
$114.64
|
-1.86
-1.60% |
$117.08
|
168,953
68.68% of 50 DAV
50 DAV is 246,000
|
$122.20
-6.19%
|
4/29/2019
|
$110.94
|
PP = $115.64
|
|
MB = $121.42
|
Most Recent Note - 6/10/2019 5:21:09 PM
Y - Rebounded further above its pivot point with today's gain backed by lighter than average volume. Its 50 DMA line ($111) defines near-term support. Fundamentals remain strong.
>>> FEATURED STOCK ARTICLE : Long-Term Care Firm Hovering Near All-Time High - 5/14/2019 |
View all notes |
Set NEW NOTE alert |
Company Profile |
SEC
News |
Chart |
Request a new note
C
A
S
I |
ENSG
-
NASDAQ
Ensign Group Inc
HEALTH SERVICES - Long-Term Care Facilities
|
$56.61
|
+0.95
1.71% |
$56.72
|
189,058
63.66% of 50 DAV
50 DAV is 297,000
|
$58.14
-2.63%
|
4/30/2019
|
$51.46
|
PP = $53.30
|
|
MB = $55.97
|
Most Recent Note - 6/14/2019 10:04:07 AM
Y - Showed resilience while consolidating above its 50 DMA line ($52.89) and recent lows which define near-term support to watch. Recently reported earnings +22% on +12% sales revenues for the Mar '19 quarter, below the +25% minimum earnings guideline (C criteria), raising fundamental concerns.
>>> FEATURED STOCK ARTICLE : Resilient After Latest Quarterly Report Missed Minimum Guideline - 6/3/2019 |
View all notes |
Set NEW NOTE alert |
Company Profile |
SEC
News |
Chart |
Request a new note
C
A
S
I |
Symbol/Exchange
Company Name
Industry Group |
PRICE |
CHANGE
(%Change) |
Day High |
Volume
(% DAV)
(% 50 day avg vol) |
52 Wk Hi
% From Hi |
Featured
Date |
Price
Featured |
Pivot Featured |
|
Max Buy |
CHDN
-
NASDAQ
Churchill Downs Inc
LEISURE - Gaming Activities
|
$114.51
|
+0.49
0.43% |
$115.17
|
142,018
43.83% of 50 DAV
50 DAV is 324,000
|
$115.64
-0.98%
|
6/5/2019
|
$108.87
|
PP = $104.96
|
|
MB = $110.21
|
Most Recent Note - 6/10/2019 5:25:13 PM
G - Color code is changed to green after rallying above its "max buy" level with today's 8th consecutive gain. Prior highs in the $104 area define initial support to watch on pullbacks. Share price was impacted by a 3:1 split when last noted on 1/28/19.
>>> FEATURED STOCK ARTICLE : Consolidating Near 50-Day Moving Average - 6/29/2018 |
View all notes |
Set NEW NOTE alert |
Company Profile |
SEC
News |
Chart |
Request a new note
C
A
S
I |
LULU
-
NASDAQ
Lululemon Athletica
MANUFACTURING - Textile Manufacturing
|
$176.71
|
+2.19
1.25% |
$177.72
|
3,582,623
179.22% of 50 DAV
50 DAV is 1,999,000
|
$182.89
-3.38%
|
6/13/2019
|
$174.48
|
PP = $179.60
|
|
MB = $188.58
|
Most Recent Note - 6/14/2019 5:21:29 PM
Y - Trading above its 50 DMA line ($172.40), it spiked to a new high on Thursday but finished near the session low. Color code was changed to yellow with new pivot point cited based on its 4/24/19 high plus 10 cents. A gain and strong close above the pivot point backed by at least +40% above average volume may trigger a new (or add-on) technical buy signal. Reported Apr '19 quarterly earnings +35% on +20% sales revenues versus the ear ago period. Recent low ($160.88 on 5/29/19) defines important support near prior highs. See the latest FSU analysis for more details and a new annotated graph.
>>> FEATURED STOCK ARTICLE : Perched Near High Following Another Strong Earnings Report - 6/14/2019 |
View all notes |
Set NEW NOTE alert |
Company Profile |
SEC
News |
Chart |
Request a new note
C
A
S
I |
ULTA
-
NASDAQ
Ulta Beauty Inc
SPECIALTY RETAIL - Specialty Retail, Other
|
$354.62
|
+4.81
1.38% |
$355.61
|
898,952
125.73% of 50 DAV
50 DAV is 715,000
|
$359.69
-1.41%
|
3/15/2019
|
$341.27
|
PP = $322.59
|
|
MB = $338.72
|
Most Recent Note - 6/13/2019 5:17:48 PM
G - Posted a 3rd consecutive gain today with average volume as it rebounded above its 50 DMA line ($344) helping its outlook to improve. Rebounded from a deep early loss on 5/31/19 after gapping down. Reported earnings +17% on +13% sales revenues for the Apr '19 quarter, below the +25% minimum earnings guideline (C criteria), raising fundamental concerns. Faces resistance due to overhead supply up to the $359 level.
>>> FEATURED STOCK ARTICLE : Sputtering Below 50-Day Moving Average Following Sub Par Earnings - 6/6/2019 |
View all notes |
Set NEW NOTE alert |
Company Profile |
SEC
News |
Chart |
Request a new note
C
A
S
I |
ESNT
-
NYSE
Essent Group Ltd
Finance-MrtgandRel Svc
|
$48.43
|
-0.17
-0.35% |
$48.88
|
427,595
71.74% of 50 DAV
50 DAV is 596,000
|
$50.51
-4.12%
|
3/18/2019
|
$45.84
|
PP = $45.06
|
|
MB = $47.31
|
Most Recent Note - 6/10/2019 12:00:53 PM
G - Hitting a new all-time high today and its color code is changed to green after rising above its "max buy" level. Found support above its 50 DMA line ($46.79) during its consolidation in recent months. Recently reported earnings +15% on +20% sales revenues for the Mar '19 quarter, below the +25% minimum earnings guideline (C criteria), raising fundamental concerns.
>>> FEATURED STOCK ARTICLE : Still Hovering Not Far From 52-Week High - 6/5/2019 |
View all notes |
Set NEW NOTE alert |
Company Profile |
SEC
News |
Chart |
Request a new note
C
A
S
I |
NOW
-
NYSE
Servicenow Inc
Computer Sftwr-Enterprse
|
$272.25
|
-1.54
-0.56% |
$275.61
|
999,908
57.24% of 50 DAV
50 DAV is 1,747,000
|
$281.74
-3.37%
|
4/22/2019
|
$242.64
|
PP = $251.75
|
|
MB = $264.34
|
Most Recent Note - 6/11/2019 5:52:38 PM
G - Pulled back abruptly today following 5 consecutive gains. Its 50 DMA line ($258.77) and prior high ($251.65 on 3/21/19) define near-term support to watch. Recently reported earnings +20% on +34% sales revenues for the Mar '19 quarter, below the +25% minimum earnings guideline (C criteria), raising fundamental concerns.
>>> FEATURED STOCK ARTICLE : Leader Consolidating Above 50-Day Moving Average Line - 5/29/2019 |
View all notes |
Set NEW NOTE alert |
Company Profile |
SEC
News |
Chart |
Request a new note
C
A
S
I |
Symbol/Exchange
Company Name
Industry Group |
PRICE |
CHANGE
(%Change) |
Day High |
Volume
(% DAV)
(% 50 day avg vol) |
52 Wk Hi
% From Hi |
Featured
Date |
Price
Featured |
Pivot Featured |
|
Max Buy |
QLYS
-
NASDAQ
Qualys Inc
Computer Sftwr-Security
|
$85.42
|
-1.72
-1.97% |
$87.11
|
279,317
88.78% of 50 DAV
50 DAV is 314,600
|
$98.30
-13.10%
|
5/23/2019
|
$90.43
|
PP = $98.40
|
|
MB = $103.32
|
Most Recent Note - 6/14/2019 10:08:21 AM
G - Consolidating above its 50 ($86.35) after finding prompt support near its 200 DMA line. Its Relative Strength Rating is 50, below the 80+ minimum guideline for buy candidates. Met stubborn resistance in the $97-98 area. Reported earnings +36% on +16% sales revenues for the Mar '19 quarter, continuing its strong earnings history.
>>> FEATURED STOCK ARTICLE : Encountering Distributional Pressure in Recent Weeks - 6/11/2019 |
View all notes |
Set NEW NOTE alert |
Company Profile |
SEC
News |
Chart |
Request a new note
C
A
S
I |
VEEV
-
NYSE
Veeva Systems Inc Cl A
Computer Sftwr-Medical
|
$164.63
|
-1.70
-1.02% |
$167.37
|
740,514
55.10% of 50 DAV
50 DAV is 1,344,000
|
$168.46
-2.27%
|
5/30/2019
|
$154.32
|
PP = $145.80
|
|
MB = $153.09
|
Most Recent Note - 6/10/2019 5:18:10 PM
G - Today's 5th consecutive gain with above average volume leaves it very extended from any sound base. Reported earnings +52% on +25% sales revenues for the Apr '19 quarter, marking its 5th strong quarter with earnings above the +25% minimum guideline (C criteria).
>>> FEATURED STOCK ARTICLE : Big Volume-Driven Gain for New High Following Earnings News - 5/30/2019 |
View all notes |
Set NEW NOTE alert |
Company Profile |
SEC
News |
Chart |
Request a new note
C
A
S
I |
PAYC
-
NYSE
Paycom Software Inc
COMPUTER SOFTWARE and SERVICES - Application Software
|
$214.34
|
-4.42
-2.02% |
$218.84
|
394,230
52.49% of 50 DAV
50 DAV is 751,000
|
$230.90
-7.17%
|
2/6/2019
|
$171.66
|
PP = $164.18
|
|
MB = $172.39
|
Most Recent Note - 6/11/2019 5:49:56 PM
G - Pulled back today following a "negative reversal" on the prior session after hitting a new all-time high. Extended from any sound base. Its 50 DMA line ($201) and recent low ($194.84 on 6/03/19) define important near-term support to watch on pullbacks. Reported earnings +25% on +30% sales revenues for the Mar '19 quarter.
>>> FEATURED STOCK ARTICLE : Posted Volume-Driven Gain While Hovering Near All-Time High - 5/31/2019 |
View all notes |
Set NEW NOTE alert |
Company Profile |
SEC
News |
Chart |
Request a new note
C
A
S
I |
PYPL
-
NASDAQ
Paypal Holdings Inc
Finance-CrdtCard/PmtPr
|
$116.17
|
+0.45
0.39% |
$116.73
|
4,198,248
68.54% of 50 DAV
50 DAV is 6,125,000
|
$117.45
-1.09%
|
1/24/2019
|
$92.56
|
PP = $93.80
|
|
MB = $98.49
|
Most Recent Note - 6/14/2019 10:06:28 AM
G - Perched near its all-time high with no resistance remaining due to overhead supply. It did not form a sound base yet promptly rebounded after violating its 50 DMA line and prior low ($106.52) on 6/03/19 triggering technical sell signals. Recently reported earnings +37% on +12% sales revenues for the Mar '19 quarter, continuing its strong earnings track record.
>>> FEATURED STOCK ARTICLE : Hovering Near All Time High Extended From Any Sound Base - 5/15/2019 |
View all notes |
Set NEW NOTE alert |
Company Profile |
SEC
News |
Chart |
Request a new note
C
A
S
I |
PLNT
-
NYSE
Planet Fitness Inc Cl A
Leisure-Services
|
$80.76
|
+1.19
1.50% |
$81.33
|
1,080,279
75.81% of 50 DAV
50 DAV is 1,425,000
|
$81.76
-1.22%
|
11/7/2018
|
$57.10
|
PP = $55.45
|
|
MB = $58.22
|
Most Recent Note - 6/12/2019 5:31:39 PM
G - Extended from any sound base. Found support above its 50 DMA line ($75.17) and prior low during the recent consolidation. Violations would raise concerns and trigger technical sell signals. Fundamentals remain strong.
>>> FEATURED STOCK ARTICLE : Pulling Back From High After Impressive Rally - 5/23/2019 |
View all notes |
Set NEW NOTE alert |
Company Profile |
SEC
News |
Chart |
Request a new note
C
A
S
I |
Symbol/Exchange
Company Name
Industry Group |
PRICE |
CHANGE
(%Change) |
Day High |
Volume
(% DAV)
(% 50 day avg vol) |
52 Wk Hi
% From Hi |
Featured
Date |
Price
Featured |
Pivot Featured |
|
Max Buy |
BLD
-
NYSE
Topbuild Corp
Bldg-Constr Prds/Misc
|
$81.14
|
-1.07
-1.30% |
$82.19
|
235,208
74.20% of 50 DAV
50 DAV is 317,000
|
$87.09
-6.83%
|
5/17/2019
|
$82.19
|
PP = $87.31
|
|
MB = $91.68
|
Most Recent Note - 6/14/2019 10:02:49 AM
Y - Perched within striking distance of its 52-week high. Subsequent gains above the pivot point backed by at least +40% above average volume may trigger a technical buy signal. Fundamentals remain strong.
>>> FEATURED STOCK ARTICLE : Encountered Distributional Pressure Near Prior High - 5/20/2019 |
View all notes |
Set NEW NOTE alert |
Company Profile |
SEC
News |
Chart |
Request a new note
C
A
S
I |
TEAM
-
NASDAQ
Atlassian Corp Plc Cl A
Comp Sftwr-Spec Enterprs
|
$129.91
|
-0.37
-0.28% |
$131.48
|
804,924
43.79% of 50 DAV
50 DAV is 1,838,000
|
$137.78
-5.71%
|
5/24/2019
|
$129.52
|
PP = $132.09
|
|
MB = $138.69
|
Most Recent Note - 6/14/2019 10:13:02 AM
Y - Perched near its all-time high. The 50 DMA line ($118.78) and prior low ($115.87 on 6/03/19) define important neat-term support to watch. Reported earnings +133% on +38% sales revenues for the Mar '19 quarter, continuing its strong earnings track record.
>>> FEATURED STOCK ARTICLE : Perched Near All-Time High After "3-Weeks Tight" - 5/24/2019 |
View all notes |
Set NEW NOTE alert |
Company Profile |
SEC
News |
Chart |
Request a new note
C
A
S
I |
UPLD
-
NASDAQ
Upland Software Inc
Computer Sftwr-Enterprse
|
$48.19
|
-0.05
-0.10% |
$48.89
|
355,031
70.58% of 50 DAV
50 DAV is 503,000
|
$54.87
-12.17%
|
6/10/2019
|
$53.30
|
PP = $50.74
|
|
MB = $53.28
|
Most Recent Note - 6/12/2019 5:30:08 PM
Y - Abruptly retreated with 2 volume-driven losses slumping back into the prior base and raising concerns. Near-term support to watch is at its 50 DMA line ($45.42). Highlighted in yellow in the 6/10/19 mid-day report with pivot point cited based on its 5/17/19 high plus 10 cents as it rose from an advanced ascending base. Completed a new Public Offering on 5/08/19. Quarterly comparisons through Mar '19 have shown impressive sales revenues growth and greatly improved earnings increases above the +25% minimum guideline (C criteria).
>>> FEATURED STOCK ARTICLE : Rose From an Advanced Ascending Base - 6/10/2019 |
View all notes |
Set NEW NOTE alert |
Company Profile |
SEC
News |
Chart |
Request a new note
C
A
S
I |
GLOB
-
NYSE
Globant SA
Computer-Tech Services
|
$99.50
|
-1.77
-1.75% |
$100.86
|
255,094
64.91% of 50 DAV
50 DAV is 393,000
|
$102.24
-2.68%
|
2/15/2019
|
$69.35
|
PP = $70.00
|
|
MB = $73.50
|
Most Recent Note - 6/12/2019 5:25:52 PM
G - Rallied for a best-ever close with today's big gain on near average volume. Very extended from any sound base. Its 50 DMA line ($84.10) defines important support where a violation would raise concerns and trigger a technical sell signal. Fundamentals remain strong. See the latest FSU analysis for more details and a new annotated graph.
>>> FEATURED STOCK ARTICLE : Posted Big Gain for Another New High Close - 6/12/2019 |
View all notes |
Set NEW NOTE alert |
Company Profile |
SEC
News |
Chart |
Request a new note
C
A
S
I |
|
|
|
THESE ARE NOT BUY RECOMMENDATIONS!
Comments contained in the body of this report are technical
opinions only. The material herein has been obtained
from sources believed to be reliable and accurate, however,
its accuracy and completeness cannot be guaranteed.
This site is not an investment advisor, hence it does
not endorse or recommend any securities or other investments.
Any recommendation contained in this report may not
be suitable for all investors and it is not to be deemed
an offer or solicitation on our part with respect to
the purchase or sale of any securities. All trademarks,
service marks and trade names appearing in this report
are the property of their respective owners, and are
likewise used for identification purposes only.
This report is a service available
only to active Paid Premium Members.
You may opt-out of receiving report notifications
at any time. Questions or comments may be submitted
by writing to Premium Membership Services 665 S.E. 10 Street, Suite 201 Deerfield Beach, FL 33441-5634 or by calling 1-800-965-8307
or 954-785-1121.
|
|
|

