You are not logged in.
This means you
CAN ONLY VIEW reports that were published prior to Tuesday, July 9, 2024.
You
MUST UPGRADE YOUR MEMBERSHIP if you want to see any current reports.
AFTER MARKET UPDATE - MONDAY, MARCH 18TH, 2024
Previous After Market Report Next After Market Report >>>
|
|
|
|
DOW |
+75.66 |
38,790.43 |
+0.20% |
|
Volume |
1,107,194,344 |
-71% |
|
Volume |
5,036,284,900 |
-41% |
|
NASDAQ |
+130.27 |
16,103.45 |
+0.82% |
|
Advancers |
1,412 |
51% |
|
Advancers |
1,912 |
44% |
|
S&P 500 |
+32.33 |
5,149.42 |
+0.63% |
|
Decliners |
1,359 |
49% |
|
Decliners |
2,410 |
56% |
|
Russell 2000 |
-14.59 |
2,024.74 |
-0.72% |
|
52 Wk Highs |
135 |
|
|
52 Wk Highs |
101 |
|
|
S&P 600 |
-5.29 |
1,282.45 |
-0.41% |
|
52 Wk Lows |
41 |
|
|
52 Wk Lows |
132 |
|
|
 |
Major Indices Rose While Small Cap Indexes Sputtered
Kenneth J. Gruneisen - Passed the CAN SLIM® Master's Exam
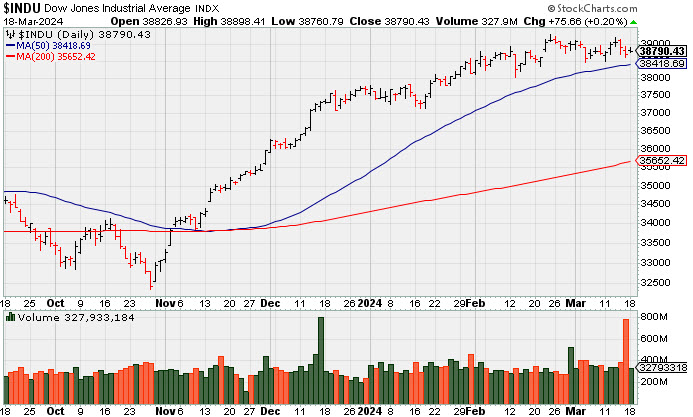
The Dow, Nasdaq, and S&P 500 each ended the session slightly higher while the the Russell 2000 (-0.7%) suffered a small loss. Volume reported was much lighter that the prior session totals on the NYSE and on the Nasdaq exchange, as Friday's totals were inflated by options expirations. Advancers led decliners by a narrow margin on the NYSE but decliners led advancers by a 6-5 margin on the Nasdaq exchange. There were 53 high-ranked companies from the Leaders List that hit new 52-week highs and were listed on the BreakOuts Page, versus the total of 41 on the prior session. New 52-week highs outnumbered the new 52-week lows on the NYSE, but for a third concecutive session new lows outnumbered new highs on the Nasdaq exchange. The major indices are in a confirmed uptrend (M criteria). New buying efforts should be only made in stocks fitting all key criteria of the fact-based investment system.
PICTURED: The Dow Jones Industrial Average is perched near its all time high.
The 2-yr note yield settled the day up one basis point at 4.73% while the 10-yr note yield settled up four basis points at 4.34%. Rising oil prices ($82.17, +1.18, +1.5%) impacted inflation expectations. A Bank of Japan policy decision is due overnight and the release of the Fed's dot plot is due on Wednesday.
The consumer staples sector (+0.8%) outperformed with help from PepsiCo (PEP +4.01%) after an upgrade. Most sectors ended the day with modest gains. The two outliers were health care and real estate, which closed with fractional losses. The communication services sector (+3.0%) had a standout gain. Alphabet (GOOG +4.44%) posted an influential gain and Apple (AAPL +0.64%) edged higher. NVIDIA (NVDA +0.70%) ended with a small gain after trading as much as 5.2% higher intra-day. Tesla (TSLA +6.25%) jumped after Elon Musk noted in an X post that the Model Y price will rise $1,000 in a few weeks. Banks were weak following an analyst downgrade of New York Community Bank (NYCB -6.92%)
|
 Kenneth J. Gruneisen started out as a licensed stockbroker in August 1987, a couple of months prior to the historic stock market crash that took the Dow Jones Industrial Average down -22.6% in a single day. He has published daily fact-based fundamental and technical analysis on high-ranked stocks online for two decades. Through FACTBASEDINVESTING.COM, Kenneth provides educational articles, news, market commentary, and other information regarding proven investment systems that work in good times and bad.
Comments contained in the body of this report are technical opinions only and are not necessarily those of Gruneisen Growth Corp. The material herein has been obtained from sources believed to be reliable and accurate, however, its accuracy and completeness cannot be guaranteed. Our firm, employees, and customers may effect transactions, including transactions contrary to any recommendation herein, or have positions in the securities mentioned herein or options with respect thereto. Any recommendation contained in this report may not be suitable for all investors and it is not to be deemed an offer or solicitation on our part with respect to the purchase or sale of any securities. |
|
 |
Bank Index Edged Higher and Broker/Dealer Index Edged Lower
Kenneth J. Gruneisen - Passed the CAN SLIM® Master's Exam
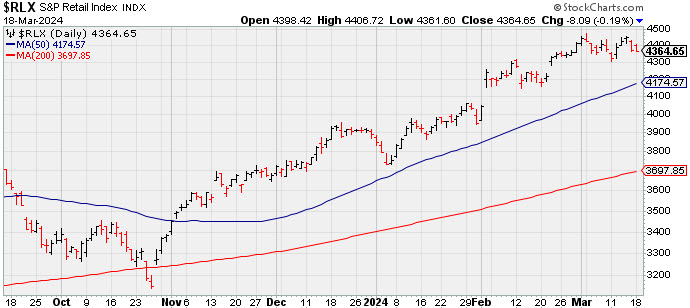
The Retail Index ($RLX -0.19%) and the Broker/Dealer Index ($XBD -0.54%) posted small losses while the Bank Index ($BKX +0.49%) posted a modest gain. The Gold & Silver Index ($XAU -0.95%) lost ground while energy-linked groups held their ground as the Oil Services Index ($OSX +0.06%) and the Integrated Oil Index ($XOI +0.20%) both were little changed. The tech sector had a quiet day as the Semiconductor Index ($SOX +0.00%) finished flat as the Networking Index ($NWX -0.14%) and the Biotech Index ($BTK -0.16%) both inched lower.
![]() PICTURED: The Retail Index ($RLX -0.19%) suffered a 2nd small loss while retreating from its 2024 high.
| Oil Services |
$OSX |
87.55 |
+0.06 |
+0.06% |
+4.37% |
| Integrated Oil |
$XOI |
2,084.53 |
+4.17 |
+0.20% |
+11.92% |
| Semiconductor |
$SOX |
4,757.60 |
-0.10 |
-0.00% |
+13.94% |
| Networking |
$NWX |
777.49 |
-1.07 |
-0.14% |
-6.64% |
| Broker/Dealer |
$XBD |
587.80 |
-3.21 |
-0.54% |
+5.48% |
| Retail |
$RLX |
4,364.65 |
-8.09 |
-0.19% |
+12.24% |
| Gold & Silver |
$XAU |
119.36 |
-1.15 |
-0.95% |
-5.04% |
| Bank |
$BKX |
98.53 |
+0.48 |
+0.49% |
+2.62% |
| Biotech |
$BTK |
5,196.75 |
-8.09 |
-0.16% |
-4.10% |
|
|
|
 |
Consolidating After Subpar Earnings in Latest Quarterly Comparison
Kenneth J. Gruneisen - Passed the CAN SLIM® Master's Exam
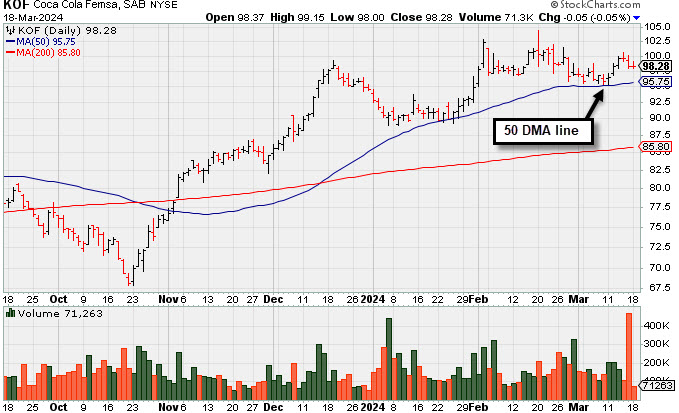
Coca Cola Femsa Sab Ads (KOF -$0.05 or -0.05% to $98.28) posted a 3rd consecutive small loss today with light volume. Recently it found support above its 50-day moving average (DMA) line ($95.75). There was a noted "negative reversal" on 2/20/24 at its all-time high. Its Relative Strength Rating is currently 75, below the 80+ minimum guideline for buy candidates. It will be dropped from the Featured Stocks list tonight.
KOF was highlighted in yellow in the 1/12/24 mid-day report (read here). Since then, KOF reported Dec '23 quarterly earnings -13% on +24% sales revenues versus the year-ago period, below the +25% minimum earnings guideline (C criteria), raising fundamental concerns. KOF has a 86 Earnings Per Share Rating. KOF was last shown in great detail on 2/21/24 with an annotated graph under the headline "Perched at High With Earnings News Due". Annal earnings had a downturn in FY '20 like many companies during the pandemic.
It hails from the Beverages - Non-Alcoholic group which is currently ranked 76th on the 197 Industry Groups list. There are 857.1 million shares in the public float (S criteria). The number of top-rated funds owning its shares rose from 120 in Mar '22 to 169 in Dec '23, a reassuring sign concerning the I criteria. Its current Up/Down Volume Ratio of 1.4 is an unbiased indication its shares have been under accumulation over the past 50 days.
|
|
|
Color Codes Explained :
Y - Better candidates highlighted by our
staff of experts.
G - Previously featured
in past reports as yellow but may no longer be buyable under the
guidelines.
***Last / Change / Volume data in this table is the closing quote data***
Symbol/Exchange
Company Name
Industry Group |
PRICE |
CHANGE
(%Change) |
Day High |
Volume
(% DAV)
(% 50 day avg vol) |
52 Wk Hi
% From Hi |
Featured
Date |
Price
Featured |
Pivot Featured |
|
Max Buy |
 ANET
-
N
ANET
-
N
Arista Networks
Computer-Networking
|
$289.32
|
+11.59
4.17% |
$289.70
|
3,836,296
156.78% of 50 DAV
50 DAV is 2,447,000
|
$292.66
-1.14%
|
3/18/2024
|
$188.84
|
PP = $292.76
|
|
MB = $307.40
|
 Most Recent Note - 3/18/2024 5:02:05 PM
Y - Posted a solid volume-driven gain today for a best-ever close. Color code is changed to yellow after forming a new flat base. Found support at its 50 DMA line ($267.80) during its ongoing ascent. It may be considered a riskier late-stage base, however, a gain above the pivot point backed by at least +80% above average volume may trigger a new technical buy signal.
>>> FEATURED STOCK ARTICLE : Best Ever Close for Arista Networks - 3/1/2024 |
View all notes |
Set NEW NOTE alert |
Company Profile |
SEC
News |
Chart |
Request a new note
C
A
S
I |
NVO
-
N
Novo Nordisk ADR
Medical-Ethical Drugs
|
$132.89
|
+0.52
0.39% |
$133.75
|
3,816,270
69.41% of 50 DAV
50 DAV is 5,498,000
|
$138.28
-3.90%
|
3/1/2024
|
$124.23
|
PP = $124.97
|
|
MB = $131.22
|
Most Recent Note - 3/13/2024 12:40:50 PM
G - Stubbornly holding its ground after last week it rallied from a noted new advanced "3-weeks tight" base with big volume-driven gains. Recent lows in the $118 area define initial support to watch above its 50 DMA line ($116.52).
>>> FEATURED STOCK ARTICLE : Perched at All-Time High After Rallying from Advanced "3-Weeks Tight" - 3/12/2024 |
View all notes |
Set NEW NOTE alert |
Company Profile |
SEC
News |
Chart |
Request a new note
C
A
S
I |
AXON
-
N
Axon Enterprise
Security/Sfty
|
$308.55
|
+0.90
0.29% |
$312.00
|
348,616
70.43% of 50 DAV
50 DAV is 495,000
|
$325.63
-5.25%
|
11/8/2023
|
$127.84
|
PP = $223.30
|
|
MB = $234.47
|
Most Recent Note - 3/15/2024 7:26:16 PM
G - Posted a small gain today with heavy volume, still hovering near its all-time high. Bullish action came after it reported Dec '23 quarterly earnings +60% on +29% sales revenues versus the year-ago period. Its 50-day moving average (DMA) line ($272) defines near-term support to watch. See the latest FSU analysis for more details and an annotated graph.
>>> FEATURED STOCK ARTICLE : Hovering Near All-Time High; Spiked Higher Following Earnings - 3/14/2024 |
View all notes |
Set NEW NOTE alert |
Company Profile |
SEC
News |
Chart |
Request a new note
C
A
S
I |
TDG
-
N
TransDigm Group
Aerospace/Defense
|
$1,181.00
|
+8.80
0.75% |
$1,188.90
|
152,508
68.39% of 50 DAV
50 DAV is 223,000
|
$1,207.58
-2.20%
|
12/12/2023
|
$1,000.39
|
PP = $1,013.18
|
|
MB = $1,063.84
|
Most Recent Note - 3/15/2024 7:19:54 PM
G - Pulled back with higher volume yet remains perched near its all-time high after 3 weeks of tight closes. Its 50 DMA line ($1,114) defines near-term support to watch. See the latest FSU analysis for more details and a new annotated graph.
>>> FEATURED STOCK ARTICLE : Perched in Tight Range Encountering Distribtion Near All-Time High - 3/15/2024 |
View all notes |
Set NEW NOTE alert |
Company Profile |
SEC
News |
Chart |
Request a new note
C
A
S
I |
CRWD
-
N
CrowdStrike Holdings
Computer Sftwr-Security
|
$321.00
|
+5.35
1.69% |
$322.37
|
2,701,749
63.45% of 50 DAV
50 DAV is 4,258,000
|
$365.00
-12.05%
|
1/2/2024
|
$246.42
|
PP = $261.91
|
|
MB = $275.01
|
Most Recent Note - 3/15/2024 7:22:20 PM
G - Pulled back with above-average volume today, closing -13.5% off its all-time high. It has not formed a sound base of sufficient length. Its 50 DMA ($305.25) recently acted as support. Fundamentals remain strong after it reported Jan '24 quarterly earnings +102% on +33% sales revenues versus the year-ago period.
>>> FEATURED STOCK ARTICLE : Encountered Distributional Pressure After Spiking to New High - 3/11/2024 |
View all notes |
Set NEW NOTE alert |
Company Profile |
SEC
News |
Chart |
Request a new note
C
A
S
I |
Symbol/Exchange
Company Name
Industry Group |
PRICE |
CHANGE
(%Change) |
Day High |
Volume
(% DAV)
(% 50 day avg vol) |
52 Wk Hi
% From Hi |
Featured
Date |
Price
Featured |
Pivot Featured |
|
Max Buy |
ELF
-
N
e.l.f. Beauty
Cosmetics/Personal Care
|
$196.86
|
-2.51
-1.26% |
$206.41
|
1,176,774
76.07% of 50 DAV
50 DAV is 1,547,000
|
$221.83
-11.26%
|
1/2/2024
|
$138.23
|
PP = $153.63
|
|
MB = $161.31
|
Most Recent Note - 3/14/2024 5:03:49 PM
G - Extended from any sound base, it pulled back today with below-average volume. Its 50 DMA line ($174) defines important near-term support to watch. Fundamentals remain strong.
>>> FEATURED STOCK ARTICLE : Encountering Distributional Pressure Near All-Time High - 3/8/2024 |
View all notes |
Set NEW NOTE alert |
Company Profile |
SEC
News |
Chart |
Request a new note
C
A
S
I |
KOF
-
NYSE
Coca Cola Femsa Sab Ads
Beverages-Non-Alcoholic
|
$98.28
|
-0.05
-0.05% |
$99.15
|
71,263
39.92% of 50 DAV
50 DAV is 178,500
|
$104.38
-5.84%
|
1/12/2024
|
$93.38
|
PP = $99.34
|
|
MB = $104.31
|
Most Recent Note - 3/18/2024 5:04:24 PM
Posted a 3rd consecutive loss today with light volume. Recently found support above its 50 DMA line ($95.75). There was a noted "negative reversal" on 2/20/24 at its all-time high and its Relative Strength Rating has slumped to 75, below the 80+ minimum guidline for buy candidates. Reported Dec '23 quarterly earnings -13% on +24% sales revenues versus the year-ago period, raising fundamental concerns. See the latest FSU analysis for more details and a new annotated graph.
>>> FEATURED STOCK ARTICLE : Consolidating After Subpar Earnings in Latest Quarterly Comparison - 3/18/2024 |
View all notes |
Set NEW NOTE alert |
Company Profile |
SEC
News |
Chart |
Request a new note
C
A
S
I |
PCAR
-
N
Paccar
Trucks and Parts-Hvy Duty
|
$120.34
|
+2.01
1.70% |
$120.43
|
2,992,714
126.86% of 50 DAV
50 DAV is 2,359,000
|
$118.95
1.17%
|
1/23/2024
|
$100.35
|
PP = $98.57
|
|
MB = $103.50
|
Most Recent Note - 3/15/2024 12:45:03 PM
G - Hitting a new all-time high with today's gain, steadily wedging higher with gains lacking great volume conviction. Its 50 DMA line ($105.12) defines near-term support to watch on pullbacks. Fundamentals remain strong.
>>> FEATURED STOCK ARTICLE : Extended From Any Sound Base After 7 Weekly Gains - 2/26/2024 |
View all notes |
Set NEW NOTE alert |
Company Profile |
SEC
News |
Chart |
Request a new note
C
A
S
I |
HUBB
-
N
Hubbell
Electrical-Power/Equipmt
|
$399.61
|
+4.46
1.13% |
$403.94
|
299,748
69.07% of 50 DAV
50 DAV is 434,000
|
$404.15
-1.12%
|
1/30/2024
|
$343.26
|
PP = $336.83
|
|
MB = $353.67
|
Most Recent Note - 3/18/2024 5:07:24 PM
G - Perched at its all-time high, very extended from the previously noted base. Its 50 DMA line ($356.47) defines important support to watch on pullbacks.
>>> FEATURED STOCK ARTICLE : Inched to New Highs With Average Volume - 2/28/2024 |
View all notes |
Set NEW NOTE alert |
Company Profile |
SEC
News |
Chart |
Request a new note
C
A
S
I |
MANH
-
N
Manhattan Associates
Computer Sftwr-Enterprse
|
$247.00
|
+0.00
0.00% |
$249.37
|
310,946
82.48% of 50 DAV
50 DAV is 377,000
|
$266.94
-7.47%
|
1/31/2024
|
$240.57
|
PP = $230.71
|
|
MB = $242.25
|
Most Recent Note - 3/18/2024 5:08:57 PM
G - Halted its slide with a small gain today on light volume following 3 straight losses marked by above-average volume. It is extended from the previously noted base. Its 50 DMA line ($238) defines near-term support to watch above prior highs in the $230 area.
>>> FEATURED STOCK ARTICLE : Hovering Near All-Time High After Streak of Small Gains - 2/29/2024 |
View all notes |
Set NEW NOTE alert |
Company Profile |
SEC
News |
Chart |
Request a new note
C
A
S
I |
Symbol/Exchange
Company Name
Industry Group |
PRICE |
CHANGE
(%Change) |
Day High |
Volume
(% DAV)
(% 50 day avg vol) |
52 Wk Hi
% From Hi |
Featured
Date |
Price
Featured |
Pivot Featured |
|
Max Buy |
USLM
-
N
U.S. Lime & Minerals
Bldg-Cement/Concrt/Ag
|
$288.78
|
-2.51
-0.86% |
$295.00
|
24,763
117.92% of 50 DAV
50 DAV is 21,000
|
$298.36
-3.21%
|
2/9/2024
|
$254.68
|
PP = $265.09
|
|
MB = $278.34
|
Most Recent Note - 3/15/2024 7:28:13 PM
G - There was a "negative reversal" today at its all-time high breaking a streak of 6 consecutive gains. Prior highs in the $265-266 area define initial near-term support to watch on pullbacks.
>>> FEATURED STOCK ARTICLE : Hit New All Time High With Light Volume Behind 5th Straight Gain - 3/13/2024 |
View all notes |
Set NEW NOTE alert |
Company Profile |
SEC
News |
Chart |
Request a new note
C
A
S
I |
NOW
-
N
ServiceNow
Computer Sftwr-Enterprse
|
$755.57
|
+11.66
1.57% |
$759.69
|
907,578
70.68% of 50 DAV
50 DAV is 1,284,000
|
$815.32
-7.33%
|
2/22/2024
|
$771.75
|
PP = $815.32
|
|
MB = $856.09
|
Most Recent Note - 3/15/2024 7:24:49 PM
G - Gapped down today and violated its 50 DMA line ($759) with a volume-driven loss raising concerns and triggering a technical sell signal. Its color code is changed to green. Prior lows in the &30 area define the next important near-term support to watch. A rebound above the 50 DMA line is needed for its outlook to improve.
>>> FEATURED STOCK ARTICLE : Found Support With a Solid Gap Up from 10-Week Moving Average - 2/23/2024 |
View all notes |
Set NEW NOTE alert |
Company Profile |
SEC
News |
Chart |
Request a new note
C
A
S
I |
SNPS
-
NASDAQ
Synopsys Inc
COMPUTER SOFTWARE and SERVICES - Technical and System Software
|
$560.69
|
+10.66
1.94% |
$565.95
|
1,027,620
76.09% of 50 DAV
50 DAV is 1,350,600
|
$629.38
-10.91%
|
2/22/2024
|
$600.65
|
PP = $582.85
|
|
MB = $611.99
|
Most Recent Note - 3/18/2024 5:10:34 PM
Y - Posted a gain today with lighter volume, finding support above its 50 DMA line ($548). Volume totals have been cooling in recent weeks while consolidating. Previously noted - "A strong volume-driven gain and close above the pivot point is needed to clinch a proper technical buy signal. Reported Jan '24 quarterly earnings +36% on +21% sales revenues versus the year-ago period, its 3rd strong quarter above the +25% minimum earnings guideline (C criteria). Annual earnings growth (A criteria) has been strong and steady."
>>> FEATURED STOCK ARTICLE : Gapped Up for New High But Ended Near Session Low - 2/22/2024 |
View all notes |
Set NEW NOTE alert |
Company Profile |
SEC
News |
Chart |
Request a new note
C
A
S
I |
PAY
-
N
Paymentus Holdings
Finance-CrdtCard/PmtPr
|
$22.37
|
-0.79
-3.41% |
$23.32
|
403,395
141.05% of 50 DAV
50 DAV is 286,000
|
$24.99
-10.48%
|
3/5/2024
|
$19.97
|
PP = $18.89
|
|
MB = $19.83
|
Most Recent Note - 3/18/2024 5:06:00 PM
G - Pulled back from its 52-week high with today's 3rd consecutive volume-driven loss after getting very extended from the previously noted base. Prior highs in the $18 range define important initial support to watch on pullbacks.
>>> FEATURED STOCK ARTICLE : Big Gap Up Gain Triggered Technical Buy Signal - 3/5/2024 |
View all notes |
Set NEW NOTE alert |
Company Profile |
SEC
News |
Chart |
Request a new note
C
A
S
I |
|
|
|
THESE ARE NOT BUY RECOMMENDATIONS!
Comments contained in the body of this report are technical
opinions only. The material herein has been obtained
from sources believed to be reliable and accurate, however,
its accuracy and completeness cannot be guaranteed.
This site is not an investment advisor, hence it does
not endorse or recommend any securities or other investments.
Any recommendation contained in this report may not
be suitable for all investors and it is not to be deemed
an offer or solicitation on our part with respect to
the purchase or sale of any securities. All trademarks,
service marks and trade names appearing in this report
are the property of their respective owners, and are
likewise used for identification purposes only.
This report is a service available
only to active Paid Premium Members.
You may opt-out of receiving report notifications
at any time. Questions or comments may be submitted
by writing to Premium Membership Services 665 S.E. 10 Street, Suite 201 Deerfield Beach, FL 33441-5634 or by calling 1-800-965-8307
or 954-785-1121.
|
|
|