You are not logged in.
This means you
CAN ONLY VIEW reports that were published prior to Monday, March 24, 2025.
You
MUST UPGRADE YOUR MEMBERSHIP if you want to see any current reports.
AFTER MARKET UPDATE - FRIDAY, MARCH 15TH, 2024
Previous After Market Report Next After Market Report >>>
|
|
|
|
DOW |
-190.89 |
38,714.77 |
-0.49% |
|
Volume |
3,809,570,800 |
+223% |
|
Volume |
8,541,282,000 |
+56% |
|
NASDAQ |
-155.36 |
15,973.17 |
-0.96% |
|
Advancers |
1,517 |
56% |
|
Advancers |
2,231 |
53% |
|
S&P 500 |
-33.39 |
5,117.09 |
-0.65% |
|
Decliners |
1,211 |
44% |
|
Decliners |
1,991 |
47% |
|
Russell 2000 |
+8.15 |
2,039.32 |
+0.40% |
|
52 Wk Highs |
102 |
|
|
52 Wk Highs |
82 |
|
|
S&P 600 |
+6.24 |
1,287.74 |
+0.49% |
|
52 Wk Lows |
54 |
|
|
52 Wk Lows |
141 |
|
|
 |
Major Indices Fell With Higher Volume Due to Options Expirations
Kenneth J. Gruneisen - Passed the CAN SLIM® Master's Exam
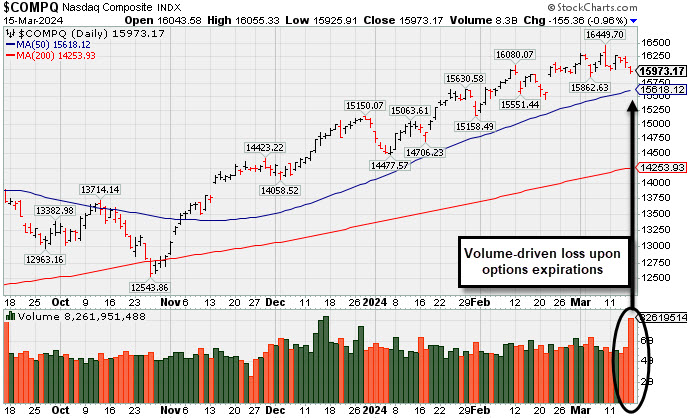
The Dow Jones Industrial Average (-0.5%), the S&P 500 (-0.6%), and the Nasdaq Composite (-1.0%) each closed with a loss but improved from their lows on Friday's session. Volume reported was much higher that the prior session totals on the NYSE and on the Nasdaq exchange, inflated by options expirations. Breadth was slightly positive as advancers led decliners by a 5-4 margin on the NYSE and by a narrower margin on the Nasdaq exchange. There were 41 high-ranked companies from the Leaders List that hit new 52-week highs and were listed on the BreakOuts Page, versus the total of 50 on the prior session. New 52-week highs totals contracted yet still outnumbered the new 52-week lows total on the NYSE, but for a second consecutive session new lows outnumbered new highs decisively on the Nasdaq exchange. The major indices are in a confirmed uptrend (M criteria). New buying efforts should be only made in stocks fitting all key criteria of the fact-based investment system.
PICTURED: The Nasdaq Composite Index pulled back from its all time high with options expirations influencing the high volume behind Friday's 3rd consecutive loss.
The Russell 2000 outperformed, gaining +0.4% thanks to strength in energy and regional bank stocks. This strength left the S&P 500 energy sector higher by 0.2%, meanwhile the utilities (+0.1%), materials (+0.1%), and industrials (+0.1%) sectors also settled higher while the remaining seven sectors logged declines. Big earnings-related declines in Jabil (JBL -16.49%) and Adobe (ADBE -13.67%) contributed to the info tech sector's underperformance as the information technology (-1.3%), communication services (-1.2%), and consumer discretionary (-1.1%) sectors fell.
The 2-yr note yield rose three basis points to 4.72% and the 10-yr note yield settled one basis point higher at 4.30%.
|
 Kenneth J. Gruneisen started out as a licensed stockbroker in August 1987, a couple of months prior to the historic stock market crash that took the Dow Jones Industrial Average down -22.6% in a single day. He has published daily fact-based fundamental and technical analysis on high-ranked stocks online for two decades. Through FACTBASEDINVESTING.COM, Kenneth provides educational articles, news, market commentary, and other information regarding proven investment systems that work in good times and bad.
Comments contained in the body of this report are technical opinions only and are not necessarily those of Gruneisen Growth Corp. The material herein has been obtained from sources believed to be reliable and accurate, however, its accuracy and completeness cannot be guaranteed. Our firm, employees, and customers may effect transactions, including transactions contrary to any recommendation herein, or have positions in the securities mentioned herein or options with respect thereto. Any recommendation contained in this report may not be suitable for all investors and it is not to be deemed an offer or solicitation on our part with respect to the purchase or sale of any securities. |
|
 |
Commodity-Linked Groups and Broker/Dealer Index Posted Gains
Kenneth J. Gruneisen - Passed the CAN SLIM® Master's Exam
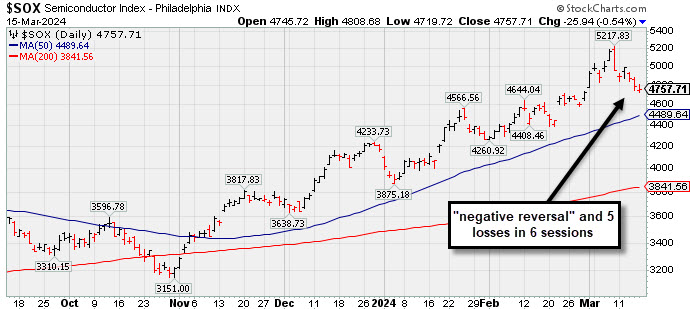
The Retail Index ($RLX -1.68%) suffered a loss and weighed on the major averages while the Bank Index ($BKX +0.03%) finished flat and the Broker/Dealer Index ($XBD +0.53%) posted a small gain. The Gold & Silver Index ($XAU +0.68%) and energy-linked groups had a positive bias as the Oil Services Index ($OSX +0.42%) and the Integrated Oil Index ($XOI +0.71%) both posted solid gains. The tech sector was led lower by the Semiconductor Index ($SOX -0.54%) and the Networking Index ($NWX -0.46%) while the Biotech Index ($BTK -0.01%) finished flat.
![]() PICTURED: The Semiconductor Index ($SOX -0.54%) had a "negative reversal" and suffered 5 losses in the past 6 sessions while retreating from its all-time high.
| Oil Services |
$OSX |
87.49 |
+0.37 |
+0.42% |
+4.31% |
| Integrated Oil |
$XOI |
2,080.36 |
+14.59 |
+0.71% |
+11.70% |
| Semiconductor |
$SOX |
4,757.71 |
-25.94 |
-0.54% |
+13.94% |
| Networking |
$NWX |
778.56 |
-3.63 |
-0.46% |
-6.51% |
| Broker/Dealer |
$XBD |
591.01 |
+3.09 |
+0.53% |
+6.05% |
| Retail |
$RLX |
4,372.74 |
-74.85 |
-1.68% |
+12.45% |
| Gold & Silver |
$XAU |
120.50 |
+0.82 |
+0.68% |
-4.13% |
| Bank |
$BKX |
98.05 |
+0.03 |
+0.03% |
+2.12% |
| Biotech |
$BTK |
5,204.83 |
-0.78 |
-0.01% |
-3.95% |
|
|
|
 |
Perched in Tight Range Encountering Distribtion Near All-Time High
Kenneth J. Gruneisen - Passed the CAN SLIM® Master's Exam
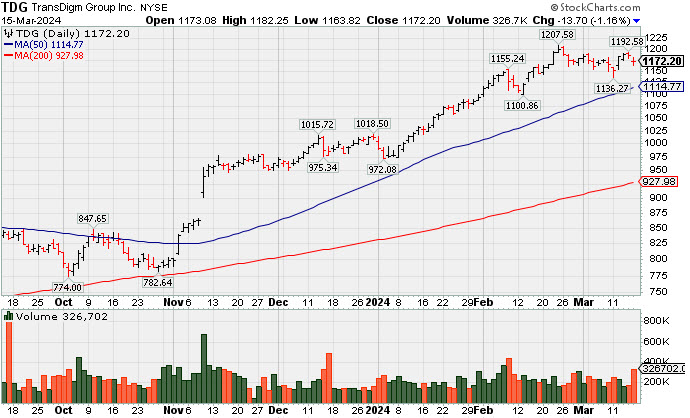
Transdigm Group Inc (TDG -$13.70 or -1.16% to $1,172.20) pulled back with higher volume yet remains perched near its all-time high after 3 weeks of tight closes. It has shown somew signs of distributional pressure with higher volume loss and lighter volume gains. Its 50-day moving average (DMA) line ($1,114) defines near-term support to watch.
TDG was highlighted in yellow in the 11/09/23 mid-day report (read here) with pivot point cited based on its 8/08/23 high plus 10 cents. It was last shown in the FSU section on 2/14/24 in greater detail with an annotated graph under the headline, "Transdigm Perched Near All-Time High".
Fundamentals remain strong. It reported Dec '23 quarterly earnings +56% on +28% sales revenues versus the year-ago period, its 11th consecutive comparison above the +25% minimum earnings guideline (C criteria). Growth has been very strong after a downturn in FY '20 and '21 (A criteria) hurt its earnings track record. It has an 91 Earnings Per Share Rating.
The number of top-rated funds owning its shares rose from 1,332 in Dec '22 to 1,536 in Dec '23, a reassuring trend concerning the I criteria. Its small supply of 53.4 million shares (S criteria) in the public float can contribute to greater price volatility in the event of institutional buying or selling. It has a Timeliness Rating of A and an Accumulation/Distribution rating of B-.
Charts used courtesy of www.stockcharts.com
Symbol/Exchange
Company Name
Industry Group | PRICE | CHANGE
(%Change) | Day High | Volume
(% DAV)
(% 50 day avg vol) | 52 Wk Hi
% From Hi | Featured
Date | Price
Featured | Pivot Featured | | Max Buy |  ANET - N ANET - N
Arista Networks
Computer-Networking | $277.73 | -6.29
-2.21% | $281.81 | 3,818,972
159.46% of 50 DAV
50 DAV is 2,395,000 | $292.66
-5.10%
| 10/31/2023 | $188.84 | PP = $198.80 | | MB = $208.74 | Most Recent Note - 3/12/2024 9:43:43 PM
G - Posted a solid gain today after testing support at its 50 DMA line ($263.70) on the prior session. It has not formed a sound base of sufficient length.
>>> FEATURED STOCK ARTICLE : Best Ever Close for Arista Networks - 3/1/2024 | View all notes | Set NEW NOTE alert | Company Profile | SEC News | Chart | Request a new note C A S I | NVO - N
Novo Nordisk ADR
Medical-Ethical Drugs | $132.37 | -2.21
-1.64% | $134.00 | 3,777,276
68.64% of 50 DAV
50 DAV is 5,503,000 | $138.28
-4.27%
| 3/1/2024 | $124.23 | PP = $124.97 | | MB = $131.22 | Most Recent Note - 3/13/2024 12:40:50 PM
G - Stubbornly holding its ground after last week it rallied from a noted new advanced "3-weeks tight" base with big volume-driven gains. Recent lows in the $118 area define initial support to watch above its 50 DMA line ($116.52).
>>> FEATURED STOCK ARTICLE : Perched at All-Time High After Rallying from Advanced "3-Weeks Tight" - 3/12/2024 | View all notes | Set NEW NOTE alert | Company Profile | SEC News | Chart | Request a new note C A S I | AXON - N
Axon Enterprise
Security/Sfty | $307.78 | +1.35
0.44% | $309.70 | 1,568,784
333.08% of 50 DAV
50 DAV is 471,000 | $325.63
-5.48%
| 11/8/2023 | $127.84 | PP = $223.30 | | MB = $234.47 |  Most Recent Note - 3/15/2024 7:26:16 PM Most Recent Note - 3/15/2024 7:26:16 PM
G - Posted a small gain today with heavy volume, still hovering near its all-time high. Bullish action came after it reported Dec '23 quarterly earnings +60% on +29% sales revenues versus the year-ago period. Its 50-day moving average (DMA) line ($272) defines near-term support to watch. See the latest FSU analysis for more details and an annotated graph.
>>> FEATURED STOCK ARTICLE : Hovering Near All-Time High; Spiked Higher Following Earnings - 3/14/2024 | View all notes | Set NEW NOTE alert | Company Profile | SEC News | Chart | Request a new note C A S I | TDG - N
TransDigm Group
Aerospace/Defense | $1,172.20 | -13.70
-1.16% | $1,182.25 | 326,702
147.16% of 50 DAV
50 DAV is 222,000 | $1,207.58
-2.93%
| 12/12/2023 | $1,000.39 | PP = $1,013.18 | | MB = $1,063.84 | Most Recent Note - 3/15/2024 7:19:54 PM
G - Pulled back with higher volume yet remains perched near its all-time high after 3 weeks of tight closes. Its 50 DMA line ($1,114) defines near-term support to watch. See the latest FSU analysis for more details and a new annotated graph.
>>> FEATURED STOCK ARTICLE : Perched in Tight Range Encountering Distribtion Near All-Time High - 3/15/2024 | View all notes | Set NEW NOTE alert | Company Profile | SEC News | Chart | Request a new note C A S I | CRWD - N
CrowdStrike Holdings
Computer Sftwr-Security | $315.63 | -12.96
-3.94% | $327.39 | 4,477,828
105.83% of 50 DAV
50 DAV is 4,231,000 | $365.00
-13.53%
| 1/2/2024 | $246.42 | PP = $261.91 | | MB = $275.01 | Most Recent Note - 3/15/2024 7:22:20 PM
G - Pulled back with above-average volume today, closing -13.5% off its all-time high. It has not formed a sound base of sufficient length. Its 50 DMA ($305.25) recently acted as support. Fundamentals remain strong after it reported Jan ''24 quarterly earnings +102% on +33% sales revenues versus the year-ago period.
>>> FEATURED STOCK ARTICLE : Encountered Distributional Pressure After Spiking to New High - 3/11/2024 | View all notes | Set NEW NOTE alert | Company Profile | SEC News | Chart | Request a new note C A S I | Symbol/Exchange
Company Name
Industry Group | PRICE | CHANGE
(%Change) | Day High | Volume
(% DAV)
(% 50 day avg vol) | 52 Wk Hi
% From Hi | Featured
Date | Price
Featured | Pivot Featured | | Max Buy | ELF - N
e.l.f. Beauty
Cosmetics/Personal Care | $199.37 | -0.92
-0.46% | $201.51 | 1,654,926
107.88% of 50 DAV
50 DAV is 1,534,000 | $221.83
-10.12%
| 1/2/2024 | $138.23 | PP = $153.63 | | MB = $161.31 | Most Recent Note - 3/14/2024 5:03:49 PM
G - Extended from any sound base, it pulled back today with below-average volume. Its 50 DMA line ($174) defines important near-term support to watch. Fundamentals remain strong.
>>> FEATURED STOCK ARTICLE : Encountering Distributional Pressure Near All-Time High - 3/8/2024 | View all notes | Set NEW NOTE alert | Company Profile | SEC News | Chart | Request a new note C A S I | KOF - NYSE
Coca Cola Femsa Sab Ads
Beverages - Soft Drinks | $98.33 | -1.31
-1.31% | $100.17 | 468,186
271.41% of 50 DAV
50 DAV is 172,500 | $104.38
-5.80%
| 1/12/2024 | $93.38 | PP = $99.34 | | MB = $104.31 | Most Recent Note - 3/12/2024 9:37:21 PM
Y - Posted a 2nd consecutive gain today with slightly above-average volume, finding support above its 50 DMA line ($95.23). There was a noted "negative reversal" on 2/20/24 at its all-time high. Reported Dec ''23 quarterly earnings -13% on +24% sales revenues versus the year-ago period, raising fundamental concerns.
>>> FEATURED STOCK ARTICLE : Perched at High With Earnings News Due - 2/21/2024 | View all notes | Set NEW NOTE alert | Company Profile | SEC News | Chart | Request a new note C A S I | PCAR - N
Paccar
Trucks and Parts-Hvy Duty | $118.34 | +3.13
2.72% | $118.95 | 7,281,327
320.76% of 50 DAV
50 DAV is 2,270,000 | $116.88
1.25%
| 1/23/2024 | $100.35 | PP = $98.57 | | MB = $103.50 | Most Recent Note - 3/15/2024 12:45:03 PM
G - Hitting a new all-time high with today's gain, steadily wedging higher with gains lacking great volume conviction. Its 50 DMA line ($105.12) defines near-term support to watch on pullbacks. Fundamentals remain strong.
>>> FEATURED STOCK ARTICLE : Extended From Any Sound Base After 7 Weekly Gains - 2/26/2024 | View all notes | Set NEW NOTE alert | Company Profile | SEC News | Chart | Request a new note C A S I | HUBB - N
Hubbell
Electrical-Power/Equipmt | $395.15 | -6.68
-1.66% | $402.77 | 975,154
231.63% of 50 DAV
50 DAV is 421,000 | $404.15
-2.23%
| 1/30/2024 | $343.26 | PP = $336.83 | | MB = $353.67 | Most Recent Note - 3/12/2024 9:01:56 PM
G - Rallied for a new all-time high and closed at the session high with today''s volume-driven gain, getting more extended from the previously noted base. Its 50 DMA line ($350) defines important support to watch on pullbacks.
>>> FEATURED STOCK ARTICLE : Inched to New Highs With Average Volume - 2/28/2024 | View all notes | Set NEW NOTE alert | Company Profile | SEC News | Chart | Request a new note C A S I | MANH - N
Manhattan Associates
Computer Sftwr-Enterprse | $247.00 | -3.67
-1.46% | $249.43 | 1,081,810
298.02% of 50 DAV
50 DAV is 363,000 | $266.94
-7.47%
| 1/31/2024 | $240.57 | PP = $230.71 | | MB = $242.25 | Most Recent Note - 3/12/2024 9:47:13 PM
G - Posted a small gain today with +47% above average volume. It is extended from the previously noted base. Its 50 DMA line ($234) defines near-term support to watch above prior highs in the $230 area.
>>> FEATURED STOCK ARTICLE : Hovering Near All-Time High After Streak of Small Gains - 2/29/2024 | View all notes | Set NEW NOTE alert | Company Profile | SEC News | Chart | Request a new note C A S I | Symbol/Exchange
Company Name
Industry Group | PRICE | CHANGE
(%Change) | Day High | Volume
(% DAV)
(% 50 day avg vol) | 52 Wk Hi
% From Hi | Featured
Date | Price
Featured | Pivot Featured | | Max Buy | USLM - N
U.S. Lime & Minerals
Bldg-Cement/Concrt/Ag | $290.54 | -3.45
-1.17% | $298.18 | 81,380
406.90% of 50 DAV
50 DAV is 20,000 | $298.36
-2.62%
| 2/9/2024 | $254.68 | PP = $265.09 | | MB = $278.34 | Most Recent Note - 3/15/2024 7:28:13 PM
G - There was a "negative reversal" today at its all-time high breaking a streak of 6 consecutive gains. Prior highs in the $265-266 area define initial near-term support to watch on pullbacks.
>>> FEATURED STOCK ARTICLE : Hit New All Time High With Light Volume Behind 5th Straight Gain - 3/13/2024 | View all notes | Set NEW NOTE alert | Company Profile | SEC News | Chart | Request a new note C A S I | NOW - N
ServiceNow
Computer Sftwr-Enterprse | $743.91 | -35.58
-4.56% | $762.00 | 2,538,189
202.89% of 50 DAV
50 DAV is 1,251,000 | $815.32
-8.76%
| 2/22/2024 | $771.75 | PP = $815.32 | | MB = $856.09 | Most Recent Note - 3/15/2024 7:24:49 PM
G - Gapped down today and violated its 50 DMA line ($759) with a volume-driven loss raising concerns and triggering a technical sell signal. Its color code is changed to green. Prior lows in the &30 area define the next important near-term support to watch. A rebound above the 50 DMA line is needed for its outlook to improve.
>>> FEATURED STOCK ARTICLE : Found Support With a Solid Gap Up from 10-Week Moving Average - 2/23/2024 | View all notes | Set NEW NOTE alert | Company Profile | SEC News | Chart | Request a new note C A S I | SNPS - N
Synopsys
Computer Sftwr-Design | $550.05 | -9.26
-1.66% | $562.00 | 1,347,261
100.02% of 50 DAV
50 DAV is 1,347,000 | $629.38
-12.60%
| 2/22/2024 | $600.65 | PP = $582.85 | | MB = $611.99 | Most Recent Note - 3/13/2024 10:20:11 PM
Y - Pulled back today with higher (still below-average) volume. Volume totals have been cooling in recent weeks while consolidating. The prior low ($555 on 3/11/24) defines near-term support above its 50 DMA line ($544.38). Previously noted - "A strong volume-driven gain and close above the pivot point is needed to clinch a proper technical buy signal. Reported Jan ''24 quarterly earnings +36% on +21% sales revenues versus the year-ago period, its 3rd strong quarter above the +25% minimum earnings guideline (C criteria). Annual earnings growth (A criteria) has been strong and steady."
>>> FEATURED STOCK ARTICLE : Gapped Up for New High But Ended Near Session Low - 2/22/2024 | View all notes | Set NEW NOTE alert | Company Profile | SEC News | Chart | Request a new note C A S I | PAY - N
Paymentus Holdings
Finance-CrdtCard/PmtPr | $23.16 | -0.32
-1.36% | $23.75 | 537,771
194.14% of 50 DAV
50 DAV is 277,000 | $24.99
-7.32%
| 3/5/2024 | $19.97 | PP = $18.89 | | MB = $19.83 | Most Recent Note - 3/14/2024 12:16:57 PM
G - Pulling back from its 52-week high with today's loss following 4 consecutive volume-driven gains. Very extended from the previously noted base. Prior highs in the $18 range define important initial support to watch on pullbacks.
>>> FEATURED STOCK ARTICLE : Big Gap Up Gain Triggered Technical Buy Signal - 3/5/2024 | View all notes | Set NEW NOTE alert | Company Profile | SEC News | Chart | Request a new note C A S I |
|
|
|
Color Codes Explained :
Y - Better candidates highlighted by our
staff of experts.
G - Previously featured
in past reports as yellow but may no longer be buyable under the
guidelines.
***Last / Change / Volume data in this table is the closing quote data***
|
|
|
THESE ARE NOT BUY RECOMMENDATIONS!
Comments contained in the body of this report are technical
opinions only. The material herein has been obtained
from sources believed to be reliable and accurate, however,
its accuracy and completeness cannot be guaranteed.
This site is not an investment advisor, hence it does
not endorse or recommend any securities or other investments.
Any recommendation contained in this report may not
be suitable for all investors and it is not to be deemed
an offer or solicitation on our part with respect to
the purchase or sale of any securities. All trademarks,
service marks and trade names appearing in this report
are the property of their respective owners, and are
likewise used for identification purposes only.
This report is a service available
only to active Paid Premium Members.
You may opt-out of receiving report notifications
at any time. Questions or comments may be submitted
by writing to Premium Membership Services 665 S.E. 10 Street, Suite 201 Deerfield Beach, FL 33441-5634 or by calling 1-800-965-8307
or 954-785-1121.
|
|
|