You are not logged in.
This means you
CAN ONLY VIEW reports that were published prior to Wednesday, April 9, 2025.
You
MUST UPGRADE YOUR MEMBERSHIP if you want to see any current reports.
AFTER MARKET UPDATE - THURSDAY, DECEMBER 21ST, 2023
Previous After Market Report Next After Market Report >>>
|
|
|
|
DOW |
+322.35 |
37,404.35 |
+0.87% |
|
Volume |
841,473,320 |
-18% |
|
Volume |
5,518,643,500 |
-13% |
|
NASDAQ |
+185.92 |
14,963.87 |
+1.26% |
|
Advancers |
2,227 |
80% |
|
Advancers |
3,144 |
73% |
|
S&P 500 |
+48.40 |
4,746.75 |
+1.03% |
|
Decliners |
543 |
20% |
|
Decliners |
1,140 |
27% |
|
Russell 2000 |
+34.23 |
2,017.06 |
+1.73% |
|
52 Wk Highs |
222 |
|
|
52 Wk Highs |
387 |
|
|
S&P 600 |
+21.71 |
1,313.19 |
+1.68% |
|
52 Wk Lows |
30 |
|
|
52 Wk Lows |
170 |
|
|
 |
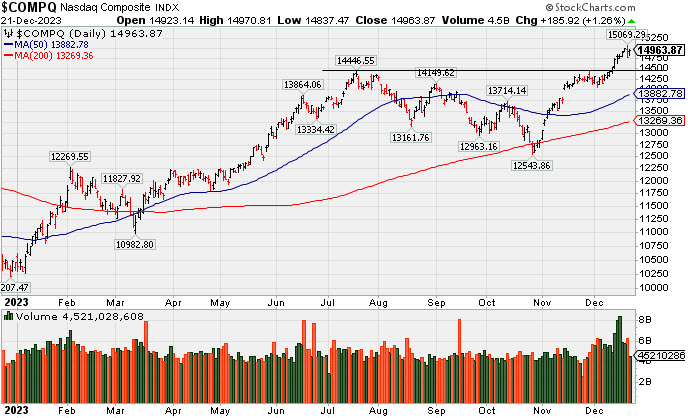
Breadth Positive as Major Indices Notched More Gains
Kenneth J. Gruneisen - Passed the CAN SLIM® Master's Exam
The Dow Jones Industrial Average rose 0.9% while the S&P 500 climbed 1.0% and the Nasdaq Composite jumped 1.3%. The Russell 2000 small cap index outpaced the major indices as it gained +1.7%. Volume was reported lighter than the prior session totals on the NYSE and on the Nasdaq exchange. Breadth was positive as advancers led decliners by a 4-1 margin on the NYSE and by nearly 3-1 on the Nasdaq exchange. There were only 35 high-ranked companies from the Leaders List that hit new 52-week highs and were listed on the BreakOuts Page, versus the total of 123 on the prior session. New 52-week highs totals contracted yet solidly outnumbered new 52-week lows totals on the NYSE and on the Nasdaq exchange. The major indices are in a confirmed uptrend (M criteria). New buying efforts should be only made in stocks fitting all key criteria of the fact-based investment system.
PICTURED: The Nasdaq Composite Index is perched near its 2023 high following an impressive streak of volume-driven gains. Semiconductor stocks were noticeably strong after better-than-expected results and guidance from Micron (MU +8.53%). Oil prices ($73.89/bbl, -0.35, -0.5%) edged lower after a report that Angola is leaving OPEC. The market's upside bias was also supported by economic data supporting the soft landing narrative.
The 2-yr note yield fell two basis points to 4.33% and the 10-yr note yield settled one basis point higher at 3.89%. The November Personal Income and Spending report will be released Friday morning. This report will feature the Fed's preferred inflation gauge, the core PCE Price Index.
|
 Kenneth J. Gruneisen started out as a licensed stockbroker in August 1987, a couple of months prior to the historic stock market crash that took the Dow Jones Industrial Average down -22.6% in a single day. He has published daily fact-based fundamental and technical analysis on high-ranked stocks online for two decades. Through FACTBASEDINVESTING.COM, Kenneth provides educational articles, news, market commentary, and other information regarding proven investment systems that work in good times and bad.
Comments contained in the body of this report are technical opinions only and are not necessarily those of Gruneisen Growth Corp. The material herein has been obtained from sources believed to be reliable and accurate, however, its accuracy and completeness cannot be guaranteed. Our firm, employees, and customers may effect transactions, including transactions contrary to any recommendation herein, or have positions in the securities mentioned herein or options with respect thereto. Any recommendation contained in this report may not be suitable for all investors and it is not to be deemed an offer or solicitation on our part with respect to the purchase or sale of any securities. |
|
 |
Retail, Financial, Tech, and Commodity-Linked Groups Rose
Kenneth J. Gruneisen - Passed the CAN SLIM® Master's Exam
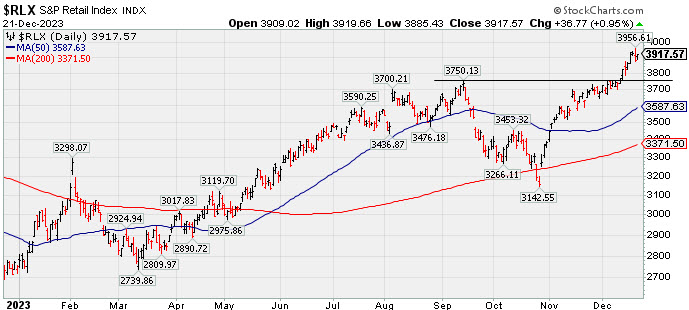
The Broker/Dealer Index ($XBD +1.38%), Bank Index ($BKX +1.16%), and the Retail Index ($RLX +0.95%) each posted gains on Thursday. The tech sector had a positive bias as the Biotech Index ($BTK +1.52%), Networking Index ($NWX +1.83%), and the Semiconductor Index ($SOX +2.77%) each rose. Commodity-linked groups also had a positive bias as the Gold & Silver Index ($XAU +1.64%) outpaced the Integrated Oil Index ($XOI +0.34%) and the Oil Services Index ($OSX +0.79%).
PICTURED: The Retail Index ($RLX +0.95%) is consolidating after rallying to a new 2023 high.
| Oil Services |
$OSX |
85.15 |
+0.66 |
+0.79% |
+1.54% |
| Integrated Oil |
$XOI |
1,881.06 |
+6.36 |
+0.34% |
+5.25% |
| Semiconductor |
$SOX |
4,118.59 |
+110.93 |
+2.77% |
+62.65% |
| Networking |
$NWX |
823.01 |
+14.75 |
+1.83% |
+5.07% |
| Broker/Dealer |
$XBD |
549.82 |
+7.50 |
+1.38% |
+22.42% |
| Retail |
$RLX |
3,917.57 |
+36.77 |
+0.95% |
+42.25% |
| Gold & Silver |
$XAU |
126.95 |
+2.05 |
+1.64% |
+5.04% |
| Bank |
$BKX |
95.12 |
+1.09 |
+1.16% |
-5.68% |
| Biotech |
$BTK |
5,262.39 |
+78.78 |
+1.52% |
-0.35% |
|
|
|
 |
Consolidating Above Pivot Point With Volume Cooling
Kenneth J. Gruneisen - Passed the CAN SLIM® Master's Exam
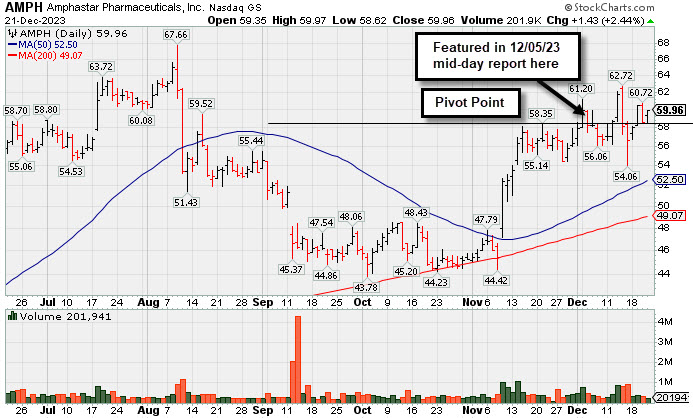
Amphastar Pharm (AMPH +$1.43 or +2.44% to $59.96) posted a small gain today. Volume totals have been cooling while consolidating. It is above the pivot point cited based on its 11/21/23 high after a cup-with-handle base. Little resistance remains due to overhead supply. Fundamentals remain strong.
AMPH was highlighted in yellow in the 12/04/23 mid-day report (read here) with pivot point cited based on its 11/21/23 high after a cup-with-handle base. It was coverned in greater detail that evening with an annotated graph under the headline "Amphastar Pharm on Track for 7th Weekly Gain". The gain and strong close above the pivot point backed by +100% above average volume triggered a technical buy signal. Since then it has made choppy progress toward its August all-time high.
Fundamentals remain strong after it reported Sep '23 quarterly earnings +203% on +50% sales revenues versus the year-ago period. It has a 99 Earnings Per Share Rating, well above the 80+ minimum guideline for buy candidates. The 4 latest quarterly comparisons through Sep '23 have been well above the +25% minimum earnings guideline (C criteria). Annual earnings history (A criteria) has been strong. It hails from the Medical-Biomed/Biotech group which is currently ranked 31st on the 197 Industry Groups list (L criteria).
The number of top-rated funds owning its shares reportedly rose from 435 in Mar '23 to 465 in Sep '23, a reassuring sign concerning the I criteria. Its current Up/Down Volume Ratio of 1.5 is an unbiased indication its shares have been under accumulation over the past 50 days.
|
|
|
Color Codes Explained :
Y - Better candidates highlighted by our
staff of experts.
G - Previously featured
in past reports as yellow but may no longer be buyable under the
guidelines.
***Last / Change / Volume data in this table is the closing quote data***
Symbol/Exchange
Company Name
Industry Group |
PRICE |
CHANGE
(%Change) |
Day High |
Volume
(% DAV)
(% 50 day avg vol) |
52 Wk Hi
% From Hi |
Featured
Date |
Price
Featured |
Pivot Featured |
|
Max Buy |
 ANET
-
NYSE
ANET
-
NYSE
Arista Networks
Computer-Networking
|
$235.34
|
+2.18
0.93% |
$236.65
|
1,909,060
85.92% of 50 DAV
50 DAV is 2,222,000
|
$240.01
-1.95%
|
10/31/2023
|
$188.84
|
PP = $198.80
|
|
MB = $208.74
|
 Most Recent Note - 12/21/2023 5:00:28 PM
G - Hovering near its all-time high, extended from any sound base. Its 50 DMA line ($210.52) defines near-term support above prior highs in the $198 area. Fundamentals remain strong.
>>> FEATURED STOCK ARTICLE : Made Gradual Progress Since Latest Breakout - 12/6/2023 |
View all notes |
Set NEW NOTE alert |
Company Profile |
SEC
News |
Chart |
Request a new note
C
A
S
I |
NVO
-
NYSE
Novo Nordisk ADR
Medical-Ethical Drugs
|
$103.48
|
+2.17
2.14% |
$103.48
|
3,336,376
69.42% of 50 DAV
50 DAV is 4,806,000
|
$105.69
-2.09%
|
11/2/2023
|
$100.97
|
PP = $104.10
|
|
MB = $109.31
|
Most Recent Note - 12/21/2023 4:58:05 PM
Y - Posted a 4th consecutive gain today, wedging further above its 50 DMA line ($99.59) toward its high. Its 50 DMA line defines initial support above the recent low ($94.73 on 12/11/23) on pullbacks.
>>> FEATURED STOCK ARTICLE : Managed a "Positive Reversal" but Still Below 50-Day Moving Average - 12/11/2023 |
View all notes |
Set NEW NOTE alert |
Company Profile |
SEC
News |
Chart |
Request a new note
C
A
S
I |
QLYS
-
NASDAQ
Qualys
Computer Sftwr-Security
|
$203.53
|
+1.65
0.82% |
$205.27
|
206,751
53.56% of 50 DAV
50 DAV is 386,000
|
$206.35
-1.37%
|
11/3/2023
|
$167.50
|
PP = $165.03
|
|
MB = $173.28
|
Most Recent Note - 12/20/2023 5:10:26 PM
G - Pulled back today breaking a streak of 10 consecutive gains for new all-time highs. It is very extended from any sound base. Its 50 DMA line ($174) defines initial support to watch on pullbacks above the prior high ($165).
>>> FEATURED STOCK ARTICLE : Extended From Base Following Big Breakout - 12/12/2023 |
View all notes |
Set NEW NOTE alert |
Company Profile |
SEC
News |
Chart |
Request a new note
C
A
S
I |
AXON
-
NASDAQ
Axon Enterprise
Security/Sfty
|
$256.84
|
+4.07
1.61% |
$257.68
|
310,662
67.54% of 50 DAV
50 DAV is 460,000
|
$260.35
-1.35%
|
11/8/2023
|
$127.84
|
PP = $223.30
|
|
MB = $234.47
|
Most Recent Note - 12/21/2023 5:01:37 PM
G - Posted a gain today with lighter volume for a best-ever close. On pullbacks, the prior highs in the $229-231 area define near-term support to watch above its 50-day moving average (DMA) line ($225.62).
>>> FEATURED STOCK ARTICLE : Axon Enterprise Hits New High With 6th Straight Gain - 12/13/2023 |
View all notes |
Set NEW NOTE alert |
Company Profile |
SEC
News |
Chart |
Request a new note
C
A
S
I |
TDG
-
NYSE
TransDigm Group
Aerospace/Defense
|
$994.12
|
+12.48
1.27% |
$995.02
|
139,281
59.52% of 50 DAV
50 DAV is 234,000
|
$1,015.72
-2.13%
|
12/12/2023
|
$1,000.39
|
PP = $1,013.18
|
|
MB = $1,063.84
|
Most Recent Note - 12/19/2023 5:18:55 PM
Y - Posted a 2nd consecutive gain backed by light volume following 2 volume-driven losses. The new pivot point cited was based on its 11/14/23 high plus 10 cents, however, gains above the pivot point were not backed by the +40% above-average volume necessary to trigger a proper new technical buy signal. Fundamentals remain strong. Recent lows in the $950 area define near-term support to watch on pullbacks.
>>> FEATURED STOCK ARTICLE : Volume-Driven Loss Breaks Streak of 6 Straight Gains - 12/14/2023 |
View all notes |
Set NEW NOTE alert |
Company Profile |
SEC
News |
Chart |
Request a new note
C
A
S
I |
Symbol/Exchange
Company Name
Industry Group |
PRICE |
CHANGE
(%Change) |
Day High |
Volume
(% DAV)
(% 50 day avg vol) |
52 Wk Hi
% From Hi |
Featured
Date |
Price
Featured |
Pivot Featured |
|
Max Buy |
PANW
-
NASDAQ
Palo Alto Networks
Computer Sftwr-Security
|
$299.40
|
-1.58
-0.52% |
$304.11
|
2,874,648
64.57% of 50 DAV
50 DAV is 4,452,000
|
$318.00
-5.85%
|
11/13/2023
|
$255.90
|
PP = $266.00
|
|
MB = $279.30
|
Most Recent Note - 12/20/2023 5:09:00 PM
G - Volume totals have been cooling while consolidating near its all-time high. Prior highs in the $265 area define important support to watch along with its 50 DMA line ($267). Fundamentals remain strong.
>>> FEATURED STOCK ARTICLE : Consolidating After Volume-Driven Gains for All-Time Highs - 12/15/2023 |
View all notes |
Set NEW NOTE alert |
Company Profile |
SEC
News |
Chart |
Request a new note
C
A
S
I |
URI
-
NYSE
United Rentals
Comml Svcs-Leasing
|
$570.95
|
+12.68
2.27% |
$571.45
|
430,308
52.86% of 50 DAV
50 DAV is 814,000
|
$582.63
-2.00%
|
12/1/2023
|
$499.51
|
PP = $488.73
|
|
MB = $513.17
|
Most Recent Note - 12/21/2023 4:59:10 PM
G - Posted a gain today with below-average volume, hovering near its all-time high. On pullbacks, the prior highs define near-term support to watch above its 50 DMA line ($467).
>>> FEATURED STOCK ARTICLE : Perched Near All-Time High Following Volume-Driven Gains - 12/19/2023 |
View all notes |
Set NEW NOTE alert |
Company Profile |
SEC
News |
Chart |
Request a new note
C
A
S
I |
AMPH
-
NASDAQ
Amphastar Pharm
Medical-Biomed/Biotech
|
$59.96
|
+1.43
2.44% |
$59.97
|
201,941
48.08% of 50 DAV
50 DAV is 420,000
|
$67.66
-11.38%
|
12/4/2023
|
$60.84
|
PP = $58.35
|
|
MB = $61.27
|
Most Recent Note - 12/21/2023 4:55:41 PM
Y - Posted a gain with light volume today. It is above the pivot point cited based on its 11/21/23 high after a cup-with-handle base. Volume totals have been cooling while consolidating. Little resistance remains due to overhead supply. Fundamentals remain strong. See the latest FSU analysis for more details and a new annotated graph.
>>> FEATURED STOCK ARTICLE : Consolidating Above Pivot Point With Volume Cooling - 12/21/2023 |
View all notes |
Set NEW NOTE alert |
Company Profile |
SEC
News |
Chart |
Request a new note
C
A
S
I |
TBBK
-
NASDAQ
The Bancorp
Banks-Northeast
|
$40.07
|
-0.46
-1.13% |
$41.30
|
688,487
161.62% of 50 DAV
50 DAV is 426,000
|
$42.46
-5.63%
|
12/4/2023
|
$39.88
|
PP = $41.62
|
|
MB = $43.70
|
Most Recent Note - 12/20/2023 5:12:13 PM
Y - There was a "negative reversal" today after hitting a new all-time high and it closed back below its pivot point raising concerns. Subsequent gains and a strong close above the pivot point backed by at least +40% above average volume may trigger a proper technical buy signal.
>>> FEATURED STOCK ARTICLE : The Bancorp is Perched Near High with Strong Fundamentals - 12/5/2023 |
View all notes |
Set NEW NOTE alert |
Company Profile |
SEC
News |
Chart |
Request a new note
C
A
S
I |
LULU
-
NASDAQ
lululemon athletica
Retail-Apparel/Shoes/Acc
|
$511.03
|
+5.88
1.16% |
$511.27
|
872,997
36.12% of 50 DAV
50 DAV is 2,417,000
|
$511.60
-0.11%
|
12/8/2023
|
$490.61
|
PP = $485.93
|
|
MB = $510.23
|
Most Recent Note - 12/19/2023 5:20:03 PM
Y - Posted a gain today with below-average volume for a best-ever close as it hit a new all-time high. Its 2021 high of $485 defines initial support to watch after its recent breakout from a 2+ year base.
>>> FEATURED STOCK ARTICLE : Lululemon Breaks Out to New All-Time High - 12/8/2023 |
View all notes |
Set NEW NOTE alert |
Company Profile |
SEC
News |
Chart |
Request a new note
C
A
S
I |
Symbol/Exchange
Company Name
Industry Group |
PRICE |
CHANGE
(%Change) |
Day High |
Volume
(% DAV)
(% 50 day avg vol) |
52 Wk Hi
% From Hi |
Featured
Date |
Price
Featured |
Pivot Featured |
|
Max Buy |
|
|
|
THESE ARE NOT BUY RECOMMENDATIONS!
Comments contained in the body of this report are technical
opinions only. The material herein has been obtained
from sources believed to be reliable and accurate, however,
its accuracy and completeness cannot be guaranteed.
This site is not an investment advisor, hence it does
not endorse or recommend any securities or other investments.
Any recommendation contained in this report may not
be suitable for all investors and it is not to be deemed
an offer or solicitation on our part with respect to
the purchase or sale of any securities. All trademarks,
service marks and trade names appearing in this report
are the property of their respective owners, and are
likewise used for identification purposes only.
This report is a service available
only to active Paid Premium Members.
You may opt-out of receiving report notifications
at any time. Questions or comments may be submitted
by writing to Premium Membership Services 665 S.E. 10 Street, Suite 201 Deerfield Beach, FL 33441-5634 or by calling 1-800-965-8307
or 954-785-1121.
|
|
|