You are not logged in.
This means you
CAN ONLY VIEW reports that were published prior to Sunday, April 13, 2025.
You
MUST UPGRADE YOUR MEMBERSHIP if you want to see any current reports.
AFTER MARKET UPDATE - FRIDAY, DECEMBER 8TH, 2023
Previous After Market Report Next After Market Report >>>
|
|
|
|
DOW |
+130.49 |
36,247.87 |
+0.36% |
|
Volume |
883,078,020 |
-0% |
|
Volume |
5,474,105,000 |
-5% |
|
NASDAQ |
+63.98 |
14,403.97 |
+0.45% |
|
Advancers |
1,580 |
57% |
|
Advancers |
2,397 |
56% |
|
S&P 500 |
+18.78 |
4,604.37 |
+0.41% |
|
Decliners |
1,211 |
43% |
|
Decliners |
1,867 |
44% |
|
Russell 2000 |
+12.57 |
1,880.82 |
+0.67% |
|
52 Wk Highs |
97 |
|
|
52 Wk Highs |
146 |
|
|
S&P 600 |
+6.75 |
1,220.21 |
+0.56% |
|
52 Wk Lows |
20 |
|
|
52 Wk Lows |
112 |
|
|
 |
Leadership Improved as Major Indices Posted Gains
Kenneth J. Gruneisen - Passed the CAN SLIM® Master's Exam
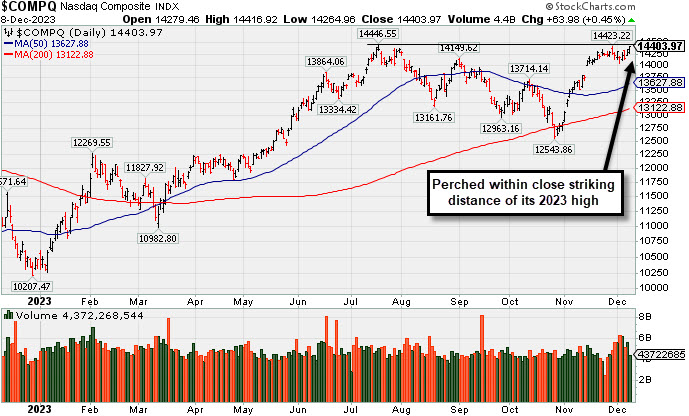
The S&P 500 (+0.4%) closed above the 4,600 for the first time since March 2022. The Dow Jones Industrial Average, Nasdaq Composite, and Russell 2000 registered gains of 0.4%, 0.5%, and 0.7%, respectively. Volume was reported near the prior session total on the NYSE and lighter on the Nasdaq exchange. Advancers led decliners by a 5-4 margin on the NYSE and by 4-3 on the Nasdaq exchange. There were 73 high-ranked companies from the Leaders List that hit new 52-week highs and were listed on the BreakOuts Page, more than doubling the total of 31 on the prior session. New 52-week highs totals outnumbered new 52-week lows on the NYSE and on the Nasdaq exchange. The major indices are in a confirmed uptrend (M criteria). New buying efforts should be only made in stocks fitting all key criteria of the fact-based investment system.
PICTURED: The Nasdaq Composite Index is perched within close striking distance of its 2023 high. Only four of the S&P 500 sectors fell. The energy sector (+1.1%) registered the largest gain as oil prices jumped 2.7% to $71.18/bbl. The consumer staples sector was the "worst" performer with a -0.7% decline. The 2-yr note yield climbed 17 basis points to 4.74%. The 10-yr note yield rose 12 basis points to 4.25%.
The November Employment Situation Report featured a 199,000 increase in nonfarm payrolls, a larger than expected 0.4% increase in average hourly earnings, and a drop in the unemployment rate to 3.7% from 3.9%. The preliminary University of Michigan Index of Consumer Sentiment for December climbed to 69.4 from the final reading of 61.3 for November. The spike in sentiment was aided by a large drop in year-ahead inflation expectations (to 3.1% from 4.5%) and five-year inflation expectations (to 2.8% from 3.2%).
|
 Kenneth J. Gruneisen started out as a licensed stockbroker in August 1987, a couple of months prior to the historic stock market crash that took the Dow Jones Industrial Average down -22.6% in a single day. He has published daily fact-based fundamental and technical analysis on high-ranked stocks online for two decades. Through FACTBASEDINVESTING.COM, Kenneth provides educational articles, news, market commentary, and other information regarding proven investment systems that work in good times and bad.
Comments contained in the body of this report are technical opinions only and are not necessarily those of Gruneisen Growth Corp. The material herein has been obtained from sources believed to be reliable and accurate, however, its accuracy and completeness cannot be guaranteed. Our firm, employees, and customers may effect transactions, including transactions contrary to any recommendation herein, or have positions in the securities mentioned herein or options with respect thereto. Any recommendation contained in this report may not be suitable for all investors and it is not to be deemed an offer or solicitation on our part with respect to the purchase or sale of any securities. |
|
 |
Financial, Networking, Semiconductor, and Energy Indexes Rose
Kenneth J. Gruneisen - Passed the CAN SLIM® Master's Exam
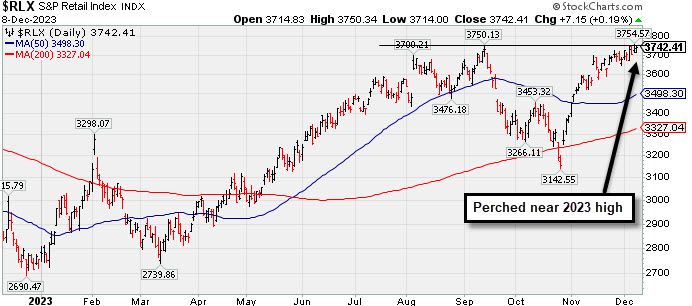
The Bank Index ($BKX +1.35%) and the Broker/Dealer Index ($XBD +1.51%) both posted solid gains while the Retail Index ($RLX +0.19%) inched higher. The tech sector was mixed as the Biotech Index ($BTK -0.92%) fell while the Networking Index ($NWX +1.06%) and the Semiconductor Index ($SOX +0.71%) each posted gains. Commodity-linked groups were mixed as the Integrated Oil Index ($XOI +1.16%) and Oil Services Index ($OSX +1.46%) both posted gains while the Gold & Silver Index ($XAU -1.19%) lost ground.
PICTURED: The Retail Index ($RLX +0.19%) inched higher and is perched at its 2023 high.
| Oil Services |
$OSX |
79.01 |
+1.14 |
+1.46% |
-5.78% |
| Integrated Oil |
$XOI |
1,791.36 |
+20.52 |
+1.16% |
+0.23% |
| Semiconductor |
$SOX |
3,774.17 |
+26.63 |
+0.71% |
+49.05% |
| Networking |
$NWX |
760.70 |
+7.98 |
+1.06% |
-2.89% |
| Broker/Dealer |
$XBD |
519.67 |
+7.71 |
+1.51% |
+15.71% |
| Retail |
$RLX |
3,742.41 |
+7.15 |
+0.19% |
+35.89% |
| Gold & Silver |
$XAU |
118.09 |
-1.42 |
-1.19% |
-2.29% |
| Bank |
$BKX |
88.63 |
+1.18 |
+1.35% |
-12.11% |
| Biotech |
$BTK |
4,956.27 |
-46.03 |
-0.92% |
-6.15% |
|
|
|
 |
Lululemon Breaks Out to New All-Time High
Kenneth J. Gruneisen - Passed the CAN SLIM® Master's Exam
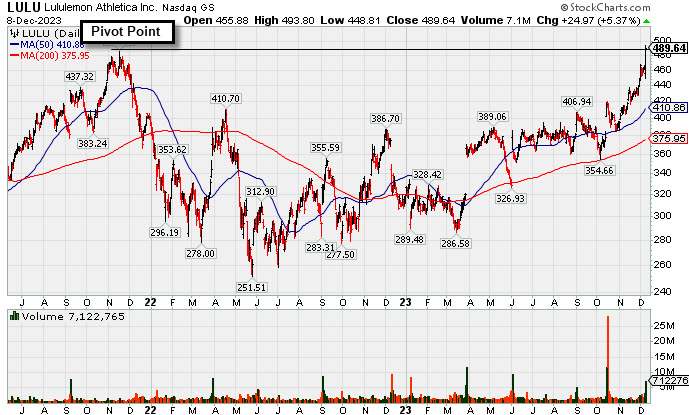
Lululemon Athletica (LULU +$24.97 or +5.37% to $489.64) was highlighted in yellow in the earlier mid-day report (read here) with pivot point cited based on its Nov '21 high plus 10 cents. It hit new 52-week and all-time highs with today's considerable gain backed by +222% above average volume triggering a technical buy signal, rallying from a 2-year long base. Its 200 DMA line acted as support in recent months.
LULU reported Oct '23 quarterly earnings +27% on +19% sales revenues versus the year-ago period. Three of the 4 latest quarterly comparisons were above the +25% minimum earnings guideline (C criteria). Annual earnings (A criteria) had a downturn in FY '21. It currently has a 98 Earnings Per Share Rating. Its Timeliness rating is A and Sponsorship rating is C. The current Up/Down Volume Ratio of 1.0 is an unbiased indication its shares have been neutral concerning accumulation/distribution over the past 50 days. The number of top-rated funds owning its shares rose from 2,100 in Mar '23 to 2,204 in Sep '23, a good sign concerning the I criteria. LULU was last shown in this FSU section with an annotated graph on 2/20/20 under the headline, "Perched at Record High After 4th Consecutive Gain on Light Volume". It then pulled back abruptly at the start of the pandemic but recovered and rallied impressively in the months that folllowed. LULU was first featured in yellow at $23.83 (split adjusted after 2:1 split effective 7/21/11) in the October 8, 2010 mid-day report (read here) and it traded up as much as +163.7% in a little more than 9 months. Charts courtesy of www.stockcharts.com
|
|
|
Color Codes Explained :
Y - Better candidates highlighted by our
staff of experts.
G - Previously featured
in past reports as yellow but may no longer be buyable under the
guidelines.
***Last / Change / Volume data in this table is the closing quote data***
Symbol/Exchange
Company Name
Industry Group |
PRICE |
CHANGE
(%Change) |
Day High |
Volume
(% DAV)
(% 50 day avg vol) |
52 Wk Hi
% From Hi |
Featured
Date |
Price
Featured |
Pivot Featured |
|
Max Buy |
 ANET
-
NYSE
ANET
-
NYSE
Arista Networks
Computer-Networking
|
$215.29
|
+1.89
0.89% |
$215.74
|
1,471,162
67.70% of 50 DAV
50 DAV is 2,173,000
|
$223.52
-3.68%
|
10/31/2023
|
$188.84
|
PP = $198.80
|
|
MB = $208.74
|
Most Recent Note - 12/6/2023 5:46:44 PM
G - Ended near the session low today with a small loss after an early gain. Prior highs in the $198 area define near-term support above its 50 DMA line ($201.28). Fundamentals remain strong. See the latest FSU analysis for more details and a new annotated graph.
>>> FEATURED STOCK ARTICLE : Made Gradual Progress Since Latest Breakout - 12/6/2023 |
View all notes |
Set NEW NOTE alert |
Company Profile |
SEC
News |
Chart |
Request a new note
C
A
S
I |
NVO
-
NYSE
Novo Nordisk ADR
Medical-Ethical Drugs
|
$96.81
|
-0.78
-0.80% |
$97.30
|
3,422,090
72.41% of 50 DAV
50 DAV is 4,726,000
|
$105.69
-8.40%
|
11/2/2023
|
$100.97
|
PP = $104.10
|
|
MB = $109.31
|
Most Recent Note - 12/6/2023 5:49:56 PM
G - Color code is changed to green as it slumped below its 50 DMA line ($98.09) with today's loss backed by light volume. A prompt rebound above the 50 DMA line is needed for its outlook to improve. It has been repeatedly noted - "Subsequent gains for new highs backed by at least +40% above average volume are needed to trigger a technical buy signal."
>>> FEATURED STOCK ARTICLE : Approaching Prior High With Strong Fundamentals - 11/2/2023 |
View all notes |
Set NEW NOTE alert |
Company Profile |
SEC
News |
Chart |
Request a new note
C
A
S
I |
QLYS
-
NASDAQ
Qualys
Computer Sftwr-Security
|
$186.53
|
+0.80
0.43% |
$187.32
|
421,274
118.00% of 50 DAV
50 DAV is 357,000
|
$188.65
-1.12%
|
11/3/2023
|
$167.50
|
PP = $165.03
|
|
MB = $173.28
|
Most Recent Note - 12/6/2023 5:44:24 PM
G - Volume was light today while hovering near all-time high. Prior high ($165) defines initial support to watch on pullbacks.
>>> FEATURED STOCK ARTICLE : Powerful Breakout for Qualys - 11/3/2023 |
View all notes |
Set NEW NOTE alert |
Company Profile |
SEC
News |
Chart |
Request a new note
C
A
S
I |
AXON
-
NASDAQ
Axon Enterprise
Security/Sfty
|
$235.27
|
+2.93
1.26% |
$235.98
|
305,362
66.67% of 50 DAV
50 DAV is 458,000
|
$236.38
-0.47%
|
11/8/2023
|
$127.84
|
PP = $223.30
|
|
MB = $234.47
|
Most Recent Note - 12/4/2023 6:25:11 PM
Y - Hit a new high as it posted a 3rd consecutive gain and closed near the session high. The recent low ($212.89 on 11/09/23) defines near-term support above its 50 DMA line ($213.63).
>>> FEATURED STOCK ARTICLE : Breakout for Axon as it Returns to Featured Stocks List - 11/8/2023 |
View all notes |
Set NEW NOTE alert |
Company Profile |
SEC
News |
Chart |
Request a new note
C
A
S
I |
TDG
-
NYSE
TransDigm Group
Aerospace/Defense
|
$972.96
|
+9.45
0.98% |
$976.00
|
207,452
85.02% of 50 DAV
50 DAV is 244,000
|
$1,013.08
-3.96%
|
11/9/2023
|
$982.68
|
PP = $940.10
|
|
MB = $987.11
|
Most Recent Note - 12/6/2023 5:48:01 PM
G - Volume totals have been cooling while consolidating in recent weeks after briefly trading above the $1,000 threshold. Fundamentals remain strong. Prior high ($940) defines initial support to watch on pullbacks.
>>> FEATURED STOCK ARTICLE : TransDigm's Big Gap Up Gain Triggered Technical Buy Signal - 11/9/2023 |
View all notes |
Set NEW NOTE alert |
Company Profile |
SEC
News |
Chart |
Request a new note
C
A
S
I |
Symbol/Exchange
Company Name
Industry Group |
PRICE |
CHANGE
(%Change) |
Day High |
Volume
(% DAV)
(% 50 day avg vol) |
52 Wk Hi
% From Hi |
Featured
Date |
Price
Featured |
Pivot Featured |
|
Max Buy |
PANW
-
NASDAQ
Palo Alto Networks
Computer Sftwr-Security
|
$293.61
|
+6.41
2.23% |
$294.37
|
4,305,113
105.83% of 50 DAV
50 DAV is 4,068,000
|
$296.85
-1.09%
|
11/13/2023
|
$255.90
|
PP = $266.00
|
|
MB = $279.30
|
Most Recent Note - 12/4/2023 6:26:34 PM
G - Pulled back today with lighter (near average) volume breaking a streak of 6 consecutive gains for new all-time highs. Prior highs in the $265 area define initial support to watch above its 50 DMA line ($252). Fundamentals remain strong after it reported Oct '23 quarterly earnings +66% on +20% sales revenues versus the year-ago period.
>>> FEATURED STOCK ARTICLE : Earnings New Due While Perched Near Prior High - 11/13/2023 |
View all notes |
Set NEW NOTE alert |
Company Profile |
SEC
News |
Chart |
Request a new note
C
A
S
I |
URI
-
NYSE
United Rentals
Comml Svcs-Leasing
|
$484.02
|
+7.58
1.59% |
$485.09
|
424,298
56.27% of 50 DAV
50 DAV is 754,000
|
$505.16
-4.18%
|
12/1/2023
|
$499.51
|
PP = $488.73
|
|
MB = $513.17
|
Most Recent Note - 12/6/2023 5:52:00 PM
Y - Pulled back after highlighted in yellow in the 12/01/23 mid-day report with new pivot point cited based on its 11/15/23 high after a cup-with-handle base. More damaging losses would raise greater concerns.
>>> FEATURED STOCK ARTICLE : New Breakout For United Rentals - 12/1/2023 |
View all notes |
Set NEW NOTE alert |
Company Profile |
SEC
News |
Chart |
Request a new note
C
A
S
I |
AMPH
-
NASDAQ
Amphastar Pharm
Medical-Biomed/Biotech
|
$57.03
|
-1.22
-2.09% |
$58.36
|
311,433
78.84% of 50 DAV
50 DAV is 395,000
|
$67.66
-15.71%
|
12/4/2023
|
$60.84
|
PP = $58.35
|
|
MB = $61.27
|
Most Recent Note - 12/4/2023 12:29:09 PM
Y - Color code is changed to yellow with pivot point cited based on its 11/21/23 high after a cup-with-handle base. Rebounding toward its August all-time high, little resistance remains due to overhead supply. A gain and strong close above the pivot point backed by at least +40% above average volume may trigger a proper new technical buy signal. Fundamentals remain strong after it reported Sep '23 quarterly earnings +203% on +50% sales revenues versus the year-ago period. Found support at its 200 DMA line during its consolidation after dropped from the Featured Stocks list on 9/08/23.
>>> FEATURED STOCK ARTICLE : Amphastar Pharm on Track for 7th Weekly Gain - 12/4/2023 |
View all notes |
Set NEW NOTE alert |
Company Profile |
SEC
News |
Chart |
Request a new note
C
A
S
I |
TBBK
-
NASDAQ
The Bancorp
Banks-Northeast
|
$39.87
|
+0.94
2.41% |
$39.88
|
678,750
187.50% of 50 DAV
50 DAV is 362,000
|
$41.52
-3.97%
|
12/4/2023
|
$39.88
|
PP = $41.62
|
|
MB = $43.70
|
 Most Recent Note - 12/7/2023 12:49:48 PM
Y - Managed a "positive reversal" today after early weakness. Pivot point cited was based on its 7/27/23 high plus 10 cents. Subsequent gains above the pivot point backed by at least +40% above average volume may trigger a technical buy signal. The 4 latest quarterly comparisons through Sep '23 had earnings increases above the +25% minimum guideline (C criteria) versus the year ago period. Annual earnings history has been strong. See the latest FSU analysis for more details and an annotated graph.
>>> FEATURED STOCK ARTICLE : The Bancorp is Perched Near High with Strong Fundamentals - 12/5/2023 |
View all notes |
Set NEW NOTE alert |
Company Profile |
SEC
News |
Chart |
Request a new note
C
A
S
I |
|
|
|
THESE ARE NOT BUY RECOMMENDATIONS!
Comments contained in the body of this report are technical
opinions only. The material herein has been obtained
from sources believed to be reliable and accurate, however,
its accuracy and completeness cannot be guaranteed.
This site is not an investment advisor, hence it does
not endorse or recommend any securities or other investments.
Any recommendation contained in this report may not
be suitable for all investors and it is not to be deemed
an offer or solicitation on our part with respect to
the purchase or sale of any securities. All trademarks,
service marks and trade names appearing in this report
are the property of their respective owners, and are
likewise used for identification purposes only.
This report is a service available
only to active Paid Premium Members.
You may opt-out of receiving report notifications
at any time. Questions or comments may be submitted
by writing to Premium Membership Services 665 S.E. 10 Street, Suite 201 Deerfield Beach, FL 33441-5634 or by calling 1-800-965-8307
or 954-785-1121.
|
|
|