You are not logged in.
This means you
CAN ONLY VIEW reports that were published prior to Wednesday, April 9, 2025.
You
MUST UPGRADE YOUR MEMBERSHIP if you want to see any current reports.
AFTER MARKET UPDATE - WEDNESDAY, DECEMBER 20TH, 2023
Previous After Market Report Next After Market Report >>>
|
|
|
|
DOW |
-475.92 |
37,082.00 |
-1.27% |
|
Volume |
1,026,089,822 |
+2% |
|
Volume |
6,331,613,500 |
+10% |
|
NASDAQ |
-225.28 |
14,777.94 |
-1.50% |
|
Advancers |
630 |
23% |
|
Advancers |
1,301 |
30% |
|
S&P 500 |
-70.02 |
4,698.35 |
-1.47% |
|
Decliners |
2,151 |
77% |
|
Decliners |
3,019 |
70% |
|
Russell 2000 |
-38.12 |
1,982.84 |
-1.89% |
|
52 Wk Highs |
287 |
|
|
52 Wk Highs |
464 |
|
|
S&P 600 |
-22.76 |
1,291.48 |
-1.73% |
|
52 Wk Lows |
27 |
|
|
52 Wk Lows |
172 |
|
|
 |
Major Indices Reversed Early Gains to Close Lower
Kenneth J. Gruneisen - Passed the CAN SLIM® Master's Exam
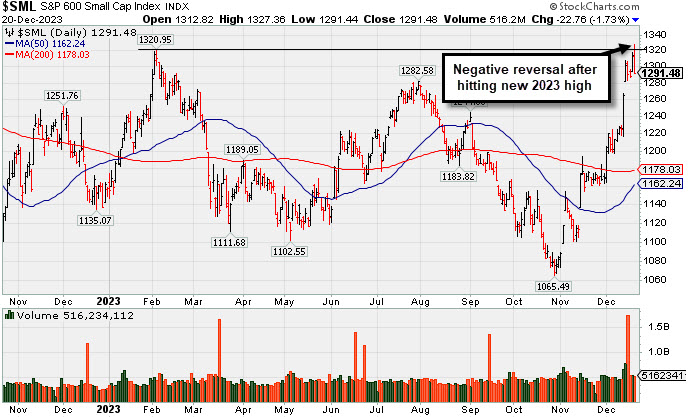
There was a "negative reversal" on Wednesday as the major indices erased gains to finish the session near their worst levels with losses ranging from -1.3% to -1.9%. Volume was reported higher than the prior session totals on the NYSE and on the Nasdaq exchange. Breadth was negative as decliners led advancers by more than a 3-1 margin on the NYSE and more than 2-1 on the Nasdaq exchange. There were 123 high-ranked companies from the Leaders List that hit new 52-week highs and were listed on the BreakOuts Page, versus the total of 132 on the prior session. New 52-week highs totals expanded and solidly outnumbered new 52-week lows totals on the NYSE and on the Nasdaq exchange. The major indices are in a confirmed uptrend (M criteria). New buying efforts should be only made in stocks fitting all key criteria of the fact-based investment system.
PICTURED: The S&P 600 Small Cap Index reversed after briefly hitting a new 2023 high. The only S&P 500 sector that declined less than -1.0% was communication services (-0.1%). Alphabet (GOOG +1.1%) was a positive influence after a report from The Information that it is aiming to reorganize its advertising sales unit. The consumer staples (-2.0%) and utilities (-2.0%) sectors saw the steepest declines. The industrial sector fell -1.6% while there was a big loss in FedEx (FDX -12.1%) following its disappointing FY24 revenue guidance.
The 2-yr note yield fell ten basis points to 4.35% and the 10-yr note yield declined four basis points to 3.88%. Geopolitical angst was a part of the market narrative and contributed to buying interest in Treasuries. Bloomberg reported that the U.S. and its allies are considering strikes against Houthi rebels in Yemen following their disruption of Red Sea shipping activity.
|
 Kenneth J. Gruneisen started out as a licensed stockbroker in August 1987, a couple of months prior to the historic stock market crash that took the Dow Jones Industrial Average down -22.6% in a single day. He has published daily fact-based fundamental and technical analysis on high-ranked stocks online for two decades. Through FACTBASEDINVESTING.COM, Kenneth provides educational articles, news, market commentary, and other information regarding proven investment systems that work in good times and bad.
Comments contained in the body of this report are technical opinions only and are not necessarily those of Gruneisen Growth Corp. The material herein has been obtained from sources believed to be reliable and accurate, however, its accuracy and completeness cannot be guaranteed. Our firm, employees, and customers may effect transactions, including transactions contrary to any recommendation herein, or have positions in the securities mentioned herein or options with respect thereto. Any recommendation contained in this report may not be suitable for all investors and it is not to be deemed an offer or solicitation on our part with respect to the purchase or sale of any securities. |
|
 |
Tech, Retail, Financial, and Commodity-Linked Groups Fell
Kenneth J. Gruneisen - Passed the CAN SLIM® Master's Exam
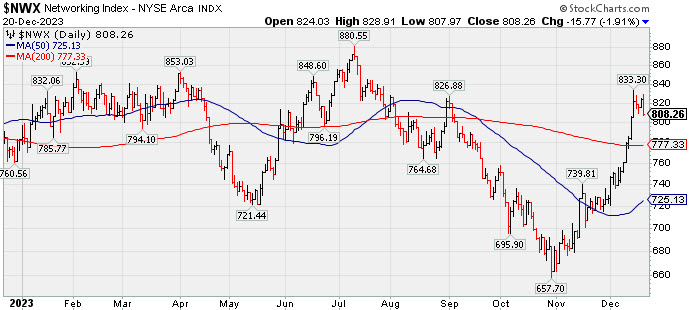
The Broker/Dealer Index ($XBD -1.72%), Bank Index ($BKX -2.17%), and the Retail Index ($RLX -1.18%) each lost ground on Wednesday. The tech sector had a negative bias as the Biotech Index ($BTK -3.35%), Networking Index ($NWX -1.91%), and the Semiconductor Index ($SOX -2.86%) each lost ground. Commodity-linked groups also had a negative bias as the Gold & Silver Index ($XAU -2.23%) outpaced the Integrated Oil Index ($XOI -0.75%) and the Oil Services Index ($OSX -0.80%) to the downside.
PICTURED: The Networking Index ($NWX -1.91%) is consolidating after rebounding above its 200-day moving average (DMA) line.
| Oil Services |
$OSX |
84.49 |
-0.68 |
-0.80% |
+0.75% |
| Integrated Oil |
$XOI |
1,874.70 |
-14.11 |
-0.75% |
+4.89% |
| Semiconductor |
$SOX |
4,007.66 |
-117.90 |
-2.86% |
+58.27% |
| Networking |
$NWX |
808.26 |
-15.77 |
-1.91% |
+3.18% |
| Broker/Dealer |
$XBD |
542.32 |
-9.51 |
-1.72% |
+20.75% |
| Retail |
$RLX |
3,880.80 |
-46.38 |
-1.18% |
+40.92% |
| Gold & Silver |
$XAU |
124.90 |
-2.85 |
-2.23% |
+3.34% |
| Bank |
$BKX |
94.03 |
-2.08 |
-2.17% |
-6.76% |
| Biotech |
$BTK |
5,183.61 |
-179.90 |
-3.35% |
-1.85% |
|
|
|
 |
Featured Stocks
Kenneth J. Gruneisen - Passed the CAN SLIM® Master's Exam
|
|
|
Color Codes Explained :
Y - Better candidates highlighted by our
staff of experts.
G - Previously featured
in past reports as yellow but may no longer be buyable under the
guidelines.
***Last / Change / Volume data in this table is the closing quote data***
Symbol/Exchange
Company Name
Industry Group |
PRICE |
CHANGE
(%Change) |
Day High |
Volume
(% DAV)
(% 50 day avg vol) |
52 Wk Hi
% From Hi |
Featured
Date |
Price
Featured |
Pivot Featured |
|
Max Buy |
 ANET
-
NYSE
ANET
-
NYSE
Arista Networks
Computer-Networking
|
$233.16
|
-3.54
-1.50% |
$237.72
|
1,545,602
69.50% of 50 DAV
50 DAV is 2,224,000
|
$240.01
-2.85%
|
10/31/2023
|
$188.84
|
PP = $198.80
|
|
MB = $208.74
|
Most Recent Note - 12/18/2023 7:28:06 PM
G - Hit another new all-time high with lighter volume behind today's 3rd consecutive gain. It is extended from any sound base. Its 50 DMA line ($208) defines near-term support above prior highs in the $198 area. Fundamentals remain strong.
>>> FEATURED STOCK ARTICLE : Made Gradual Progress Since Latest Breakout - 12/6/2023 |
View all notes |
Set NEW NOTE alert |
Company Profile |
SEC
News |
Chart |
Request a new note
C
A
S
I |
NVO
-
NYSE
Novo Nordisk ADR
Medical-Ethical Drugs
|
$101.31
|
+1.32
1.32% |
$102.87
|
4,782,978
100.29% of 50 DAV
50 DAV is 4,769,000
|
$105.69
-4.14%
|
11/2/2023
|
$100.97
|
PP = $104.10
|
|
MB = $109.31
|
Most Recent Note - 12/18/2023 7:24:56 PM
Y - Gapped up today and closed the session near its 50 DMA line ($99.17). Recent low ($94.73 on 12/11/23) defines important near-term support to watch on pullbacks.
>>> FEATURED STOCK ARTICLE : Managed a "Positive Reversal" but Still Below 50-Day Moving Average - 12/11/2023 |
View all notes |
Set NEW NOTE alert |
Company Profile |
SEC
News |
Chart |
Request a new note
C
A
S
I |
QLYS
-
NASDAQ
Qualys
Computer Sftwr-Security
|
$201.88
|
-4.01
-1.95% |
$206.27
|
312,153
80.45% of 50 DAV
50 DAV is 388,000
|
$206.35
-2.17%
|
11/3/2023
|
$167.50
|
PP = $165.03
|
|
MB = $173.28
|
 Most Recent Note - 12/20/2023 5:10:26 PM
G - Pulled back today breaking a streak of 10 consecutive gains for new all-time highs. It is very extended from any sound base. Its 50 DMA line ($174) defines initial support to watch on pullbacks above the prior high ($165).
>>> FEATURED STOCK ARTICLE : Extended From Base Following Big Breakout - 12/12/2023 |
View all notes |
Set NEW NOTE alert |
Company Profile |
SEC
News |
Chart |
Request a new note
C
A
S
I |
AXON
-
NASDAQ
Axon Enterprise
Security/Sfty
|
$252.74
|
-3.18
-1.24% |
$257.65
|
559,844
121.71% of 50 DAV
50 DAV is 460,000
|
$260.35
-2.92%
|
11/8/2023
|
$127.84
|
PP = $223.30
|
|
MB = $234.47
|
Most Recent Note - 12/18/2023 7:30:03 PM
G - Ended near the session high with a small loss today on lighter volume following 8 consecutive gains marked by ever-increasing volume as it rallied to new highs. On pullbacks, the prior highs in the $229-231 area define near-term support to watch above its 50-day moving average (DMA) line ($223.20).
>>> FEATURED STOCK ARTICLE : Axon Enterprise Hits New High With 6th Straight Gain - 12/13/2023 |
View all notes |
Set NEW NOTE alert |
Company Profile |
SEC
News |
Chart |
Request a new note
C
A
S
I |
TDG
-
NYSE
TransDigm Group
Aerospace/Defense
|
$981.64
|
-16.75
-1.68% |
$995.81
|
140,975
59.74% of 50 DAV
50 DAV is 236,000
|
$1,015.72
-3.36%
|
12/12/2023
|
$1,000.39
|
PP = $1,013.18
|
|
MB = $1,063.84
|
Most Recent Note - 12/19/2023 5:18:55 PM
Y - Posted a 2nd consecutive gain backed by light volume following 2 volume-driven losses. The new pivot point cited was based on its 11/14/23 high plus 10 cents, however, gains above the pivot point were not backed by the +40% above-average volume necessary to trigger a proper new technical buy signal. Fundamentals remain strong. Recent lows in the $950 area define near-term support to watch on pullbacks.
>>> FEATURED STOCK ARTICLE : Volume-Driven Loss Breaks Streak of 6 Straight Gains - 12/14/2023 |
View all notes |
Set NEW NOTE alert |
Company Profile |
SEC
News |
Chart |
Request a new note
C
A
S
I |
Symbol/Exchange
Company Name
Industry Group |
PRICE |
CHANGE
(%Change) |
Day High |
Volume
(% DAV)
(% 50 day avg vol) |
52 Wk Hi
% From Hi |
Featured
Date |
Price
Featured |
Pivot Featured |
|
Max Buy |
PANW
-
NASDAQ
Palo Alto Networks
Computer Sftwr-Security
|
$300.98
|
-7.63
-2.47% |
$308.00
|
3,329,595
74.72% of 50 DAV
50 DAV is 4,456,000
|
$318.00
-5.35%
|
11/13/2023
|
$255.90
|
PP = $266.00
|
|
MB = $279.30
|
Most Recent Note - 12/20/2023 5:09:00 PM
G - Volume totals have been cooling while consolidating near its all-time high. Prior highs in the $265 area define important support to watch along with its 50 DMA line ($267). Fundamentals remain strong.
>>> FEATURED STOCK ARTICLE : Consolidating After Volume-Driven Gains for All-Time Highs - 12/15/2023 |
View all notes |
Set NEW NOTE alert |
Company Profile |
SEC
News |
Chart |
Request a new note
C
A
S
I |
URI
-
NYSE
United Rentals
Comml Svcs-Leasing
|
$558.27
|
-15.93
-2.77% |
$578.20
|
1,272,078
158.61% of 50 DAV
50 DAV is 802,000
|
$582.63
-4.18%
|
12/1/2023
|
$499.51
|
PP = $488.73
|
|
MB = $513.17
|
Most Recent Note - 12/20/2023 5:13:48 PM
G - Pulled back today with above-average volume, retreating from a new all-time high. On pullbacks, the prior highs define near-term support to watch above its 50 DMA line ($464.73).
>>> FEATURED STOCK ARTICLE : Perched Near All-Time High Following Volume-Driven Gains - 12/19/2023 |
View all notes |
Set NEW NOTE alert |
Company Profile |
SEC
News |
Chart |
Request a new note
C
A
S
I |
AMPH
-
NASDAQ
Amphastar Pharm
Medical-Biomed/Biotech
|
$58.53
|
-1.93
-3.19% |
$60.72
|
305,911
72.66% of 50 DAV
50 DAV is 421,000
|
$67.66
-13.49%
|
12/4/2023
|
$60.84
|
PP = $58.35
|
|
MB = $61.27
|
Most Recent Note - 12/20/2023 5:15:31 PM
Y - Volume totals have been cooling while consolidating and it closed today just above the pivot point cited based on its 11/21/23 high after a cup-with-handle base. Little resistance remains due to overhead supply. Fundamentals remain strong.
>>> FEATURED STOCK ARTICLE : Amphastar Pharm on Track for 7th Weekly Gain - 12/4/2023 |
View all notes |
Set NEW NOTE alert |
Company Profile |
SEC
News |
Chart |
Request a new note
C
A
S
I |
TBBK
-
NASDAQ
The Bancorp
Banks-Northeast
|
$40.53
|
-1.42
-3.38% |
$42.46
|
446,460
106.05% of 50 DAV
50 DAV is 421,000
|
$42.27
-4.12%
|
12/4/2023
|
$39.88
|
PP = $41.62
|
|
MB = $43.70
|
Most Recent Note - 12/20/2023 5:12:13 PM
Y - There was a "negative reversal" today after hitting a new all-time high and it closed back below its pivot point raising concerns. Subsequent gains and a strong close above the pivot point backed by at least +40% above average volume may trigger a proper technical buy signal.
>>> FEATURED STOCK ARTICLE : The Bancorp is Perched Near High with Strong Fundamentals - 12/5/2023 |
View all notes |
Set NEW NOTE alert |
Company Profile |
SEC
News |
Chart |
Request a new note
C
A
S
I |
LULU
-
NASDAQ
lululemon athletica
Retail-Apparel/Shoes/Acc
|
$505.15
|
-1.71
-0.34% |
$511.60
|
1,059,021
43.76% of 50 DAV
50 DAV is 2,420,000
|
$509.33
-0.82%
|
12/8/2023
|
$490.61
|
PP = $485.93
|
|
MB = $510.23
|
Most Recent Note - 12/19/2023 5:20:03 PM
Y - Posted a gain today with below-average volume for a best-ever close as it hit a new all-time high. Its 2021 high of $485 defines initial support to watch after its recent breakout from a 2+ year base.
>>> FEATURED STOCK ARTICLE : Lululemon Breaks Out to New All-Time High - 12/8/2023 |
View all notes |
Set NEW NOTE alert |
Company Profile |
SEC
News |
Chart |
Request a new note
C
A
S
I |
Symbol/Exchange
Company Name
Industry Group |
PRICE |
CHANGE
(%Change) |
Day High |
Volume
(% DAV)
(% 50 day avg vol) |
52 Wk Hi
% From Hi |
Featured
Date |
Price
Featured |
Pivot Featured |
|
Max Buy |
|
|
|
THESE ARE NOT BUY RECOMMENDATIONS!
Comments contained in the body of this report are technical
opinions only. The material herein has been obtained
from sources believed to be reliable and accurate, however,
its accuracy and completeness cannot be guaranteed.
This site is not an investment advisor, hence it does
not endorse or recommend any securities or other investments.
Any recommendation contained in this report may not
be suitable for all investors and it is not to be deemed
an offer or solicitation on our part with respect to
the purchase or sale of any securities. All trademarks,
service marks and trade names appearing in this report
are the property of their respective owners, and are
likewise used for identification purposes only.
This report is a service available
only to active Paid Premium Members.
You may opt-out of receiving report notifications
at any time. Questions or comments may be submitted
by writing to Premium Membership Services 665 S.E. 10 Street, Suite 201 Deerfield Beach, FL 33441-5634 or by calling 1-800-965-8307
or 954-785-1121.
|
|
|