You are not logged in.
This means you
CAN ONLY VIEW reports that were published prior to Thursday, March 20, 2025.
You
MUST UPGRADE YOUR MEMBERSHIP if you want to see any current reports.
AFTER MARKET UPDATE - TUESDAY, DECEMBER 5TH, 2023
Previous After Market Report Next After Market Report >>>
|
|
|
|
DOW |
-79.88 |
36,124.56 |
-0.22% |
|
Volume |
910,182,916 |
-11% |
|
Volume |
6,239,990,000 |
-3% |
|
NASDAQ |
+44.42 |
14,229.91 |
+0.31% |
|
Advancers |
843 |
30% |
|
Advancers |
1,437 |
34% |
|
S&P 500 |
-2.60 |
4,567.18 |
-0.06% |
|
Decliners |
1,946 |
70% |
|
Decliners |
2,842 |
66% |
|
Russell 2000 |
-25.98 |
1,856.04 |
-1.38% |
|
52 Wk Highs |
101 |
|
|
52 Wk Highs |
117 |
|
|
S&P 600 |
-18.58 |
1,201.66 |
-1.52% |
|
52 Wk Lows |
16 |
|
|
52 Wk Lows |
98 |
|
|
 |
Major Indices Were Mixed as Leadership Thinned
Kenneth J. Gruneisen - Passed the CAN SLIM® Master's Exam
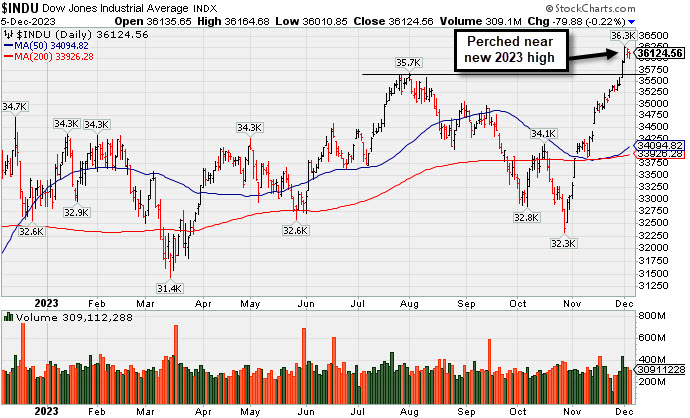
The Nasdaq Composite closed with a 0.3% gain; the S&P 500 registered a 0.1% decline; and the Dow Jones Industrial Average fell 0.2%. Volume was reported lower that the prior session total on the NYSE and on the Nasdaq exchange. Decliners led advancers by more than a 2-1 margin on the NYSE and nearly 2-1 on the Nasdaq exchange. There were 49 high-ranked companies from the Leaders List that hit new 52-week highs and were listed on the BreakOuts Page, versus the total of 93 on the prior session. New 52-week highs totals contracted yet still outnumbered new 52-week lows on the NYSE and on the Nasdaq exchange. The major indices are in a confirmed uptrend (M criteria). New buying efforts should be only made in stocks fitting all key criteria of the fact-based investment system.
PICTURED: The Dow Jones Industrial Average is perched near its 2023 high after recent gains. We the equal weighted S&P 500 closed down 0.9%. Worries about an economic slowdown caused small cap stocks to underperform their larger peers. The Russell 2000 closed with a -1.4% decline. Eight of the 11 S&P 500 sectors registered a decline while the information technology (+0.8%), consumer discretionary (+0.3%), and communication services (+0.2%) sectors, which all house mega cap constituents, closed with gains.
Concerns about global growth prospects weighed on sentiment. Moody's downgraded China's credit outlook to Negative from Stable. Meanwhile, the October JOLTS - Job Openings Report featured the lowest number of job openings (8.733 million) since March 2021. There was a slight uptick in the ISM Non-Manufacturing Index for November to 52.7% from 51.8%. The 2-yr note yield fell nine basis points to 4.56% and the 10-yr note yield declined 10 basis points to 4.18%.
|
 Kenneth J. Gruneisen started out as a licensed stockbroker in August 1987, a couple of months prior to the historic stock market crash that took the Dow Jones Industrial Average down -22.6% in a single day. He has published daily fact-based fundamental and technical analysis on high-ranked stocks online for two decades. Through FACTBASEDINVESTING.COM, Kenneth provides educational articles, news, market commentary, and other information regarding proven investment systems that work in good times and bad.
Comments contained in the body of this report are technical opinions only and are not necessarily those of Gruneisen Growth Corp. The material herein has been obtained from sources believed to be reliable and accurate, however, its accuracy and completeness cannot be guaranteed. Our firm, employees, and customers may effect transactions, including transactions contrary to any recommendation herein, or have positions in the securities mentioned herein or options with respect thereto. Any recommendation contained in this report may not be suitable for all investors and it is not to be deemed an offer or solicitation on our part with respect to the purchase or sale of any securities. |
|
 |
Retail and Broker/Dealer Indexes Eked Out Gains Amid Broader Losses
Kenneth J. Gruneisen - Passed the CAN SLIM® Master's Exam
The Bank Index ($BKX -1.14%) lost ground while the Broker/Dealer Index ($XBD +0.22%) edged higher and the Retail Index ($RLX +0.61%) posted a small gain.The tech sector had a negative bias as the Biotech Index ($BTK -0.66%), Networking Index ($NWX -1.50%), and the Semiconductor Index ($SOX -0.57%) each lost ground. Commodity-linked groups clearly had a negative bias as the Gold & Silver Index ($XAU -1.94%), Integrated Oil Index ($XOI -1.45%), and the Oil Servicesd Index ($OSX -2.31%) each lost ground.
PICTURED: The Semiconductor Index ($SOX -0.57%) is consolidating above its 50-day and 200-day moving average (DMA) lines after rebounding toward the July high.
| Oil Services |
$OSX |
80.52 |
-1.91 |
-2.31% |
-3.98% |
| Integrated Oil |
$XOI |
1,820.41 |
-26.84 |
-1.45% |
+1.86% |
| Semiconductor |
$SOX |
3,672.40 |
-21.05 |
-0.57% |
+45.03% |
| Networking |
$NWX |
739.35 |
-11.28 |
-1.50% |
-5.61% |
| Broker/Dealer |
$XBD |
506.50 |
+1.10 |
+0.22% |
+12.77% |
| Retail |
$RLX |
3,727.81 |
+22.65 |
+0.61% |
+35.36% |
| Gold & Silver |
$XAU |
120.08 |
-2.37 |
-1.94% |
-0.65% |
| Bank |
$BKX |
86.69 |
-1.00 |
-1.14% |
-14.05% |
| Biotech |
$BTK |
4,932.36 |
-32.52 |
-0.66% |
-6.60% |
|
|
|
 |
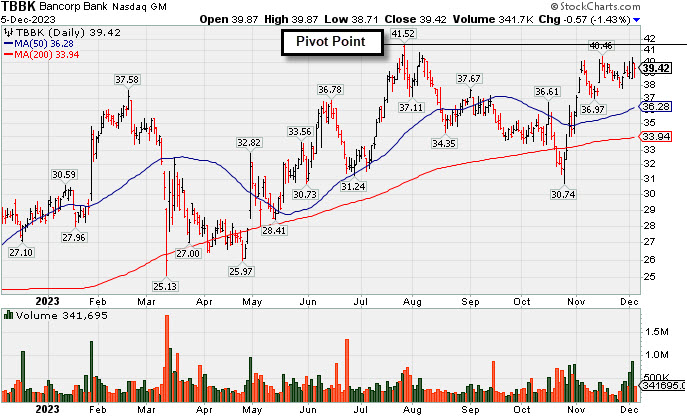
The Bancorp is Perched Near High with Strong Fundamentals
Kenneth J. Gruneisen - Passed the CAN SLIM® Master's Exam
The Bancorp (TBBK -$0.57 or -1.43% to $39.42) was highlighted in yellow with pivot point cited based on its 7/27/23 high plus 10 cents in the 12/04/23 mid-day report (read here). It is perched within close striking distance of its all-time high. Subsequent gains above the pivot point backed by at least +40% above average volume may trigger a technical buiy signal. Quarterly earnings increases above the +25% guideline satisfy the C criteria. Its annual earnings (A criteria) history has been steadily improving. The number of top-rated funds owning its share rose from 422 in Sep '12 to 454 in Sep '23, a reassuring sign concerning the I criteria. Its small supply (S criteria) of only 51 million shares in the public float can contribute to greater price volatility in the event of institutional buying or selling. |
|
|
Color Codes Explained :
Y - Better candidates highlighted by our
staff of experts.
G - Previously featured
in past reports as yellow but may no longer be buyable under the
guidelines.
***Last / Change / Volume data in this table is the closing quote data***
Symbol/Exchange
Company Name
Industry Group |
PRICE |
CHANGE
(%Change) |
Day High |
Volume
(% DAV)
(% 50 day avg vol) |
52 Wk Hi
% From Hi |
Featured
Date |
Price
Featured |
Pivot Featured |
|
Max Buy |
 ANET
-
NYSE
ANET
-
NYSE
Arista Networks
Computer-Networking
|
$215.71
|
+0.61
0.28% |
$216.11
|
1,010,960
46.52% of 50 DAV
50 DAV is 2,173,000
|
$223.52
-3.49%
|
10/31/2023
|
$188.84
|
PP = $198.80
|
|
MB = $208.74
|
Most Recent Note - 12/4/2023 6:23:46 PM
G - Pulled back today with below-average volume for a 2nd small loss but ended in the upper third of its intra-day range. Prior highs in the $198 area define near-term support above its 50 DMA line ($199.88). Fundamentals remain strong.
>>> FEATURED STOCK ARTICLE : Powerful Gain Following Earnings Report for Arista Networks - 10/31/2023 |
View all notes |
Set NEW NOTE alert |
Company Profile |
SEC
News |
Chart |
Request a new note
C
A
S
I |
NVO
-
NYSE
Novo Nordisk ADR
Medical-Ethical Drugs
|
$99.63
|
-1.29
-1.28% |
$99.88
|
2,785,764
58.96% of 50 DAV
50 DAV is 4,725,000
|
$105.69
-5.73%
|
11/2/2023
|
$100.97
|
PP = $104.10
|
|
MB = $109.31
|
Most Recent Note - 12/1/2023 10:07:59 PM
Y - Pulled back from its 52-week high with losses this week. Its 50 DMA line ($97.61) defines near-term support to watch. It has been repeatedly noted - "Subsequent gains for new highs backed by at least +40% above average volume are needed to trigger a technical buy signal."
>>> FEATURED STOCK ARTICLE : Approaching Prior High With Strong Fundamentals - 11/2/2023 |
View all notes |
Set NEW NOTE alert |
Company Profile |
SEC
News |
Chart |
Request a new note
C
A
S
I |
QLYS
-
NASDAQ
Qualys
Computer Sftwr-Security
|
$184.82
|
-2.89
-1.54% |
$186.37
|
452,530
128.20% of 50 DAV
50 DAV is 353,000
|
$188.65
-2.03%
|
11/3/2023
|
$167.50
|
PP = $165.03
|
|
MB = $173.28
|
Most Recent Note - 11/30/2023 5:18:07 PM
G - Posted a small gain today and closed near the session high with above-average volume for a new all-time high. Prior high ($165) defines initial support to watch on pullbacks.
>>> FEATURED STOCK ARTICLE : Powerful Breakout for Qualys - 11/3/2023 |
View all notes |
Set NEW NOTE alert |
Company Profile |
SEC
News |
Chart |
Request a new note
C
A
S
I |
AXON
-
NASDAQ
Axon Enterprise
Security/Sfty
|
$231.55
|
-4.73
-2.00% |
$234.99
|
387,510
84.06% of 50 DAV
50 DAV is 461,000
|
$236.38
-2.04%
|
11/8/2023
|
$127.84
|
PP = $223.30
|
|
MB = $234.47
|
Most Recent Note - 12/4/2023 6:25:11 PM
Y - Hit a new high as it posted a 3rd consecutive gain and closed near the session high. The recent low ($212.89 on 11/09/23) defines near-term support above its 50 DMA line ($213.63).
>>> FEATURED STOCK ARTICLE : Breakout for Axon as it Returns to Featured Stocks List - 11/8/2023 |
View all notes |
Set NEW NOTE alert |
Company Profile |
SEC
News |
Chart |
Request a new note
C
A
S
I |
TDG
-
NYSE
TransDigm Group
Aerospace/Defense
|
$955.51
|
-11.87
-1.23% |
$967.38
|
140,061
56.94% of 50 DAV
50 DAV is 246,000
|
$1,013.08
-5.68%
|
11/9/2023
|
$982.68
|
PP = $940.10
|
|
MB = $987.11
|
Most Recent Note - 11/30/2023 5:19:06 PM
G - Posted a gain today with average volume. Consolidating after briefly trading above the $1,000 threshold. Fundamentals remain strong. Prior high ($940) defines initial support to watch on pullbacks.
>>> FEATURED STOCK ARTICLE : TransDigm's Big Gap Up Gain Triggered Technical Buy Signal - 11/9/2023 |
View all notes |
Set NEW NOTE alert |
Company Profile |
SEC
News |
Chart |
Request a new note
C
A
S
I |
Symbol/Exchange
Company Name
Industry Group |
PRICE |
CHANGE
(%Change) |
Day High |
Volume
(% DAV)
(% 50 day avg vol) |
52 Wk Hi
% From Hi |
Featured
Date |
Price
Featured |
Pivot Featured |
|
Max Buy |
PANW
-
NASDAQ
Palo Alto Networks
Computer Sftwr-Security
|
$292.65
|
+6.04
2.11% |
$292.81
|
3,195,097
79.34% of 50 DAV
50 DAV is 4,027,000
|
$296.85
-1.41%
|
11/13/2023
|
$255.90
|
PP = $266.00
|
|
MB = $279.30
|
Most Recent Note - 12/4/2023 6:26:34 PM
G - Pulled back today with lighter (near average) volume breaking a streak of 6 consecutive gains for new all-time highs. Prior highs in the $265 area define initial support to watch above its 50 DMA line ($252). Fundamentals remain strong after it reported Oct '23 quarterly earnings +66% on +20% sales revenues versus the year-ago period.
>>> FEATURED STOCK ARTICLE : Earnings New Due While Perched Near Prior High - 11/13/2023 |
View all notes |
Set NEW NOTE alert |
Company Profile |
SEC
News |
Chart |
Request a new note
C
A
S
I |
URI
-
NYSE
United Rentals
Comml Svcs-Leasing
|
$475.50
|
-14.59
-2.98% |
$486.69
|
846,390
111.96% of 50 DAV
50 DAV is 756,000
|
$505.16
-5.87%
|
12/1/2023
|
$499.51
|
PP = $488.73
|
|
MB = $513.17
|
Most Recent Note - 12/1/2023 10:05:29 PM
Y - Finished strong today after highlighted in yellow with new pivot point cited based on its 11/15/23 high after a cup-with-handle base. Gain above the pivot point backed by +51% above average volume triggered a proper technical buy signal. Through Sep '23 its quarterly earnings increases versus the year-ago periods have been above the +25% minimum guideline (C criteria). Annual earnings (A criteria) history had a downturn in FY '20 like many companies during the pandemic. See the latest FSU analysis for more details and a new annotated graph.
>>> FEATURED STOCK ARTICLE : New Breakout For United Rentals - 12/1/2023 |
View all notes |
Set NEW NOTE alert |
Company Profile |
SEC
News |
Chart |
Request a new note
C
A
S
I |
AMPH
-
NASDAQ
Amphastar Pharm
Medical-Biomed/Biotech
|
$58.22
|
-1.70
-2.84% |
$59.93
|
485,806
124.57% of 50 DAV
50 DAV is 390,000
|
$67.66
-13.95%
|
12/4/2023
|
$60.84
|
PP = $58.35
|
|
MB = $61.27
|
Most Recent Note - 12/4/2023 12:29:09 PM
Y - Color code is changed to yellow with pivot point cited based on its 11/21/23 high after a cup-with-handle base. Rebounding toward its August all-time high, little resistance remains due to overhead supply. A gain and strong close above the pivot point backed by at least +40% above average volume may trigger a proper new technical buy signal. Fundamentals remain strong after it reported Sep '23 quarterly earnings +203% on +50% sales revenues versus the year-ago period. Found support at its 200 DMA line during its consolidation after dropped from the Featured Stocks list on 9/08/23.
>>> FEATURED STOCK ARTICLE : Amphastar Pharm on Track for 7th Weekly Gain - 12/4/2023 |
View all notes |
Set NEW NOTE alert |
Company Profile |
SEC
News |
Chart |
Request a new note
C
A
S
I |
TBBK
-
NASDAQ
The Bancorp
Banks-Northeast
|
$39.42
|
-0.57
-1.43% |
$39.87
|
341,795
97.94% of 50 DAV
50 DAV is 349,000
|
$41.52
-5.06%
|
12/4/2023
|
$39.88
|
PP = $41.62
|
|
MB = $43.70
|
 Most Recent Note - 12/5/2023 6:56:33 PM
Y - Pivot point cited is based on its 7/27/23 high plus 10 cents. Subsequent gains above the pivot point backed by at least +40% above average volume may trigger a technical buy signal. The 4 latest quarterly comparisons through Sep '23 had earnings increases above the +25% minimum guideline (C criteria) versus the year ago period. Annual earnings history has been strong. See the latest FSU analysis for more details and a new annotated graph.
>>> FEATURED STOCK ARTICLE : The Bancorp is Perched Near High with Strong Fundamentals - 12/5/2023 |
View all notes |
Set NEW NOTE alert |
Company Profile |
SEC
News |
Chart |
Request a new note
C
A
S
I |
|
|
|
THESE ARE NOT BUY RECOMMENDATIONS!
Comments contained in the body of this report are technical
opinions only. The material herein has been obtained
from sources believed to be reliable and accurate, however,
its accuracy and completeness cannot be guaranteed.
This site is not an investment advisor, hence it does
not endorse or recommend any securities or other investments.
Any recommendation contained in this report may not
be suitable for all investors and it is not to be deemed
an offer or solicitation on our part with respect to
the purchase or sale of any securities. All trademarks,
service marks and trade names appearing in this report
are the property of their respective owners, and are
likewise used for identification purposes only.
This report is a service available
only to active Paid Premium Members.
You may opt-out of receiving report notifications
at any time. Questions or comments may be submitted
by writing to Premium Membership Services 665 S.E. 10 Street, Suite 201 Deerfield Beach, FL 33441-5634 or by calling 1-800-965-8307
or 954-785-1121.
|
|
|