You are not logged in.
This means you
CAN ONLY VIEW reports that were published prior to Thursday, March 20, 2025.
You
MUST UPGRADE YOUR MEMBERSHIP if you want to see any current reports.
AFTER MARKET UPDATE - MONDAY, DECEMBER 4TH, 2023
Previous After Market Report Next After Market Report >>>
|
|
|
|
DOW |
-41.06 |
36,204.44 |
-0.11% |
|
Volume |
1,020,253,533 |
-1% |
|
Volume |
6,449,016,400 |
+12% |
|
NASDAQ |
-119.54 |
14,185.49 |
-0.84% |
|
Advancers |
1,397 |
49% |
|
Advancers |
2,362 |
54% |
|
S&P 500 |
-24.85 |
4,569.78 |
-0.54% |
|
Decliners |
1,435 |
51% |
|
Decliners |
2,006 |
46% |
|
Russell 2000 |
+19.37 |
1,882.02 |
+1.04% |
|
52 Wk Highs |
152 |
|
|
52 Wk Highs |
171 |
|
|
S&P 600 |
+15.72 |
1,220.24 |
+1.31% |
|
52 Wk Lows |
11 |
|
|
52 Wk Lows |
80 |
|
|
 |
Major Indices Fell While Small Caps Outperformed
Kenneth J. Gruneisen - Passed the CAN SLIM® Master's Exam
The market-cap weighted S&P 500 closed with a 0.5% loss while the equal-weighted S&P 500 eked out a 0.1% gain. Volume was reported near the prior session total on the NYSE and higher on the Nasdaq exchange. Decliners led advancers by a narrow margin on the NYSE and advancers led decliners by a narrow margin on the Nasdaq exchange. There were 93 high-ranked companies from the Leaders List that hit new 52-week highs and were listed on the BreakOuts Page, versus the total of 110 on the prior session. New 52-week highs outnumbered shrinking new 52-week lows on the NYSE and on the Nasdaq exchange. The major indices are in a confirmed uptrend (M criteria). New buying efforts should be only made in stocks fitting all key criteria of the fact-based investment system.
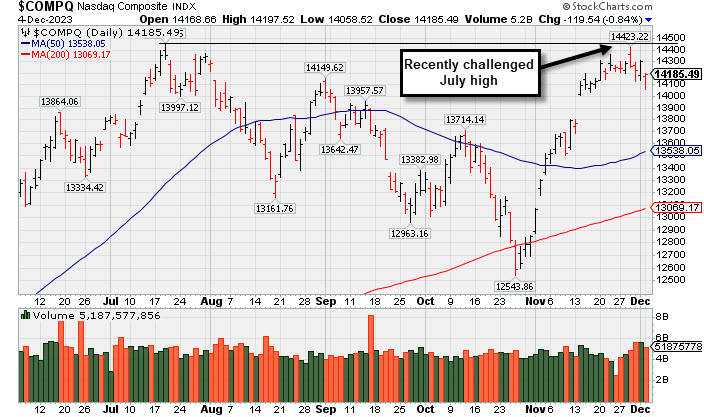
PICTURED: The Nasdaq Composite Index is churning higher volume while consolidating after challenging its July high. Weakness in semiconductor stocks weighed on the market and NVIDIA (NVDA -2.68%) was one of the most influential decliners as the PHLX Semiconductor Index fell 1.2%. Airlines were winning standouts after news that Alaska Air (ALK -14.22%) plans to acquire Hawaiian Holdings (HA +192.59%) for $18.00 per share. Banks, retailers, and homebuilders were also relatively strong.
Coinbase Global (COIN +5.5%) and other crypto-related stocks rose, benefitting from recent rise in cryptocurrency prices. Bitcoin is at $40,632 after briefly rising past $41,000 and Ethereum is at $2,228.75. Gold futures settled $47.50 lower (-2.3%) to $2,042.20/oz, ending firmly off overnight all-time highs above $2,100/oz. The 2-yr note yield rose nine basis points to 4.65% and the 10-yr note yield rose six basis points to 4.29%.
|
 Kenneth J. Gruneisen started out as a licensed stockbroker in August 1987, a couple of months prior to the historic stock market crash that took the Dow Jones Industrial Average down -22.6% in a single day. He has published daily fact-based fundamental and technical analysis on high-ranked stocks online for two decades. Through FACTBASEDINVESTING.COM, Kenneth provides educational articles, news, market commentary, and other information regarding proven investment systems that work in good times and bad.
Comments contained in the body of this report are technical opinions only and are not necessarily those of Gruneisen Growth Corp. The material herein has been obtained from sources believed to be reliable and accurate, however, its accuracy and completeness cannot be guaranteed. Our firm, employees, and customers may effect transactions, including transactions contrary to any recommendation herein, or have positions in the securities mentioned herein or options with respect thereto. Any recommendation contained in this report may not be suitable for all investors and it is not to be deemed an offer or solicitation on our part with respect to the purchase or sale of any securities. |
|
 |
Bank and Biotech Indexes Rose as Other Groups Struggled
Kenneth J. Gruneisen - Passed the CAN SLIM® Master's Exam
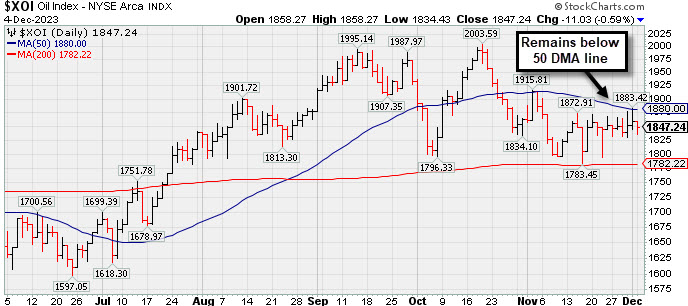
The Bank Index ($BKX +0.46%) edged higher as the Broker/Dealer Index ($XBD +0.03%) held its ground, but the Retail Index ($RLX -0.79%) created a drag on the major indices.The tech sector was mixed as the Biotech Index ($BTK +0.63%) edged higher and the Networking Index ($NWX -0.10%) was little changed but the Semiconductor Index ($SOX -1.60%) lost ground. Commodity-linked groups had a negative bias as the Gold & Silver Index ($XAU -2.71%) outpaced the Integrated Oil Index ($XOI -0.70%) and the Oil Servicesd Index ($OSX -0.49%) to the downside.
PICTURED: The Integrated Oil Index ($XOI -0.70%) remains below its 50-day moving average (DMA) line which has recently acted as resistance.
| Oil Services |
$OSX |
82.43 |
-0.30 |
-0.37% |
-1.71% |
| Integrated Oil |
$XOI |
1,847.24 |
-11.03 |
-0.59% |
+3.36% |
| Semiconductor |
$SOX |
3,693.44 |
-44.82 |
-1.20% |
+45.86% |
| Networking |
$NWX |
750.63 |
+3.47 |
+0.46% |
-4.17% |
| Broker/Dealer |
$XBD |
505.40 |
+1.70 |
+0.34% |
+12.53% |
| Retail |
$RLX |
3,705.16 |
-18.36 |
-0.49% |
+34.54% |
| Gold & Silver |
$XAU |
122.45 |
-3.35 |
-2.66% |
+1.32% |
| Bank |
$BKX |
87.68 |
+0.43 |
+0.49% |
-13.05% |
| Biotech |
$BTK |
4,964.89 |
+41.31 |
+0.84% |
-5.99% |
|
|
|
 |
Amphastar Pharm on Track for 7th Weekly Gain
Kenneth J. Gruneisen - Passed the CAN SLIM® Master's Exam
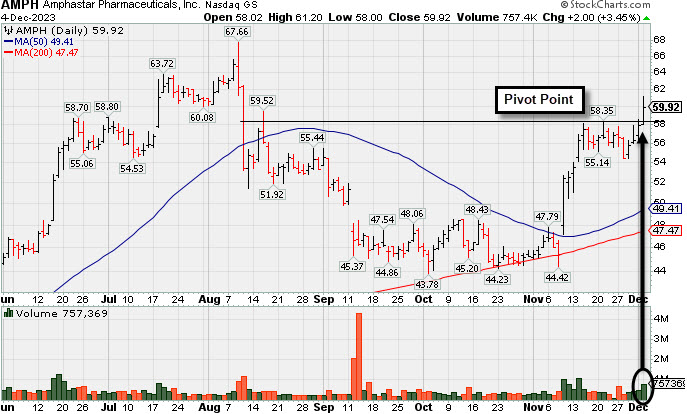
Amphastar Pharm (AMPH +$2.00 or +3.45% to $59.92) was highlighted in yellow in the earlier mid-day report (read here) with pivot point cited based on its 11/21/23 high after a cup-with-handle base. It is rebounding toward its August all-time high, and little resistance remains due to overhead supply. Today's gain and strong close above the pivot point backed by +100% above average volume triggered a technical buy signal.
Fundamentals remain strong after it reported Sep '23 quarterly earnings +203% on +50% sales revenues versus the year-ago period. It was last coverned in greater detail on 8/22/23 with an annotated graph under the headline "Rebound Above 50-Day Moving Average Needed for Outlook to Improve". AMPH found support at its 200 DMA line during its consolidation after dropped from the Featured Stocks list on 9/08/23.
It hails from the Medical-Biomed/Biotech group which is currently ranked 91st on the 197 Industry Groups list (L criteria). It has a 99 Earnings Per Share Rating, well above the 80+ minimum guideline for buy candidates. The 4 latest quarterly comparisons through Sep '23 have been well above the +25% minimum earnings guideline (C criteria). Annual earnings history (A criteria) has been strong.
The number of top-rated funds owning its shares reportedly rose from 435 in Mar '23 to 468 in Sep '23, a reassuring sign concerning the I criteria. Its current Up/Down Volume Ratio of 1.6 is an unbiased indication its shares have been under accumulation over the past 50 days.
|
|
|
Color Codes Explained :
Y - Better candidates highlighted by our
staff of experts.
G - Previously featured
in past reports as yellow but may no longer be buyable under the
guidelines.
***Last / Change / Volume data in this table is the closing quote data***
Symbol/Exchange
Company Name
Industry Group |
PRICE |
CHANGE
(%Change) |
Day High |
Volume
(% DAV)
(% 50 day avg vol) |
52 Wk Hi
% From Hi |
Featured
Date |
Price
Featured |
Pivot Featured |
|
Max Buy |
 ANET
-
NYSE
ANET
-
NYSE
Arista Networks
Computer-Networking
|
$215.10
|
-1.54
-0.71% |
$216.39
|
1,741,365
80.40% of 50 DAV
50 DAV is 2,166,000
|
$223.52
-3.77%
|
10/31/2023
|
$188.84
|
PP = $198.80
|
|
MB = $208.74
|
 Most Recent Note - 12/4/2023 6:23:46 PM
G - Pulled back today with below-average volume for a 2nd small loss but ended in the upper third of its intra-day range. Prior highs in the $198 area define near-term support above its 50 DMA line ($199.88). Fundamentals remain strong.
>>> FEATURED STOCK ARTICLE : Powerful Gain Following Earnings Report for Arista Networks - 10/31/2023 |
View all notes |
Set NEW NOTE alert |
Company Profile |
SEC
News |
Chart |
Request a new note
C
A
S
I |
NVO
-
NYSE
Novo Nordisk ADR
Medical-Ethical Drugs
|
$100.92
|
+0.52
0.52% |
$101.15
|
2,986,500
63.22% of 50 DAV
50 DAV is 4,724,000
|
$105.69
-4.51%
|
11/2/2023
|
$100.97
|
PP = $104.10
|
|
MB = $109.31
|
Most Recent Note - 12/1/2023 10:07:59 PM
Y - Pulled back from its 52-week high with losses this week. Its 50 DMA line ($97.61) defines near-term support to watch. It has been repeatedly noted - "Subsequent gains for new highs backed by at least +40% above average volume are needed to trigger a technical buy signal."
>>> FEATURED STOCK ARTICLE : Approaching Prior High With Strong Fundamentals - 11/2/2023 |
View all notes |
Set NEW NOTE alert |
Company Profile |
SEC
News |
Chart |
Request a new note
C
A
S
I |
QLYS
-
NASDAQ
Qualys
Computer Sftwr-Security
|
$187.71
|
-0.30
-0.16% |
$188.65
|
394,622
112.75% of 50 DAV
50 DAV is 350,000
|
$188.37
-0.35%
|
11/3/2023
|
$167.50
|
PP = $165.03
|
|
MB = $173.28
|
Most Recent Note - 11/30/2023 5:18:07 PM
G - Posted a small gain today and closed near the session high with above-average volume for a new all-time high. Prior high ($165) defines initial support to watch on pullbacks.
>>> FEATURED STOCK ARTICLE : Powerful Breakout for Qualys - 11/3/2023 |
View all notes |
Set NEW NOTE alert |
Company Profile |
SEC
News |
Chart |
Request a new note
C
A
S
I |
AXON
-
NASDAQ
Axon Enterprise
Security/Sfty
|
$236.36
|
+4.85
2.09% |
$236.38
|
526,567
114.97% of 50 DAV
50 DAV is 458,000
|
$233.80
1.09%
|
11/8/2023
|
$127.84
|
PP = $223.30
|
|
MB = $234.47
|
Most Recent Note - 12/4/2023 6:25:11 PM
Y - Hit a new high as it posted a 3rd consecutive gain and closed near the session high. The recent low ($212.89 on 11/09/23) defines near-term support above its 50 DMA line ($213.63).
>>> FEATURED STOCK ARTICLE : Breakout for Axon as it Returns to Featured Stocks List - 11/8/2023 |
View all notes |
Set NEW NOTE alert |
Company Profile |
SEC
News |
Chart |
Request a new note
C
A
S
I |
TDG
-
NYSE
TransDigm Group
Aerospace/Defense
|
$967.38
|
-2.89
-0.30% |
$969.53
|
168,744
68.88% of 50 DAV
50 DAV is 245,000
|
$1,013.08
-4.51%
|
11/9/2023
|
$982.68
|
PP = $940.10
|
|
MB = $987.11
|
Most Recent Note - 11/30/2023 5:19:06 PM
G - Posted a gain today with average volume. Consolidating after briefly trading above the $1,000 threshold. Fundamentals remain strong. Prior high ($940) defines initial support to watch on pullbacks.
>>> FEATURED STOCK ARTICLE : TransDigm's Big Gap Up Gain Triggered Technical Buy Signal - 11/9/2023 |
View all notes |
Set NEW NOTE alert |
Company Profile |
SEC
News |
Chart |
Request a new note
C
A
S
I |
Symbol/Exchange
Company Name
Industry Group |
PRICE |
CHANGE
(%Change) |
Day High |
Volume
(% DAV)
(% 50 day avg vol) |
52 Wk Hi
% From Hi |
Featured
Date |
Price
Featured |
Pivot Featured |
|
Max Buy |
PANW
-
NASDAQ
Palo Alto Networks
Computer Sftwr-Security
|
$286.62
|
-9.54
-3.22% |
$295.00
|
4,639,272
116.59% of 50 DAV
50 DAV is 3,979,000
|
$296.85
-3.44%
|
11/13/2023
|
$255.90
|
PP = $266.00
|
|
MB = $279.30
|
Most Recent Note - 12/4/2023 6:26:34 PM
G - Pulled back today with lighter (near average) volume breaking a streak of 6 consecutive gains for new all-time highs. Prior highs in the $265 area define initial support to watch above its 50 DMA line ($252). Fundamentals remain strong after it reported Oct '23 quarterly earnings +66% on +20% sales revenues versus the year-ago period.
>>> FEATURED STOCK ARTICLE : Earnings New Due While Perched Near Prior High - 11/13/2023 |
View all notes |
Set NEW NOTE alert |
Company Profile |
SEC
News |
Chart |
Request a new note
C
A
S
I |
URI
-
NYSE
United Rentals
Comml Svcs-Leasing
|
$490.09
|
-11.74
-2.34% |
$497.13
|
1,013,051
135.62% of 50 DAV
50 DAV is 747,000
|
$505.16
-2.98%
|
12/1/2023
|
$499.51
|
PP = $488.73
|
|
MB = $513.17
|
Most Recent Note - 12/1/2023 10:05:29 PM
Y - Finished strong today after highlighted in yellow with new pivot point cited based on its 11/15/23 high after a cup-with-handle base. Gain above the pivot point backed by +51% above average volume triggered a proper technical buy signal. Through Sep '23 its quarterly earnings increases versus the year-ago periods have been above the +25% minimum guideline (C criteria). Annual earnings (A criteria) history had a downturn in FY '20 like many companies during the pandemic. See the latest FSU analysis for more details and a new annotated graph.
>>> FEATURED STOCK ARTICLE : New Breakout For United Rentals - 12/1/2023 |
View all notes |
Set NEW NOTE alert |
Company Profile |
SEC
News |
Chart |
Request a new note
C
A
S
I |
AMPH
-
NASDAQ
Amphastar Pharm
Medical-Biomed/Biotech
|
$59.92
|
+2.00
3.45% |
$61.20
|
757,369
200.36% of 50 DAV
50 DAV is 378,000
|
$67.66
-11.44%
|
12/4/2023
|
$60.84
|
PP = $58.35
|
|
MB = $61.27
|
Most Recent Note - 12/4/2023 12:29:09 PM
Y - Color code is changed to yellow with pivot point cited based on its 11/21/23 high after a cup-with-handle base. Rebounding toward its August all-time high, little resistance remains due to overhead supply. A gain and strong close above the pivot point backed by at least +40% above average volume may trigger a proper new technical buy signal. Fundamentals remain strong after it reported Sep '23 quarterly earnings +203% on +50% sales revenues versus the year-ago period. Found support at its 200 DMA line during its consolidation after dropped from the Featured Stocks list on 9/08/23.
>>> FEATURED STOCK ARTICLE : Amphastar Pharm on Track for 7th Weekly Gain - 12/4/2023 |
View all notes |
Set NEW NOTE alert |
Company Profile |
SEC
News |
Chart |
Request a new note
C
A
S
I |
TBBK
-
NASDAQ
The Bancorp
Banks-Northeast
|
$39.99
|
+0.90
2.30% |
$40.44
|
880,722
263.69% of 50 DAV
50 DAV is 334,000
|
$41.52
-3.68%
|
12/4/2023
|
$39.88
|
PP = $41.62
|
|
MB = $43.70
|
Most Recent Note - 12/4/2023 1:25:09 PM
Y - Color code is changed to yellow with pivot point cited based on its 7/27/23 high plus 10 cents. Today's gain has it perched within close striking distance of its all-time high. Subsequent gains above the pivot point backed by at least +40% above average volume may trigger a technical buy signal. The 4 latest quarterly comparisons through Sep '23 had earnings increases above the +25% minimum guideline (C criteria) versus the year ago period. Annual earnings history has been strong.
>>> FEATURED STOCK ARTICLE : Encountering Distributional Pressure While Consolidating Above Prior Highs - 10/3/2013 |
View all notes |
Set NEW NOTE alert |
Company Profile |
SEC
News |
Chart |
Request a new note
C
A
S
I |
|
|
|
THESE ARE NOT BUY RECOMMENDATIONS!
Comments contained in the body of this report are technical
opinions only. The material herein has been obtained
from sources believed to be reliable and accurate, however,
its accuracy and completeness cannot be guaranteed.
This site is not an investment advisor, hence it does
not endorse or recommend any securities or other investments.
Any recommendation contained in this report may not
be suitable for all investors and it is not to be deemed
an offer or solicitation on our part with respect to
the purchase or sale of any securities. All trademarks,
service marks and trade names appearing in this report
are the property of their respective owners, and are
likewise used for identification purposes only.
This report is a service available
only to active Paid Premium Members.
You may opt-out of receiving report notifications
at any time. Questions or comments may be submitted
by writing to Premium Membership Services 665 S.E. 10 Street, Suite 201 Deerfield Beach, FL 33441-5634 or by calling 1-800-965-8307
or 954-785-1121.
|
|
|